
Summary:
-
The Trend Strength Index measures the strength of the current trend for a coin/asset.
-
This indicator is useful to traders because those who want to place a long order need confirmation that the bullish trend is strong. Likewise, traders who predict the price is going to keep going down need confirmation that the downtrend is strong, before taking a short position.
-
The TSI should not be used to predict future trends, but to confirm trading bias and the strength of the current trend.
For any crypto trader, one of the key questions to ask during a price move is: “How strong is this trend?” Enter the Trend Strength Index (TSI) – a technical indicator designed to measure the strength and momentum of a current trend. In the volatile world of crypto, being able to gauge trend strength can help you distinguish between a minor blip and a significant move. Whether you’re a crypto-curious newcomer or an intermediate investor, understanding TSI can give you an edge. It’s particularly useful if you’ve ever found yourself wondering if a rally has enough steam to keep going, or if a dip is truly gaining bearish momentum or about to fizzle out. In this article, we’ll break down everything you need to know about the Trend Strength Index and how to leverage it in crypto trading.

What Is The Trend Strength Index?
Trend Strength Index is a momentum oscillator that can be used to measure the trend strength for Bitcoin (BTC) and altcoins. Traders that want to place a long order need confirmation that the bullish trend is strong. Likewise, traders who predict the price is going to keep going down need confirmation that the downtrend is strong, before taking a short position.
This is how the TSI confirms the trend–if Bitcoin is in an uptrend, the TSI indicator measures whether the trend will continue for a longer period, and if Bitcoin is in a downtrend it measures when it could potentially reverse. It does this by tracking the support and resistance levels where Bitcoin might struggle to hold a trend. Support levels are areas where more people are buying, and resistance levels are areas where more people are selling. Once Bitcoin’s price reaches support and resistance levels, this can weaken the trend direction and cause a reversal in the opposite direction.

The TSI indicator can be used on long-term charts (1M, 1W) and short-term charts (1D, 4H, 1H). It is important to emphasize that the TSI should not be used to predict future trends, but only to confirm trading bias and the strength of the current trend.
It has a base value of zero; the upper thresholds hold a value of +1 while the lower thresholds hold a value of -1. If the price of Bitcoin is trending near the upper extremities of the oscillator, this indicates a strong bullish trend. If it’s trending near the lower barriers, it indicates a strong bearish trend. If the indicator is trending near the zero mean value, it means that the market is trending sideways.
A highly volatile indicator that oscillates from positive to negative territory fast, the TSI indicator is based on the Exponential Moving Average (EMA) indicator measured over 13 and 25 periods.

Trends in the upper boundary are bullish and in the lower boundary are bearish.
To repeat, traders should look for values above or below the mean value to confirm a strong trend. If the indicator reaches the upper barriers, this means that Bitcoin is in a strong bullish trend and could continue on the upside. If Bitcoin reaches the bottom of the index, it could continue on the downtrend or bounce from support levels.
This indicator should not be used in isolation due to market volatility and the emphasis on recent data. It is recommended that the Trend Strength Index be used with other indicators such as the Relative Strength Index or Bollinger Bands, which derive data from longer periods and can give additional context about the support and resistance levels, to more accurately analyze potential breakouts or divergences.
Trend Strength Index Formula

Psychology of the Trend Strength Index
Traders use the Trend Strength Index (TSI) for confidence and validation in their market decisions. When seeing a breakout, checking TSI can confirm whether the move has real momentum. A rising TSI indicates strong bullish activity, encouraging traders to hold or increase their positions. Conversely, if TSI is flat or negative during a price rise, it suggests weak momentum, prompting a reassessment.
Psychologically, TSI helps traders deal with biases. A strong, positive TSI reinforces bullish sentiment, easing anxiety about a long position. On the other hand, a negative TSI challenges traders to reconsider their perspective, preventing them from clinging to a failing trade.
Additionally, TSI reflects collective market sentiment: high values indicate aggressive buying, while low values suggest bearish confidence. By measuring trend strength, TSI helps reduce uncertainty in trading decisions. It enables traders to let winning trades run or adjust stops on weaker trends.
Most importantly, traders should use TSI objectively, avoiding confirmation bias. The aim is to allow the indicator to inform and challenge their assumptions. Ultimately, TSI builds confidence when traders are correct and encourages caution when they might be mistaken, helping to navigate market momentum effectively.
How To Use The Trend Strength Indicator?
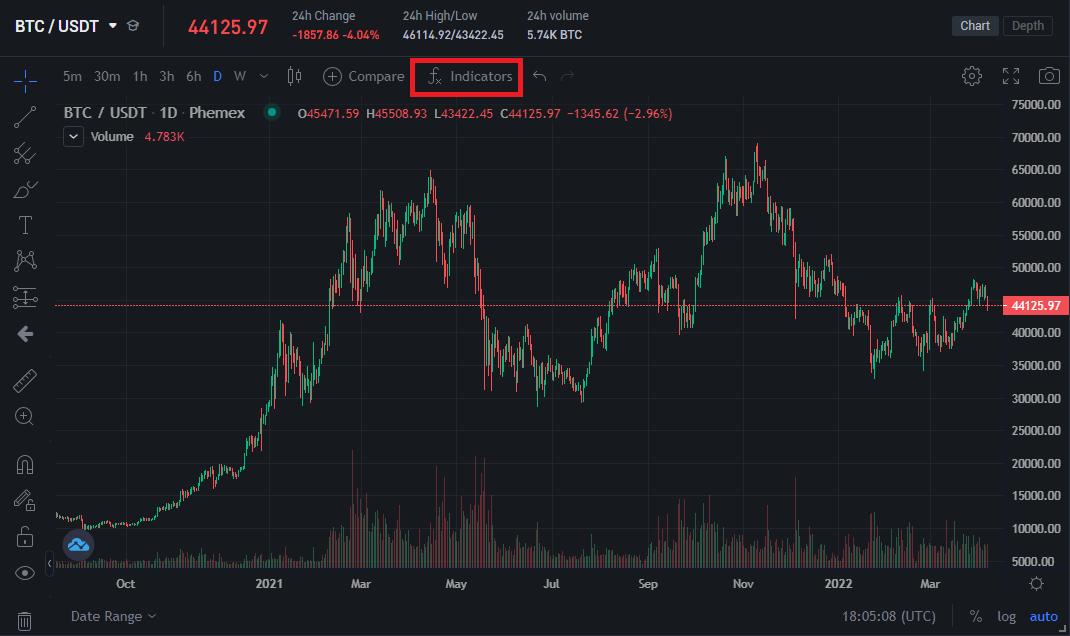
The Bitcoin chart is the most traded chart on Phemex.
The search window will appear. Input “Trend Strength Index” to locate the indicator:

Use the search bar to access all available trading indicators.
Left-click on the indicator and it will automatically load beneath the Bitcoin candles:

The Trend Strength Index oscillating below the Bitcoin chart.
The TSI indicator is now active. We can see that it oscillates between the +1 to -1 thresholds and how the price action on the daily chart reflects the trend strength underneath. A strong trend is indicated by any trend above the mean value of zero. For example, if the indicator goes below 0 to -0.5, this indicates a strong bearish trend. If it goes above 0 to +0.5, it indicates a strong bullish trend.
Long-Term Trading with TSI
For long-term trend strength data, choose charts such as 1D (daily), 1W (weekly) or 1M (monthly). It’s recommended to combine the indicator with long-term indicators such as Relative Strength Index and Bollinger Bands.
For this demonstration, we’re going to load the indicators simultaneously on the daily chart:

Bollinger Bands (top), Trend Strengths Index (middle), and RSI (bottom).
The current trend is bearish and the indicator is signaling a bullish reversal near critical support levels. According to the Trend Strength Indicator, we have reached the lower threshold of the indicator at -1 and going sideways which indicates a potential reversal is coming.
The RSI indicator identifies “Overbought” and “Oversold” levels in the price action. Bitcoin is currently near the lower barriers of oversold territory and trading near historic support levels. This indicates that the trend could reverse to the upside and we are seeing slight bullish movement on the RSI signal line.
Bollinger Bands are the blue barriers enveloping the Bitcoin candles. They derive data from historic moving averages (MA) and indicate critical support and resistance levels. According to Bollinger Bands, Bitcoin has fallen below a historic support area which indicates that a reversal to the upside could come.
Short-Term Trading with TSI
For short-term trading such as swing trading, the direction of the trend helps traders buy low and sell high. Choose a short-term chart such as 1H (hourly) or 15M (15 minutes) to identify the power of the price trend in the short-term. For this demonstration, we’ll choose the hourly chart:

The most effective strategy here is to wait for the indicator to reach a mean value of zero. If it oscillates near the mean value and is going in a clear direction, we can open a long or short order accordingly. The TSI indicator quickly reaches the upper and lower thresholds, hence an ideal time to open a trade is when it oscillates in the middle.
The current short-term chart shows sideways/choppy price action. The indicator has a strong bullish trend which could mean a breakout to the upside is on the horizon. However, it could also mean we can expect a bearish divergence.
According to the RSI indicator on the hourly chart, Bitcoin is currently trading sideways and could go in either direction. The Bollinger Bands confirm this as the candles are trading in the middle of the bands, making it hard to predict if there’s going to be a breakout.
Pro Tip: Long-term chart data can be used to identify short-term price movement. The long-term data shows that Bitcoin is currently trading near historic support levels where it bounced in the past. This indicates that we are more likely to see bullish action in the immediate short-term future.

How to Identify Signals from TSI
Reading the Trend Strength Index (TSI) involves monitoring its value relative to key levels and its behavior over time. Here are the main signals to look for:
-
Crossing Zero: A bullish signal occurs when TSI crosses above 0, indicating upward momentum, while a bearish signal happens when it crosses below 0, signaling downward momentum.
-
Threshold Exceedance: Traders often use thresholds like +25 and -25 to confirm trends. A TSI above +25 indicates a strong bullish trend, while below -25 indicates a strong bearish trend. Values in between suggest weaker movements.
-
Peak and Trough Patterns: Identify momentum peaks when TSI reaches a high and begins to decline, suggesting weakening upward momentum. Conversely, a trough occurs when TSI hits a low and turns up, signaling a waning downtrend.
-
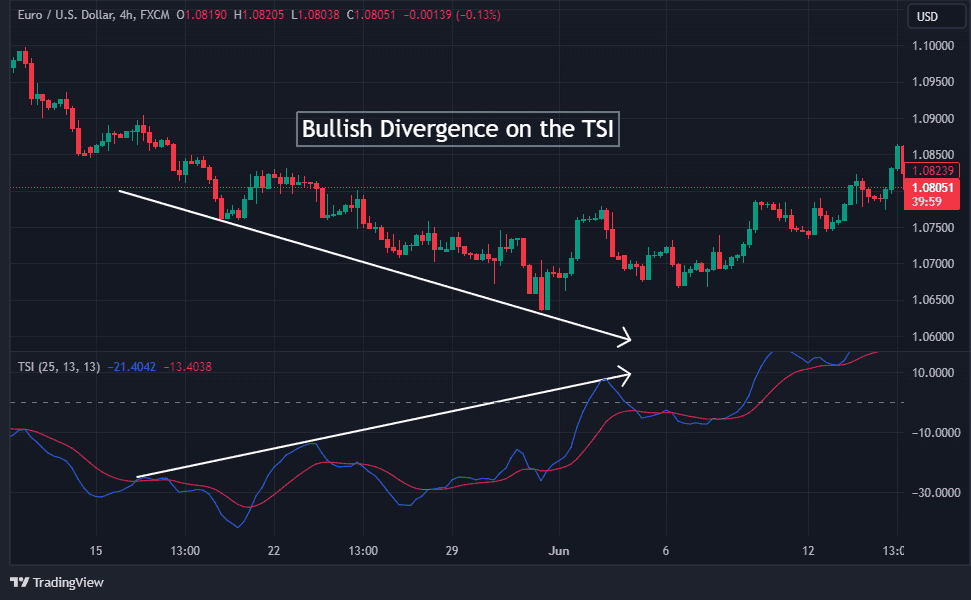
Divergences:
-
Bullish Divergence: When price makes a lower low but TSI makes a higher low, it suggests weakening bearish strength and potential price reversal.
-
Bearish Divergence: When price makes a higher high but TSI makes a lower high, it indicates a weakening uptrend that could reverse.
-
-
Signal Line Crossovers:
-
A bullish crossover occurs when TSI crosses above its signal line, suggesting increasing upward momentum.
-
A bearish crossover occurs when TSI crosses below its signal line, indicating declining momentum.
-
For example, if Cardano (ADA) is drifting higher with TSI below zero, a subsequent jump from -5 to +20 crossing zero would indicate a bullish shift. If TSI later shows a lower high while ADA makes a new high, that's a bearish divergence, suggesting the uptrend is weakening.
Marking key levels like 0, +25, and -25 on your TSI helps in quickly identifying trends. The next step is to act on these signals for trading.
TSI vs ADX: Which Is More Effective Trend Strength indicator?
The Average Directional Index (ADX) is a trend strength indicator similar to the TSI Trend Strength Index. Both indicators are used to measure the strength of the current trend, without predicting the future direction. To compare the effectiveness of both, we can load them simultaneously on the Bitcoin chart:

The ADX indicator is an alternative trend strength measurement tool.
The main difference is that the Average Directional Index has a larger range from 0 to +40. This means the scope of the measurement is higher on the ADX and the TSI oscillates to extremes a lot faster. The ADX is based on two moving averages, giving additional context for traders based on historic data.
Both indicators can be used in conjunction to confirm the strength of the trend. At the moment, they indicate that Bitcoin is trading near historic support levels and is reversing to the upside. The ADX indicator shows that Bitcoin could further depreciate and has not hit absolute bottom.
Conclusion
The Trend Strength Index indicator uses absolute values, meaning it oscillates between extremes fast. The indicator should not be used to predict future trends, but rather to confirm current trends. If we suspect Bitcoin is in a bullish trend, we can use the TSI indicator to measure the strength of this trend. Traders should not rely on the TSI indicator in isolation, but combine it with other indicators. The limitation of this indicator is that it’s based on a short-term EMA and outputs results, based on recent data. Indicators such as the Average Directional Index could be used as a supplement to confirm trend strength. The TSI indicator can also be combined with long-term indicators such as RSI and Bollinger Bands that signal a possible future direction.
Armed with this knowledge, the next step is to put it into practice, and that’s where having a reliable trading platform becomes crucial. Phemex provides an ideal environment to apply TSI analysis in your crypto trading routine. Phemex’s trading interface offers advanced charting tools (with indicators like TSI, RSI, ADX, etc. readily available) so you can easily overlay the Trend Strength Index on your favorite crypto charts and customize its parameters to your liking. Whether you trade Bitcoin, Ethereum or any number of altcoins, you’ll be able to gauge their trend momentum in real-time on Phemex.
Read More
- What Is True Strength Index (TSI): Crypto Divergence & Trend Trading
- What Is Trend Trading: Following the Market When It Pays
- What is RSI: How To Trade Bitcoin With The RSI Indicator
- What Is A Trend Line? How to Draw & Use For Crypto Trading
- What Is SMI Ergodic Indicator: Confirm Trends For Risky Trades
- Uptrends and Downtrends: How to Spot and Trade Them?
- Supertrend Indicator: How to calculate and use it?
- The TTM Squeeze Indicator: What Is It and How to Use It?