

Summary
-
Swing Trading Definition: Swing trading is a strategy aimed at capturing short-to-medium term price swings in assets. Trades are held for days or weeks, allowing traders to capitalize on significant moves based on market analysis and indicators. It suits those who can’t monitor markets constantly and serves as a less intense alternative to day trading.
-
Fundamental vs Technical Analysis: Swing traders use a mix of fundamental analysis (news and events) and technical analysis (charts and indicators) to spot opportunities. For instance, Ethereum’s transition to proof-of-stake in September 2022 hinted at potential price shifts for traders to exploit. They commonly rely on indicators like moving averages, the RSI, and volume trends for timing trades.
-
Key Indicators & Strategies: Popular swing trading tools include Moving Averages, RSI, and On-Balance Volume (OBV). Common strategies involve trading breakouts, breakdowns, and retracements, allowing traders to make systematic entry and exit decisions based on market trends.
-
Risk Management is Vital: Discipline and risk management are crucial for successful swing trading. Utilizing stop-loss and take-profit orders helps protect gains and limit losses. Modern exchanges like Phemex offer advanced conditional orders, enabling traders to manage positions while balancing other commitments.
In this guide, we’ll explore swing trading, compare it to other styles, and provide methods to start swing trading Bitcoin, along with insights on indicators and strategies for crypto trading. Let’s dive in!

What Is Swing Trading?
Swing trading is an approach to trading that aims to capture short- to medium-term moves in a market. A swing trader tries to predict an upcoming price swing (either upward or downward) and profit from it. Unlike day traders (who open and close multiple trades within the same day) or long-term investors (who HODL assets for months or years), swing traders hold positions for a few days up to a few weeks, depending on when the expected price move materializes.
Swing trading sits in the “sweet spot” between fast-paced day trading and patient long-term investing. It doesn’t require instant decisions every minute, but it’s more active than simply buying and holding for years. The goal of a swing trader is to enter near the start of a price swing and exit before or as soon as the swing ends, thereby capturing the bulk of the move.
Key characteristics of swing trading include:
-
Medium Time Frame: Trades typically last from several days to a few weeks. For example, a swing trader might buy Bitcoin after noticing a bullish pattern and hold it for 10 days until the price reaches a target resistance level.
-
Analysis-Driven Entries: Swing traders use analysis to find assets that are poised for a significant move. This could be a technical pattern (like a breakout from a price range) or a fundamental catalyst (like an upcoming software upgrade or economic event).
-
Fewer Trades, More Patience: Compared to day trading, swing trading involves fewer total trades. Traders must be patient, waiting for the right setups and then holding through the swing, rather than constantly buying and selling all day.
-
Aim for Chunky Gains: Because the holding period is longer, swing trades usually aim for larger price changes (for instance, capturing a 10% swing in price) rather than the tiny scalps or 1-2% moves that a day trader might chase.
In essence, swing trading Bitcoin means trying to profit from the natural ebb and flow of Bitcoin’s market price. Bitcoin’s price rarely moves in a straight line – it oscillates in waves or swings. Swing traders attempt to ride those waves. It’s a strategy well-suited to the volatile nature of cryptocurrencies, where sizable price swings can occur even in relatively short time spans.
Swing Trading vs. Day Trading vs. HODLing
Swing trading is often compared to day trading and “buy-and-hold” (HODL) investing.
-
Swing Trading vs. Day Trading: Day traders execute multiple trades within a single day, holding positions for minutes or hours and avoiding overnight holds. This fast-paced approach requires constant market monitoring and quick decisions. In contrast, swing traders hold positions for longer periods, sometimes several nights, allowing for a more measured approach with less stress. While day trading can yield quick profits, it also carries the risk of quick losses, whereas swing trading focuses on gradual gains.
-
Swing Trading vs. Buy-and-Hold (HODL): HODLers are long-term investors who buy and hold assets despite short-term fluctuations, believing in their long-term value. Swing traders, however, seek to profit from short- to mid-term price movements, actively timing the market. They might sell during pullbacks or buy in anticipation of recoveries, contrasting with the passive nature of HODLing.
In summary, swing trading offers a balanced approach that caters to those wanting an active trading strategy without the demands of day trading or the long-term commitment of HODLing.
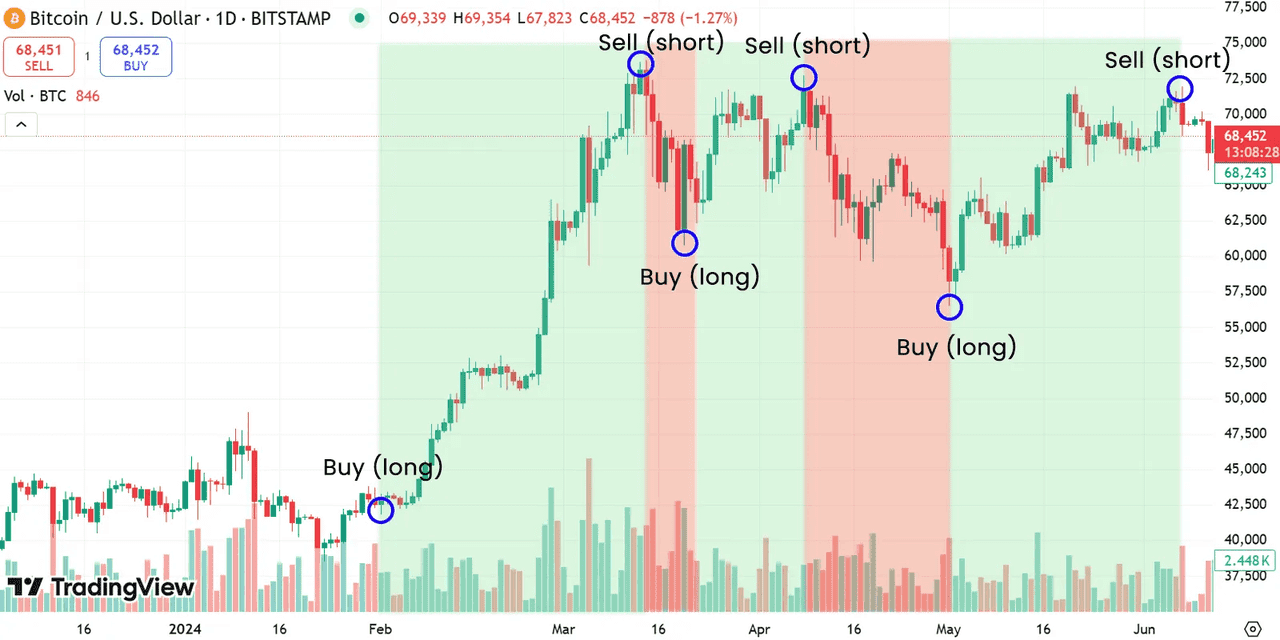
Swing Trading Bitcoin (source)
How to Start Swing Trading Bitcoin
Getting into swing trading Bitcoin involves developing analytical skills and a solid trading plan. Here are the essential steps:
-
Learn Market Analysis: Understand both fundamental and technical analysis. Familiarize yourself with price charts, patterns, and factors influencing Bitcoin’s price.
-
Choose Your Approach: Swing traders typically use fundamental analysis (researching real-world factors affecting Bitcoin, such as regulatory news or adoption trends) and technical analysis (focusing on price movements and chart patterns). Most traders blend both approaches, keeping an eye on major events while timing trades with technical signals.
-
Set up a Trading Plan: Define clear rules for your trades. Specify your entry and exit strategies based on technical indicators (e.g., buying when Bitcoin breaks above its 50-day moving average). Determine your trading time frame, often using multi-day charts.
-
Use Proper Risk Management: Set stop-loss levels to exit losing trades and establish take-profit targets for winning trades. Many traders risk only 1-2% of their capital on each trade and utilize conditional orders to automate exits.
-
Practice and Refine: Before trading with real money, it’s advisable to practice your strategies on paper or with a demo account to build experience and confidence.
3 Best Technical Indicators for Swing Trading Crypto
Technical indicators are mathematical tools applied to price and volume data that can help signal where the price might go next. Here are three of the most popular indicators for swing trading:
1.Moving Averages (MA)
Moving averages are essential technical indicators that calculate the average price of an asset over a specific period. Common types for swing traders include the 50-day, 100-day, and 200-day averages. They help smooth out short-term volatility and indicate price trends.
How moving averages help in swing trading:
-
They smooth out short-term volatility and show the underlying price trend. If Bitcoin’s price is above a particular moving average and the MA line is sloping upwards, the trend is bullish (uptrend); if below and sloping down, bearish (downtrend).
-
Crossover Signals: A shorter-term MA crossing a longer-term MA signals potential swings. A “death cross” (50-day MA crossing below 200-day MA) indicates bearish trends, while a “golden cross” suggests bullish trends.
-
Dynamic Support/Resistance: MAs can act as support or resistance levels. In an uptrend, prices may bounce off MAs, while in a downtrend, MAs can cap price swings.
Overall, moving averages give a clear visual of trend direction and can alert traders to trend reversals or continuations, which is exactly what a swing trader wants to know.
2.Relative Strength Index (RSI)
The RSI is a momentum oscillator that ranges from 0 to 100, traditionally calculated over a 14-day period.
Key points about RSI for swing trading:
-
Overbought/Oversold levels: RSI above 70 signals overbought conditions (potential downturn), and below 30 indicates oversold (potential upswing). For instance, an RSI of 75+ might suggest profit-taking is wise.
-
Divergence: Bullish divergence occurs when prices drop but RSI rises, suggesting weakening selling pressure, prompting traders to consider long positions.
-
Momentum: RSI helps assess price movement strength. During an uptrend, RSI typically holds between 40-80. Strong RSI during dips indicates sustained bullish momentum.
In summary, RSI helps swing traders judge if a market move might be exhausted (overbought/oversold), and thus ripe for a swing in the opposite direction, as well as the strength of the ongoing momentum.
3.Volume and On-Balance Volume (OBV)
Volume indicators are essential for swing trading, as they often signal upcoming price movements. One key indicator is On-Balance Volume (OBV), which tracks cumulative trading volume by adding volume on up days and subtracting it on down days. A rising OBV while price is flat may indicate accumulation (suggesting a bullish swing), whereas a flat or declining OBV during a price rally may warn of weakness.
Other volume concepts for swing trading:
-
Volume Spikes: A sudden increase in volume often accompanies breakouts, confirming bullish swings.
-
Volume Divergence: In healthy uptrends, volume should increase on up days and decrease on down days. A shift towards lower volume during rallies may suggest an ending swing.
-
Volume Profile: This helps identify price levels where significant trading occurred, potentially serving as support or resistance.
In crypto, where large holders can sway prices, volume analysis is critical. OBV filters out daily noise and can highlight trends despite fluctuations.
Combining indicators can be effective. For instance, if Bitcoin pulls back to its 50-day moving average with an RSI near 35 (oversold), and OBV flattens after a decline, this confluence with positive news or a bullish candlestick can signal a potential upward swing.
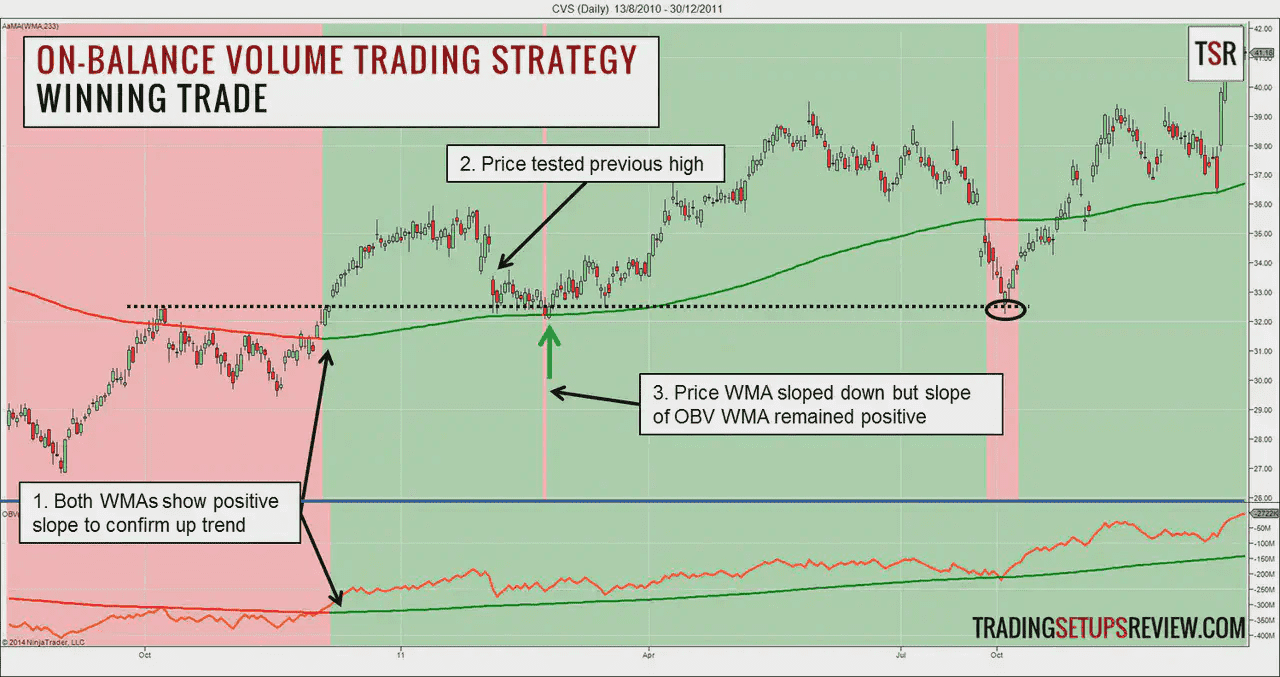
On-Balance Volume (source)
4 Popular Swing Trading Strategies
1.Breakout Strategy
2.Breakdown (Downside Breakout) Strategy
3.Retracement (Pullback) Strategy
A retracement strategy involves trading during temporary counter-trend moves within a larger trend. In an uptrend, for instance, after Bitcoin rallies from $30k to $50k, a trader may wait for a pullback to $45k to enter the market before the price continues to $60k. Tools like Fibonacci retracement levels and the RSI can help identify potential pullback zones. Always implement stop-losses to manage risk.
In a downtrend, traders can look for short opportunities after a relief bounce, such as buying Bitcoin at $50k after it fell from $60k to $45k. If indicators suggest the bounce is weakening, it may be a good point to short.
Key to retracement trading is maintaining confidence in the dominant trend while managing risk. This strategy allows traders to enter at better prices rather than chasing breakouts.
4.Reversal Trading Strategy
Reversal trading aims to catch a shift in trend direction. Traders look for exhaustion patterns, such as higher highs followed by lower highs, indicating a potential trend reversal. Classic patterns like double tops or head and shoulders can confirm this.
Indicator confirmations, such as moving average crossovers, provide additional support for identifying reversals. Significant fundamental changes, like regulatory news, can also signal a shift in trends.
Patience is crucial in reversal trading; waiting for confirmation helps avoid premature losses. While reversal and breakout trading may overlap, the focus differs: reversal traders seek to identify the end of one trend and the beginning of another, whereas breakout traders look for price levels to be broken, regardless of the trend context.
Mastering these strategies allows swing traders to navigate various market conditions effectively.
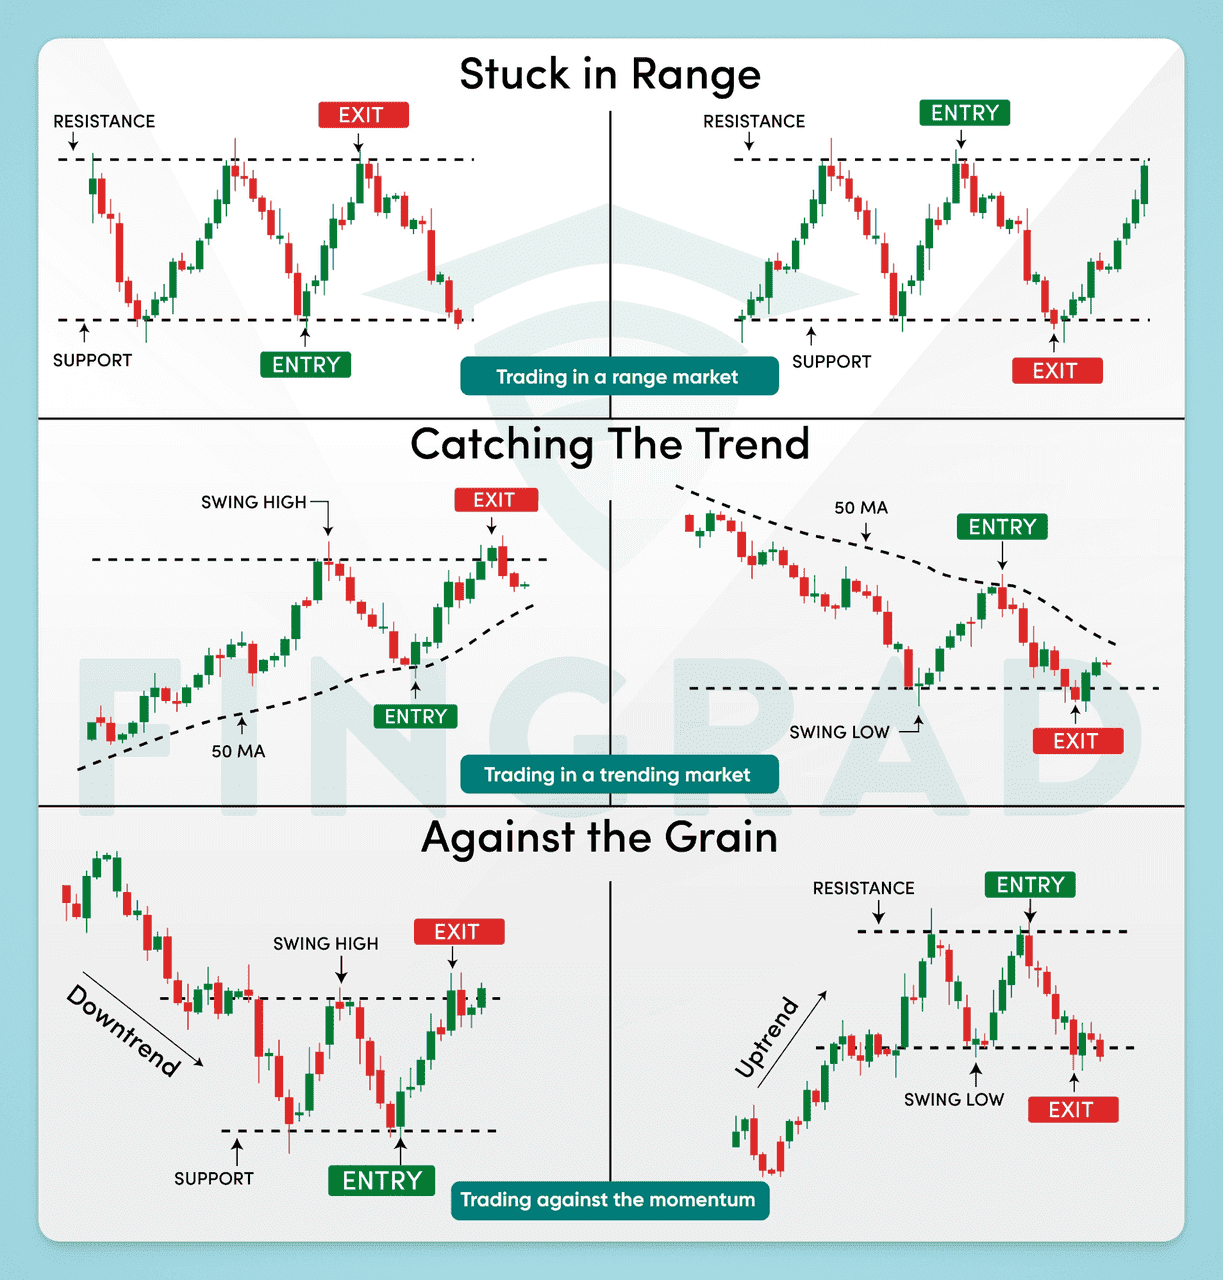
Swing Trading Strategies (source)
Advantages and Disadvantages of Swing Trading
Swing trading offers its own pros and cons, making it essential to assess if this style aligns with your goals and personality.
Advantages:
-
Lower Time Commitment: Swing trading doesn’t require constant monitoring, allowing you to maintain other commitments and step away after placing trades with stop-loss and take-profit orders.
-
Less Stressful (for many): With fewer trades and decisions compared to day trading, swing trading is often less overwhelming. It allows for strategic deliberation, reducing anxiety over small price fluctuations.
-
Potential for High Returns on Swings: The volatility of crypto markets enables significant profits from well-timed swing trades, often capturing larger moves over weeks rather than days.
-
Lower Transaction Costs: Trading less frequently leads to fewer fees, benefiting swing traders in the long run compared to the high costs associated with frequent day trading.
-
Flexibility in Tools: You'll find that basic tools and manual trading suffice for success in swing trading, without requiring advanced algorithms or infrastructure.
Disadvantages:
-
Overnight and Weekend Risk: Holding positions outside of trading hours exposes you to unexpected market moves, which can result in significant losses.
-
Patience and Discipline Required: Waiting days for trades to develop can be psychologically challenging, especially for those who crave constant action.
-
Possible Missed Opportunities: Swing traders may lose out on short-lived price movements, as they focus on longer-term trends rather than rapid fluctuations.
-
Exposure to Market Changes: Longer trade durations increase vulnerability to unforeseen events that can alter market conditions.
-
Requires Knowledge: Successful swing trading necessitates a mix of fundamental and technical skills, requiring ongoing effort to stay informed and proficient.
In summary, swing trading strikes a balance between day trading and passive investing, offering flexibility and attractive rewards while still necessitating a solid strategy and emotional control.
Who Can Become a Successful Swing Trader?
Swing trading can be a great option for anyone willing to learn, especially those with other commitments like a full-time job. It allows for analyzing and executing trades during spare time. Key qualities for successful swing traders include:
-
Patience and Discipline: Traders must be patient enough to wait for clear setups and disciplined in following their trading plans without making impulsive decisions.
-
Analytical Skills: Enjoyment in analyzing charts and researching news is crucial, as swing trading involves both fundamental and technical analysis.
-
Risk Management: Successful traders are aware of and manage risks effectively. Planning exits and setting stop-loss levels helps control potential losses.
-
Interest in Crypto: A genuine enthusiasm for the crypto market, including staying updated on trends and news, enhances swing trading prospects.
Starting with smaller capital is possible, allowing for practice and gradual growth in trading confidence.
By 2025, the crypto market is still volatile, presenting numerous swing opportunities. Traders who monitor macroeconomic and crypto-specific events can succeed. While losses are inevitable, learning continuously can improve your strategy. With the right tools, disciplined approach, and market knowledge, swing trading cryptocurrencies can be rewarding. Happy trading!