

In trading, a reversal refers to the change in the direction of an asset’s price. The trend reversal trading strategy is used by both day traders and long-term investors to determine when to enter or exit a market. Traders trade reversals by analyzing price actions using trendlines and trading channels. They use technical indicators, such as moving average (MA) and moving average convergence divergence (MACD) to help them isolate and spot reversals. Crypto markets are highly volatile, making trend reversals both more frequent and potentially more profitable – if you can identify them correctly. In this guide, we’ll explain what trend reversals are, how to recognize them using price action and technical indicators, and how to trade reversals while managing the risks. We’ll also update the discussion with insights up to 2025, including popular reversal patterns and the latest best practices for confirmation.
What Is a Trend Reversal?
In a financial market, a trend is the general direction of the market or an asset’s price. Trends occur in all markets and can be universally traded in stocks, futures, cryptocurrencies, and beyond. Traders identify trends through price action and technical indicators. They use trendlines to determine the direction of the trend and utilize indicators to judge the strength of the trend. There are three types of trends:
-
An uptrend is characterized by an overall increase in an asset’s price. In an uptrend, the price action is bullish and makes higher highs and higher lows. This means that an asset is in demand, and provides traders an opportunity to profit from the increasing prices. Traders usually sell an asset before the uptrend breaks, and the price action fails to make successive higher highs and higher lows.
-
A downtrend is characterized by the overall decrease in an asset’s price. During a downtrend, the price action is bearish and makes lower highs and lower lows. This normally means that the supply has exceeded the demand, and the market’s participants, as a majority, decided that the asset’s price should not be as high as it is.
-
A horizontal trend or sideways trend refers to an asset’s price hovering within a range of values. This commonly indicates that the supply and demand are balanced. When an asset’s price breaks the horizontal trend, it often signifies the beginning of a new and strong trend.
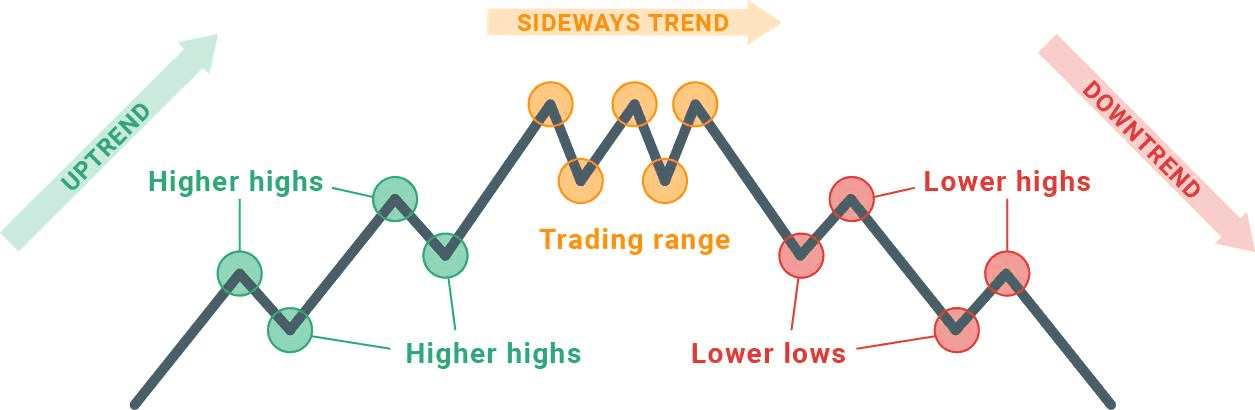
The uptrend, sideways trend, and downtrend. (Source: xtb.com)
When and Why Do Trends Reverse?
Trends can reverse for various reasons, influenced by technical factors and market psychology. An uptrend may lose momentum as buying interest fades, often indicated by overbought signals, allowing sellers to take control. Conversely, a downtrend can reverse when prices become attractive to buyers or oversold. Key support and resistance levels are crucial: an uptrend facing strong resistance may trigger a downward reversal, while maintaining a major support level in a downtrend can spark a bullish reversal.
Market psychology also drives reversals. In an uptrend, profit-taking by early investors may outweigh new buying, causing a peak, while in a downtrend, prices can drop to a bargain level, enticing new buyers. External news events, such as earnings reports or regulatory changes, often trigger reversals. For instance, news of crypto exchange failures shifted market sentiment from bullish to bearish, while later developments like institutional adoption renewed bullish trends. Traders typically look for multiple signals to identify potential reversals, employing price action patterns and technical indicators.
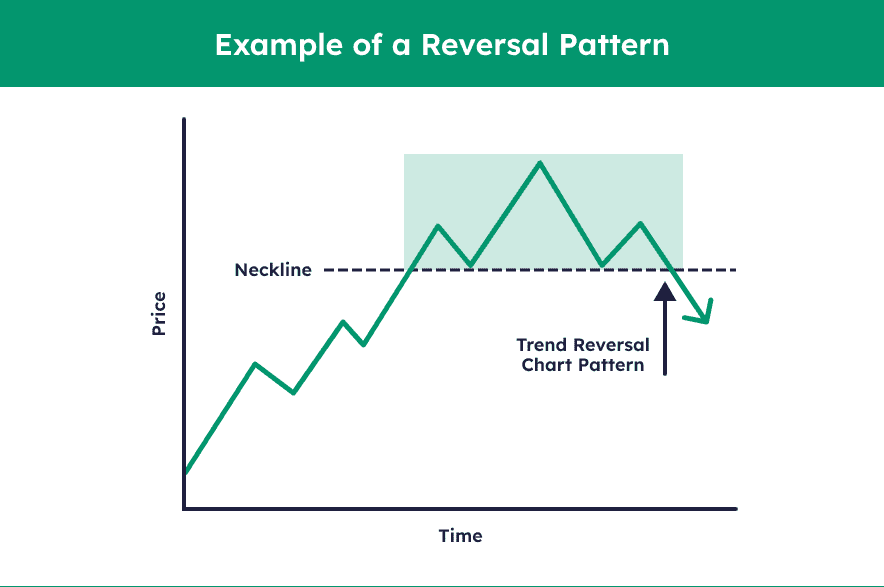
Reversal Pattern Example (source)
How to Identify a Trend Reversal Based on Price Action?
Trend reversal identified using trendlines
Trendlines are lines drawn over consecutive highs or lows to show the overall direction of an asset’s price. They represent a trend’s support and resistance in any time span. To create a trendline, traders link together at least two points on an asset’s price chart. In an uptrend, a trendline acts as a support and connects the higher lows. In a downtrend, a trendline act as the resistance line and connects the lower highs. The time frame on the price chart is configurable. For day trading, some traders use one-minute or five-minute charts. Long-term investors may opt to use longer time frames in the hourly, daily, or weekly charts.
In the example below, the trendline connects the series of higher lows, indicating a bullish uptrend. The green bullish trendline continues upward until a point (designated by a blue arrow) where the trend starts to break and dips below the trendline. The trend then reverses, and the price falls in a downtrend.
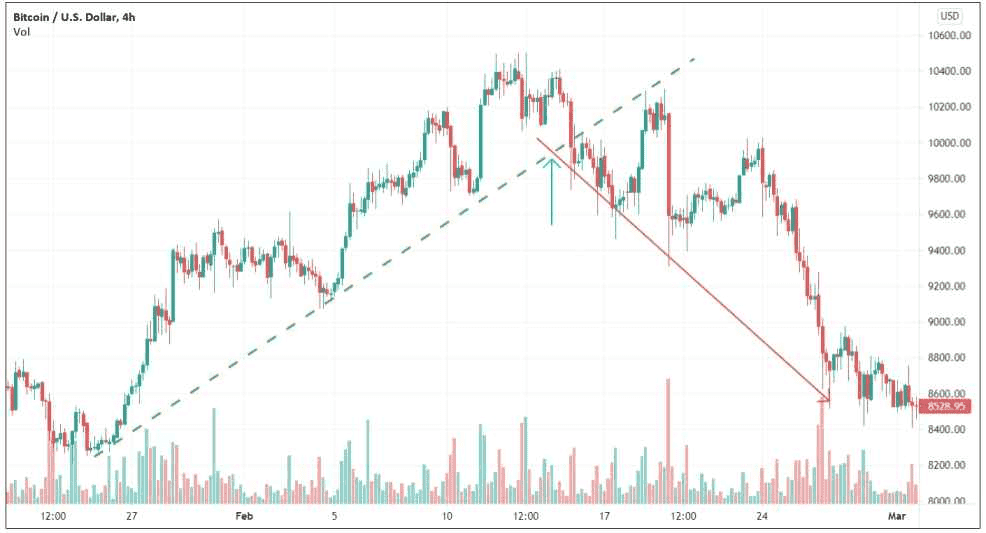
Trend reversal identified using trendlines from a Bitcoin price chart from January 21 to March 1, 2020, 4h time frame (Source: TradingView)
The longer a trendline, the more valid it is. A long trendline means there is a higher possibility that the lows will turn upward when their troughs reach the line. However, a longer trendline may also mean that it is too late to enter the market, since there is a high chance that the trend will change its course. Also, a break in the trendline does not necessarily mean a reversal is coming — it may be a false break. For that reason, it is important to analyze the trendline break’s magnitude and the market context before entering or exiting a market.
Trend reversal identified using trading channels
A trading channel (or price channel) refers to a trading range between the support and resistance lines. It is formed by a trendline and a channel line drawn in parallel at the support and resistance levels. Traders first draw the trendline to determine the trend type. They then draw the channel line in parallel to the trendline. The channel line connects higher highs as the resistance line during an uptrend or lower lows as the support line during a downtrend.
A trading channel helps traders by graphically depicting the highs and lows of an asset’s price over a period of time. Investors often use trading channels to identify breakouts, which is when an asset’s price breaches the upper or lower channel line. To determine a trading channel, traders must identify at least four points where the price signal touches (or almost touches) the parallel lines — two for the upper and two for the lower. A trading channel is valid when it has almost symmetrical oscillating movements and nearly parallel upper and lower channel lines.
There are three types of trading channels:
-
Flat or sideways channels indicate sideways movement in the market.
-
Ascending channels have two parallel lines with positive gradients, and signify an upward and bullish trend. For an ascending channel, the trendline is the lower line, while the channel line is the upper one.
-
Descending channels have two negative sloping parallel lines and suggest a downward and bearish trend. In a descending channel, the upper line is the trendline, and the lower line is the channel line.
The example below shows a descending channel within the two blue lines. To identify a trend reversal here, a trader would analyze the price chart to determine where the price breaches below the channel line. In the figure, the price action bounces between the lines in an almost oscillating way before the asset’s price overshoots the bottom line at the red arrow. An overshoot signifies a trend reversal where the initial bearish downward trend turns into a bullish upward trend.
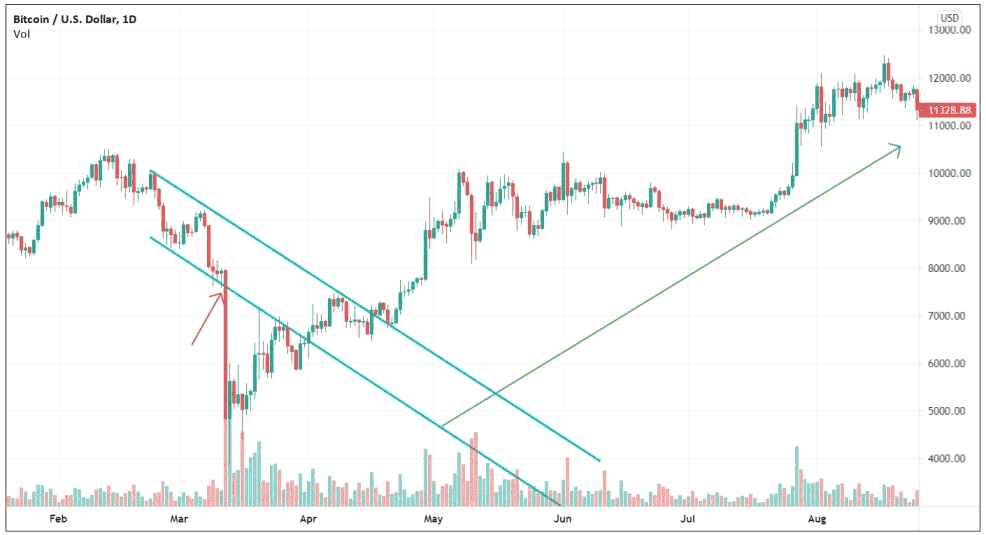
Trend reversal identified using a descending trading channel from a Bitcoin price chart from January 19 to August 24, 2020, 1-day time frame (Source: TradingView)
What Indicators Can Help Identify Trend Reversals?
Moving Average
A moving average (MA) calculates an asset’s average price across a set period of time. It is a simple tool that traders use to smooth out short-term price fluctuations and determine the general direction of a trend. For example, a 5-day moving average simply means the five-day sum of the asset’s prices divided by five. The longer the time frame, the greater the lag between the actual price action and the indicator. Short moving averages are sensitive to change, while longer moving averages require a larger price movement to change their movements. Traders can freely configure the time frames for moving averages and customize them according to their trading strategy.
The price is in an uptrend if the MA is moving upwards, in a downtrend if the MA is moving downwards, and hovering within a range if the MA is moving horizontally. A trend is confirmed with a crossover, in which a shorter MA crosses above or below a one. If it crosses above, it’s a bullish crossover. If it crosses below, it’s a bearish crossover.
In the example below, there are three moving averages of 15-day, 35-day, and 100-day time frames. On August 4, 2019, the bullish uptrend is confirmed when the 15-day moving average crosses over the other two longer moving averages. After ten days, the trend reverses into a bearish downtrend where the 100-day moving average crosses over the two shorter moving averages.
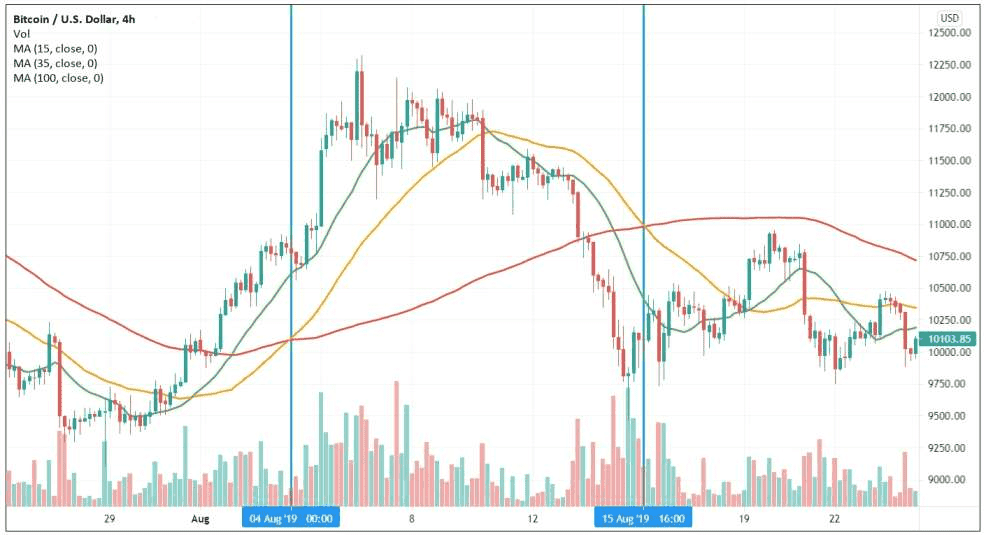
Trend reversal identified using moving averages from a Bitcoin price chart from July 25to August 24, 2019, 4h time frame (Source: TradingView)
Moving Average Convergence Divergence (MACD)
The MACD is an indicator that shows the relationship between two moving averages of an asset’s price over different time frames. In a horizontal trend, the two moving averages will converge. During a strong uptrend or downtrend, the two moving averages will diverge. Traders often use the MACD to find divergences, which are powerful trend reversal signals that occur when the price movements and the MACD indicator are out of sync.
Divergence happens when the price chart shows higher highs or lower lows, and the indicator signal makes lower highs and higher lows, respectively. The example below shows a divergence where the price makes lower lows while the MACD indicator produces higher lows. After the divergence, the initial bearish downtrend reverses as the asset’s price moves in an upward bullish trend.
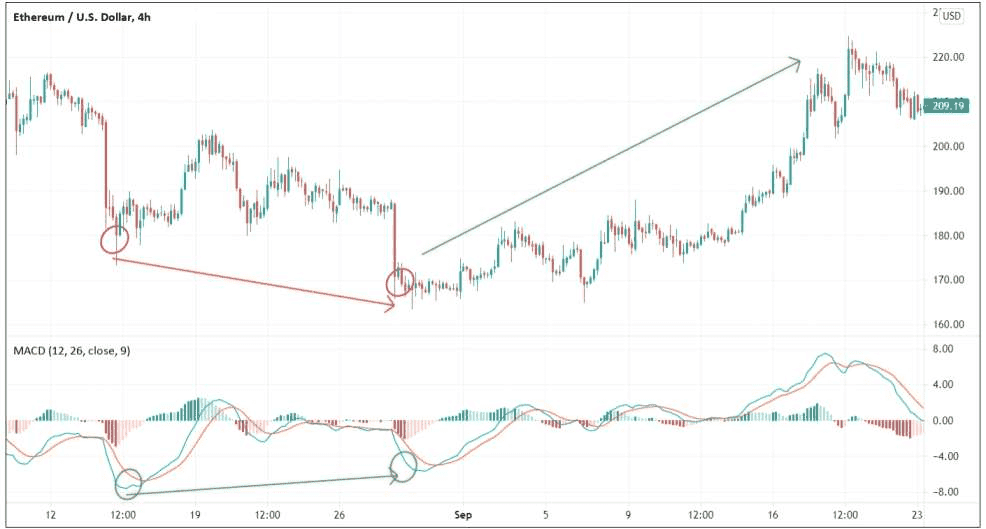
Using the MACD indicator to identify a trend reversal in an Ethereum (ETH) price chart from August 10 to September 23, 2019, 4h time frame (Source: TradingView)
Relative Strength Index (RSI)
The RSI (Relative Strength Index) is a momentum oscillator that measures price changes to determine if an asset is overbought or oversold, with values ranging from 0 to 100. An RSI above 70 signals overbought conditions, while below 30 indicates oversold conditions. Extreme RSI readings can suggest potential reversals; for instance, if Bitcoin’s RSI exceeds 80, it may indicate a pullback is due.
RSI divergences are crucial for identifying trend reversals. A bearish divergence occurs when price hits a higher high but RSI shows a lower high, signaling weakening momentum. Conversely, a bullish divergence happens when price makes a lower low while RSI makes a higher low.
Additionally, RSI can validate patterns: a bullish divergence may confirm a double bottom, while an RSI drop below 30 after breaking support reinforces a bearish trend. Traders often consider market context, waiting for RSI to exit extreme levels for proper confirmation. For instance, a rise above 40 after being below 30 can indicate a genuine upward reversal, and an RSI crossing above or below 50 can signify shifts in momentum.
Volume and Other Indicators
Apart from the big three indicators, trading volume is crucial for assessing the strength of price moves. A convincing trend reversal typically comes with a notable increase in volume, signaling strong interest among participants. For example, a breakout above resistance accompanied by high volume indicates strong buying interest, while a low-volume reversal may not hold.
Additional tools like oscillators (e.g., Stochastic) can highlight overbought/oversold conditions, and trend-strength indicators like ADX can signal a weakening trend. Bollinger Bands can also indicate potential reversals when price moves outside the bands and then returns.
It's essential to avoid relying on a single indicator. Traders often seek confluence—multiple signals indicating a reversal, such as price hitting a long-term resistance level, forming a head-and-shoulders pattern, and showing RSI divergence. When many indicators align, the likelihood of a successful reversal trade increases significantly.
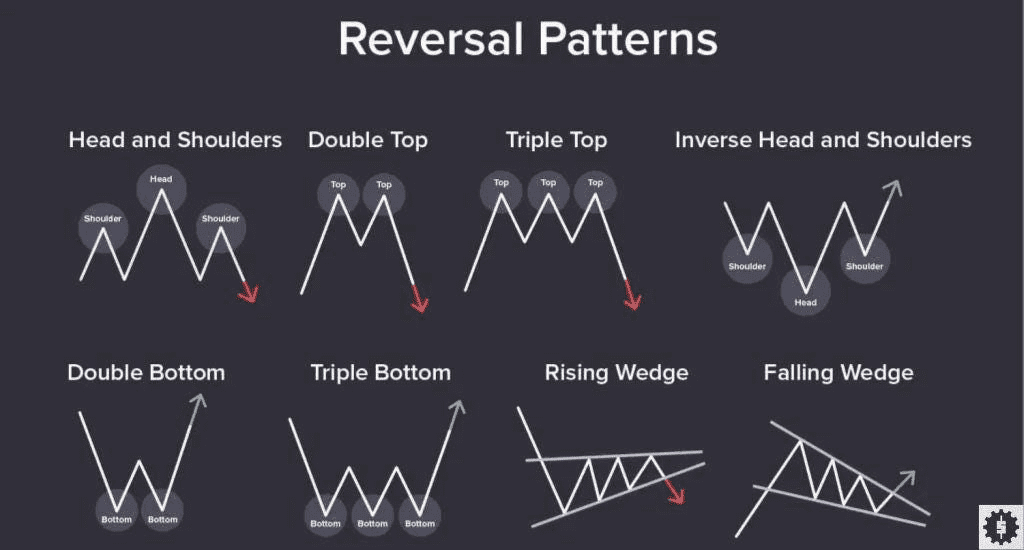
Reversal Patterns (source)
How to Trade Reversals - Strategies and Risk Management
Identifying a potential reversal is crucial, but executing the trade and managing risk is equally important. Reversal trading can yield significant profits, but it’s risky as it involves trading against the prior trend. Here are some effective guidelines:
-
Wait for Confirmation: Avoid jumping in at the first sign of a reversal. Wait for confirmation signals, such as multiple candlesticks closing beyond a trendline or a moving average crossover. This approach filters out false signals and increases success odds.
-
Set Stop-Losses Strategically: Always use stop-loss orders to limit risk. For bullish reversals, place stops just below recent lows; for bearish trades, set them just above recent highs. Allow some wiggle room without taking on excessive risk.
-
Profit Targets and Scaling: Consider scaling out of your position as the trend develops. Take partial profits at logical points, then let the rest ride with a trailing stop. For example, sell 50% after a significant bounce while holding the remainder for possible longer-term gains.
-
Mind the Overall Trend: Align trades with higher time-frame trends. A daily reversal is stronger than one on a smaller timeframe. Conduct multiple time frame analysis to identify higher probability trades.
-
Beware of False Reversals: Be cautious of fakeouts that test traders’ resolve. Use confirmation and stop-losses, and watch market context for signs of potential failures.
-
Incremental Position Building: Start with a small position at the initial signal and add more as the reversal gains traction to minimize losses if the signal proves false.
These strategies can enhance your reversal trading effectiveness while managing inherent risks.
Conclusion
Identifying and trading trend reversals can greatly improve your trading performance. By spotting when an uptrend or downtrend is ending, you can exit positions before losing profits and even switch strategies to profit from the new trend direction. Utilizing tools like trendlines, chart patterns, and technical indicators (MA, MACD, RSI) helps signal potential reversals, but no single method is infallible. The best traders combine multiple approaches and prioritize risk management.
Trading reversals comes with uncertainty, as not every apparent reversal will continue; trends can resume after a pause. Successful reversal trading requires discipline: waiting for confirmations, cutting losses quickly, and avoiding over-leveraging. New traders can practice identifying reversals on historical charts or use simulated trading environments, such as Phemex’s Testnet, to build confidence without risk.
In summary, recognizing trend reversals provides key opportunities. By understanding the signals that indicate these turning points, you can anticipate market changes rather than merely reacting. Always confirm signals, manage risk, and refine your skills to improve your ability to differentiate true reversals from noise, especially in the volatile crypto market of 2025.