


Summary:
- As one of the easiest & most basic tools in technical analysis, trendlines define the chart trend. The purpose of trendlines is to connect multiple data points to confirm our trading bias.
- The two types of trendlines in technical analysis are ascending and descending; and these only indicate bullish or bearish trends.
- For effective trading, use the trendlines in conjunction with indicators such as the RSI, MACD, Volume, or a channel trend line indicator such as Bollinger Bands.

Have you looked at professional trading charts and found the lines intimidating? If you’re just starting your trading journey, understanding these lines is essential. These are called “trend lines” and are commonly seen across most stock or crypto trading charts.
This guide will cover what is a trendline and how you can use it for trading Bitcoin (BTC) and other crypto.
What Are Trendlines?
Trendlines are lines that connect lower and higher positions or vice versa – from point A to point B. Trend lines are not the same as a trading indicator but are the lines drawn by traders themselves on their trading charts. Trendlines are the simplest lines on the chart, and anyone can draw them.
Trendlines indicate the direction of the price trend. If we’re in an uptrend or bullish trend, the lines will point upward. Likewise, in a downtrend, the line will point downward and indicate bearish momentum.
Going beyond the obvious, there are two types of trendlines: ascending and descending.
Types of Trendlines in Technical Analysis
In an ascending trendline, the price is going up and we connect multiple resistance points that a stock or crypto like Bitcoin has broken through. This indicates the price will keep appreciating and we can open a long trade.
In a descending trendline, the price is going down and support levels are broken. As Bitcoin keeps crashing, we connect the previous support levels and assume that the price will keep going down. This helps us open a short position.
Trendlines are designed for only one purpose: Confirming trade bias. If we’re about to place a trade, we need reassurance that the trend will go in the direction of our trade. Below, we’ve laid out instructions to help you draw trend lines on Phemex and understand how they work.
Notes:
- We use the “Trend Line” tool to draw trend lines and they are not to be confused with technical indicators such as the RSI indicator.
- While we could combine them, trend lines can be drawn in isolation without any indicator.
- Trendlines can be drawn for altcoins on any crypto chart. On websites such as TradingView, traders can draw professional charts and share them with other traders.
How Do Crypto Trend Lines Work?
There are certain rules that all properly-drawn trend lines must adhere to:
- The trendline must connect at least two points (A > B) or multiple points (A > B > C > D). Each one of these points represents one candlestick on the chart.
- The trendline must not cut through the candlesticks. If the trendline cuts through one candlestick, the trend can’t be clearly defined.
- Trendlines should only be drawn for closed candles. For example, if we draw on the 1D (daily) chart we should not draw a trend for the present day before the candle closes.
A trader could ignore these rules and draw their own trendlines that cut through the candles or draw over open candles. However, to draw professional charts and effectively point out support/resistance levels, remember these rules.
What Is An Ascending Trendline?
An ascending trendline indicates bullish momentum and price appreciation. It is one of the most important patterns for trendline analysis that can confirm a bullish trend for Bitcoin or an altcoin.
The line is drawn above two or more candles that accentuate the bullish trend. In an ascending trendline, point A is lower than point B, and point B is lower than point C. This indicates that the crypto has broken through multiple resistance levels and the price keeps appreciating:
Ascending trendline on the Bitcoin chart.
The ascending trendline in the example above indicates price appreciation from a low point of $41,000 to a high point of $66,000.
The trendline is properly drawn without cutting through any closed candles on the chart, connecting one high point to another. If we wanted to confirm trading bias for a long trade, this trendline would confirm it.
Optionally, we can extend the trendline to point C and connect it to the peak when Bitcoin reached $69,000. As seen, the price did not touch the trendline. This indicates that the trend was bullish, and Bitcoin peaked above the previous high; eventually, the line broke down.

What Is A Descending Trendline?
A descending trendline indicates negative price depreciation and a bearish trend. It is similar to the ascending trendline, but the trend goes in the opposite direction–down.
If we’re in a bearish trend and the crypto market is crashing, Bitcoin will test the previous bullish trendline and fall below it. This forms a new bearish trend and presents a short opportunity for traders.
Let’s say we want to confirm our trade bias that the price will keep depreciating. In this case, we can draw a trend line that shows Bitcoin is on the downfall:

Descending trendline on the Bitcoin chart.
In the descending line trend, we see a clear price breakdown over multiple months on the daily chart. Bitcoin crashed from a peak of $69,000 down to $18,000 at the lowest point, and had a small run prior to breaking down again. If we wanted to open a short trade with a target of $21,000, this descending trendline would confirm our trading bias.
How to Draw Trendlines on Charts?
Using the charting tools available on Phemex, traders can draw their own trendline charts. These tools are available on all Phemex charts such as BTC/USDT, ETH/USDT, SOL/USDT, and even futures charts.
For this demonstration, we’re going to select the most-traded Bitcoin pair. The demonstration works on desktop and mobile alike.
Open the BTC/USDT chart to get started and select the “Trend Line” tool highlighted on the left:
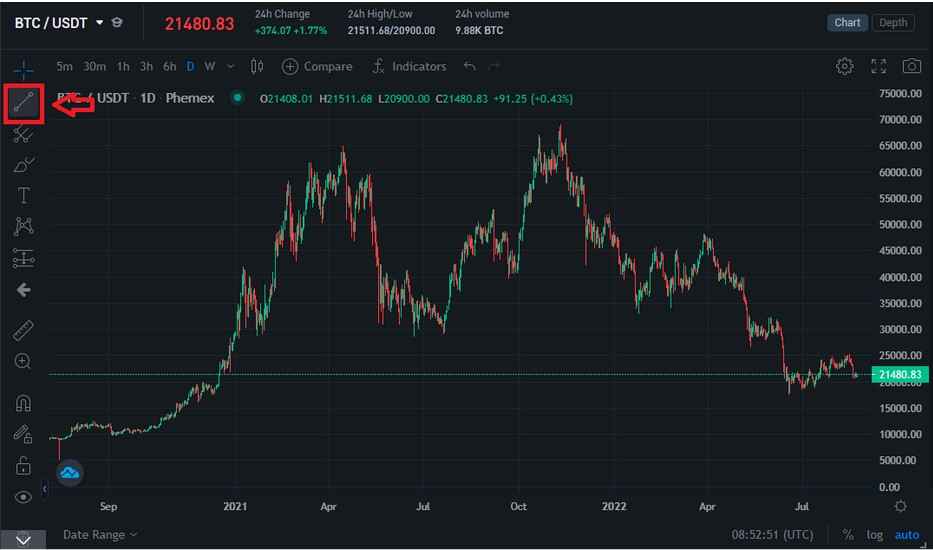
The “Trend Line” tool is located on the left on all Phemex charts.
Once you’ve selected it, you can left-click on any location on the chart and it will draw a line. For example, if we want to connect the Covid bottom of 2020 to start of the bull run in 2021, we can do this easily:

Pro Tip: Press “ESC” if you want to delete the line, or left-click on it if you want to connect it to a third point.
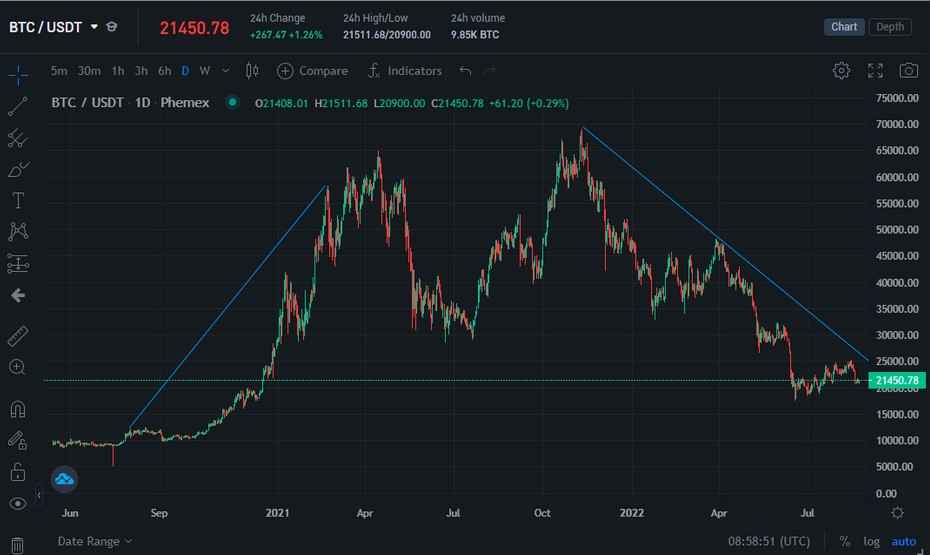
There’s also the option of drawing multiple crypto trend lines:
In this example, we’ve drawn two trendlines, one for the bullish and one for the bearish trend.
We now have two unique lines that we can combine with technical indicators for our trading strategy.
Additional Tips for Drawing Trendlines
Drawing trendlines is easy. However, there are other things that can affect the overall trend and you should never open a trade based on a trendline alone. Here are the most important things to keep in mind:
Trendlines vs. Support/Resistance Levels
The trendline will be tested because they don’t last forever. If we have an ascending trendline, the price could go below it and cause a trader in a long trade to lose money. Expect the trendline to be tested while you’re trading–on a long enough timeframe, the trend should hold over multiple months.
Likewise, in a descending trendline you never know when the trend could reverse. The volatility of the crypto market means trendlines will be broken all the time.
Volume Profile
The volume (amount of money being traded) affects the trendline. Always use the volume indicator and other technical indicators such as RSI that indicate overbought/oversold levels.
Most traders assume that if the volume drops, this is a bearish trend. However, if we analyze peak historic volume, the highest trading amounts occurred during the biggest crashes. Use multiple indicators and pay attention to the amounts being traded and how this correlates to price.

Scaling/Time
Trendlines should be drawn over closed candles for a reason. The most effective trendlines are drawn on a macro scale on the 1D (daily) or 1W (weekly) chart. If you widen the timeframes, you can ignore the noise between the bigger trends.
Zoom out of the chart and focus on a long term timeframe to get an accurate idea of where we’re at in the market. Market timing is an effective trading strategy that helps us buy the bottom and sell the top.
To learn more about indicators that can be combined with your trend lines, visit the Phemex technical analysis library.
Read More
- What Is Trend Trading: Following the Market When It Pays
- How to Read Crypto Charts: Learn Trading Chart Patterns
- Uptrends and Downtrends: How to Spot and Trade Them?
- How to use The Trend Reversal Trading Strategy: All you Need to know
- What is Zig Zag Indicator: Discover Trend Lines in Crypto
- What is The Point and Figure Chart (P&F) For Bitcoin: Historic Charting For The Modern Trader
- What is Advance Decline Line (AD Line): When Should You Buy Altcoins?
- What is Trend Strength Index (TSI): How To Measure Trend Strength of Bitcoin