Cryptocurrency markets are often influenced by strong trends driven by market sentiment. The Directional Movement Index (DMI) and its companion, the Average Directional Index (ADX), are powerful tools for assessing both trend direction and strength. Originally developed by J. Welles Wilder in 1978, the DMI helps traders determine the strength and direction of price trends by plotting two lines: the positive directional indicator (+DI) and the negative directional indicator (–DI). The ADX is the smoothed average of the difference between these two indicators and measures the strength of the trend.
In simpler terms, the DMI indicates whether an asset is moving upward or downward, while the ADX shows how strong that movement is. In the cryptocurrency market, where bull runs and crashes can occur quickly, utilizing the DMI and ADX can help distinguish genuine trends from random fluctuations.
Introduction
In the volatile world of cryptocurrency, it's essential to determine whether Bitcoin or any altcoin is genuinely trending upward or downward, rather than just fluctuating randomly. The Directional Movement Index (DMI) and the Average Directional Index (ADX) work together to provide clarity in this regard.
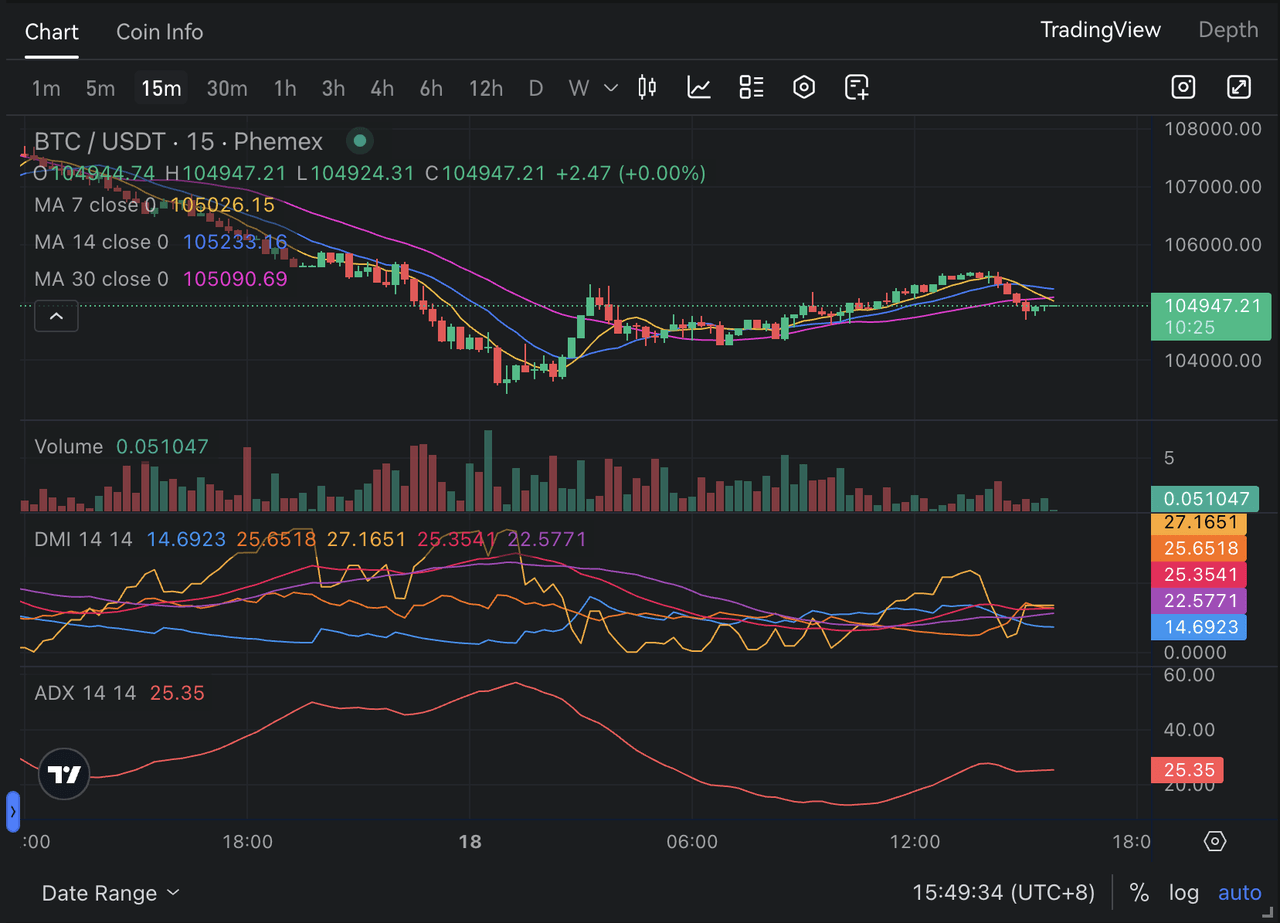
The DMI consists of two lines: the +DI line (often colored green) and the -DI line (often colored red). These lines measure the upward pressure versus the downward pressure on price. Meanwhile, the ADX line measures the overall momentum of the trend.
For example, when the +DI is above the -DI, it indicates that buyers have the advantage, suggesting that the trend is likely upward. A rising ADX above 25 signals a strong trend, while a falling ADX indicates potential trend exhaustion.
This combination allows crypto traders to gain a clearer understanding of market dynamics: the DMI shows who is prevailing (bulls or bears), and the ADX reveals the strength of their movement.
What Is DMI and ADX?
The Directional Movement Index (DMI) is a technical indicator consisting of two lines: +DI and -DI. It is designed to identify the direction of trends by comparing the highs and lows of successive periods. If today’s high minus yesterday’s high (+DM) is greater than yesterday’s low minus today’s low (-DM), the up-move is recorded; otherwise, the down-move is noted. These values are typically smoothed using a 14-period average to form the +DI and -DI lines.
The Average Directional Index (ADX) is derived from these lines and represents the strength of a trend, regardless of its direction. In practice, many charting tools calculate the DMI for you, allowing you to easily activate the +DI, -DI, and ADX lines on your crypto chart. When +DI is above -DI, the price trend indicates an upward movement; conversely, when -DI is above +DI, the trend is downward. A wider gap between +DI and -DI suggests a stronger trend. The ADX line, often plotted in black or blue, typically oscillates between 0 and 100. Higher ADX values indicate a stronger trend, with values above 25 generally considered to indicate a strong trend.
Psychology Behind DMI and ADX
The interaction between +DI, –DI, and ADX provides insight into market psychology. When +DI crosses above –DI, it indicates that buyers are aggressively pushing prices higher, reflecting a bullish sentiment. Traders often interpret this crossover as a signal that “buyers are in control,” leading them to feel confident about going long. Conversely, when –DI surpasses +DI, it shows that sellers dominate the market, resulting in a bearish sentiment.
The ADX line measures the strength of this sentiment. An increasing ADX indicates that market participants are becoming more active in the trend—whether through eager buying or anxious selling—thereby enhancing momentum. Specifically, a rising ADX during a bullish phase suggests that traders are investing more capital into the rally. In contrast, a rising ADX during a downtrend signifies panic selling or significant profit-taking.
Psychologically, this also serves as a “confirmation filter.” For instance, while a crossover between +DI and –DI may suggest the beginning of a new trend, low ADX values may lead traders to hesitate since the momentum isn't convincing yet. Conversely, an ADX spike above 25 or 30 can instill confidence that the current movement is genuine. In summary, the DMI/ADX system helps transform emotional responses such as fear or greed leading to buying or selling pressure into objective signals. It reveals not only who is winning in the market but also the decisiveness of their victory, which can aid in avoiding premature trades during false movements.
How to Identify DMI and ADX on Charts
On a cryptocurrency price chart, the Directional Movement Index (DMI) is represented by two lines (often green and red) labeled +DI (or +DI) and -DI. The Average Directional Index (ADX) line, usually black or blue, often appears separately below the DMI lines. Most trading platforms use a default setting of 14 periods for both DMI and ADX, which works well for many traders. To interpret these lines, consider the following signals:
-
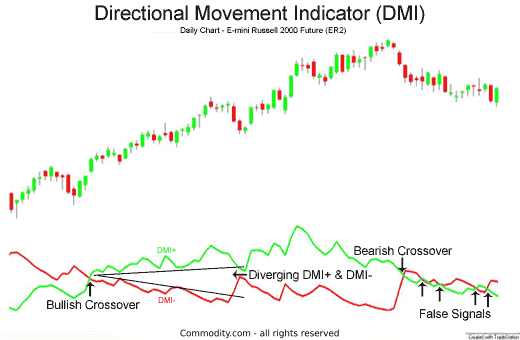
Bullish Signal (+DI > –DI): If the +DI line (indicating buyers) crosses above the -DI line (indicating sellers) and stays above it, this indicates an uptrend. The larger the gap between +DI and -DI, the stronger the uptrend.
-
Bearish Signal (–DI > +DI): If -DI crosses above +DI, it suggests that sellers are currently stronger, indicating a likely downtrend. A wider gap between the two lines signals a stronger downtrend.
-
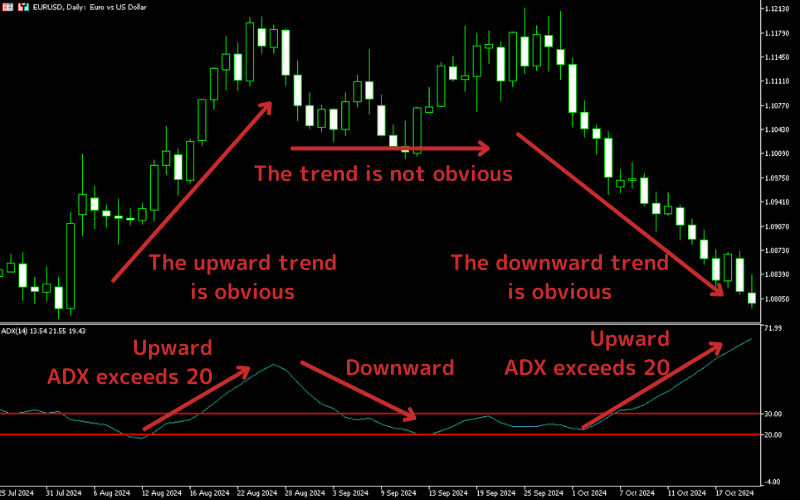
ADX Strength: The ADX line indicates the strength of the trend. When the ADX is above 25, the current uptrend or downtrend is considered strong. Conversely, if the ADX is low (below 20-25), it suggests the market is either range-bound or weakly trending.
-
Crossovers: A classic trading signal occurs when +DI crosses above -DI while the ADX is concurrently high. This alignment often signals a true breakout. For instance, an ADX spike above 25 following a +DI/-DI crossover confirms a robust trend.
In practice, if you observe +DI rising and exceeding -DI while the ADX line also turns upward (especially if it surpasses 25), this is typically indicative of a strong uptrend. Although some traders may monitor +DI and -DI crossovers alone, the best signals arise when the ADX validates these movements. The ADX line often increases when an asset breaks out of a consolidation phase; if the ADX rises from below 20 to above 25, it often indicates that a new trend has begun.
How to Trade With DMI and ADX
Using DMI/ADX in trading strategies can be quite straightforward:
-
Trend Following Entries: A popular strategy is to go long when the +DI crosses above the –DI line and the ADX is rising (preferably above 25). This double confirmation indicates that buyers are gaining control and the trend is strengthening. Conversely, consider going short (or exiting long positions) when the –DI crosses above the +DI, with the ADX confirming this move.
-
Breakout Confirmation: After a price breakout (e.g., through resistance), traders should check the ADX. If the ADX rises from below 20 to above 25 during the breakout, it signals that momentum is supporting the breakout. However, if the ADX remains low, the breakout may fail.
-
Trailing Stops: As the trend unfolds, the ADX can be used as a trailing mechanism. If the ADX was rising and then starts to fall sharply, it may indicate that trend momentum is fading, prompting traders to tighten their stops or take profits.
-
Scale-In Strategy: Aggressive traders might add to their positions as the ADX climbs, as this suggests the trend is accelerating. For instance, if Bitcoin’s +DI is above the –DI line and the ADX spikes from 30 to 50, it indicates surging demand, which may be a cue to increase a long position.
-
Avoiding False Signals: DMI crossovers can produce false alarms in choppy markets. By waiting for the ADX to validate the move, traders can filter out many fakeouts. For example, +DI might briefly cross above the –DI due to a momentary spike in price; however, if the ADX is still below 20, it may be wise to skip that trade until a stronger trend forms.
In summary, a typical trading trigger is when “+DI crosses above –DI with ADX above 25” for a long entry (and the opposite for a short entry). This rule suggests that you’re betting with the trend rather than against it. Experienced traders also use DMI/ADX to confirm signals from other indicators. For example, if an RSI oversold signal coincides with a bullish +DI/–DI crossover and a rising ADX, it provides extra confidence. Ultimately, DMI/ADX excels in trending phases: it tells you when a trend is strong and when to invest in it or let winning trades run.
When Not to Use DMI/ADX (Limitations)
While the DMI/ADX indicator is powerful, it has its limitations. Most notably, it is a lagging indicator: all lines are based on smoothed past prices, meaning that signals often appear after a move has already begun. In highly volatile or sideways markets, DMI/ADX can fluctuate without providing useful signals. For instance, during periods of consolidation, the +DI and –DI lines may crisscross frequently without the price moving significantly, and the ADX may remain low. This can lead to false signals or late entries. Traders are often cautioned that in "rangebound or triangle patterns," MACD (and by extension, DMI) can generate numerous false signals. The same applies here: if Bitcoin is simply oscillating, DMI/ADX will produce confusing data.
Another limitation lies in interpretation: while ADX shows the strength of a trend, it does not indicate direction. A very high ADX suggests that a strong trend is underway, but it is essential to check the relationship between +DI and –DI to determine whether the trend is upward or downward. The periods used for calculation also matter; the default 14-day setting may lag in fast-moving crypto markets, prompting some traders to use shorter periods (like 10 days) for quicker signals, albeit at the expense of increased noise.
Finally, like any indicator, DMI/ADX should not be used in isolation. It is best utilized as a tool to filter trades rather than dictate every trading decision. For example, taking every +DI/–DI crossover as a trade can be risky; prudent traders combine it with trend analysis and potentially other indicators (e.g., confirming an uptrend on a higher time frame). Keep in mind that an ADX reading above 25 indicates a trend is present, but it does not guarantee that every entry will be successful—it merely improves the odds by confirming momentum.
Bonus Tips and Historical Notes
-
Historical Origin: The DMI/ADX system was introduced by J. Welles Wilder in his 1978 work, which also introduced the RSI and Parabolic SAR. It has since become a fundamental tool in technical analysis and is available on virtually all trading platforms.
-
Trend Filtering: A helpful strategy is to trade DI crossovers only when the ADX is above a certain threshold, such as 25. This approach allows traders to align their trades with established trends rather than just anticipating them. Some traders prefer to wait until the ADX rises back above 20 after a dip, as recommended by Wilder.
-
Volatility Adjustment: Cryptocurrencies are generally more volatile than stocks or forex. As a result, some traders opt to shorten the DMI period (using 10 instead of 14) to make the indicator more responsive. This adjustment can help capture moves earlier, but it might also lead to more whipsaw signals. Experimenting with the parameters on your preferred crypto asset is a wise practice.
-
Use with Risk Management: When the DMI/ADX indicates a strong trend (with ADX significantly above 25), many traders set wider profit targets or utilize trailing stops. Conversely, if the trend is weak (with ADX below 20), they might decide against taking large positions altogether. This system is an effective tool for managing position sizes and stop-loss placements.
-
Confirm with Volume: Since the ADX is solely based on price, some traders look for volume spikes or Cumulative Volume Delta (CVD) as additional confirmation that a trend has sufficient buying power. Observing the ADX rise alongside increasing volume provides greater confidence that trend-following signals are likely to hold.
In summary, the DMI/ADX system serves as a compass for trend strength. It indicates when to trade (during a strong trend), the direction to trade (based on DI crossovers), and when to be cautious in weak market conditions. Crypto traders who heed its signals—particularly aligning +DI/-DI crossovers with an ADX above 25—often find themselves positioned advantageously during significant market movements.
Conclusion and Phemex CTA
DMI and ADX are deceptively simple yet powerful indicators for crypto traders. By showing which side (bulls or bears) has the momentum and how much strength that momentum carries, they help turn market “noise” into actionable insights. Remember to look for +DI/–DI crossovers confirmed by a rising ADX as your cue to trade, and be wary in flat markets where signals are murky. Used wisely, DMI/ADX can give you an edge in capturing major crypto trends – just as it has helped traders in stocks, forex, and futures for decades.
Ready to put DMI/ADX to work? Log in to Phemex and apply the DMI/ADX indicator on your favorite crypto charts. Test your trend strategies with low fees, try them in demo mode if you wish, and power up your portfolio. And don’t forget to check out Phemex Earn programs to make the most of market momentum. Trade smart and stay informed!
Disclaimer
The content of this article is for informational and educational purposes only and should not be construed as financial, investment, or legal advice. Cryptocurrency and tokenized asset investments carry significant risk, and past performance is not indicative of future results. Always conduct your own research or consult a qualified financial advisor before making investment decisions.
The content of this article is for informational and educational purposes only and should not be construed as financial, investment, or legal advice. Cryptocurrency and tokenized asset investments carry significant risk, and past performance is not indicative of future results. Always conduct your own research or consult a qualified financial advisor before making investment decisions.


