

Key Takeaways
Core Definition: Developed by George Lane, the stochastic oscillator is a leading momentum indicator that measures an asset's closing price relative to its price range over a specific period (usually 14 periods).
Leading Nature: The indicator is based on the principle that momentum changes direction before price, allowing traders to anticipate potential trend reversals before they occur on a price chart.
Overbought vs. Oversold: Readings are bounded between 0 and 100. Generally, a reading above 80 is considered "overbought" (momentum may be due for a pullback), while a reading below 20 is considered "oversold" (momentum may be poised to bounce).
Crossover Signals: A primary trading signal occurs when the two lines interact. A %K cross above %D (especially below 20) is a bullish signal, while a %K cross below %D (especially above 80) is a bearish signal.

When analyzing crypto price charts, traders often look for tools that can signal momentum shifts and potential trend reversals. The stochastic oscillator is one such popular technical indicator, used widely in stocks and forex and just as effectively in the crypto markets. If you’ve ever wondered about what the stochastic oscillator is and how to use it in crypto trading, this tutorial is for you. We’ll break down the formula and inner workings of stochastic, how to interpret its two lines (%K and %D), and provide practical examples of using it for Bitcoin and other cryptocurrencies. We’ll also compare stochastic with other indicators like RSI and MACD to see how it stands out and how they can complement each other.
By the end, you should have a solid understanding of the stochastic oscillator – from theory to practice – and be ready to incorporate this tool into your crypto trading strategy.
What is the Stochastic Oscillator?
The stochastic oscillator (often just called “stochastic”) is a momentum indicator that shows an asset’s closing price relative to its price range over a certain period. It was developed in the late 1950s by a group of traders including George Lane (who popularized it). The core idea behind stochastic is captured well by Lane’s observation: “Momentum always changes direction before price.” In other words, the indicator aims to signal shifts in buying or selling pressure that could precede actual price reversals.
Stochastic is plotted as two lines that oscillate between 0 and 100 on a sub-chart below your price chart. These lines move within three zones: typically, readings above 80 are considered the overbought zone, readings below 20 are the oversold zone, and the middle is a neutral zone. Overbought, in this context, suggests the price has moved near the top of its recent range and may be due for a cool-off or pullback; oversold suggests the price is near the bottom of its recent range and might be poised to bounce.
Importantly, “overbought” does not guarantee “immediate sell-off” – in strong uptrends, an oscillator can remain overbought for an extended period while price keeps rising. Similarly, oversold conditions can persist in a harsh downtrend. What the stochastic is really telling us is momentum: when it’s in extreme territory, it means the price closed consistently near the high (or low) of its look-back range for several periods, indicating strong directional momentum.
A key feature of stochastic is that it is considered a leading indicator. It doesn’t follow price so much as oscillate based on price’s position in a range, thus it can sometimes give turning signals slightly before the price actually turns (hence it can “lead” the price). Traders use these signals to anticipate future market shifts – for example, a downturn in the stochastic from above 80 might hint that bullish momentum is waning even if the price hasn’t started dropping yet.
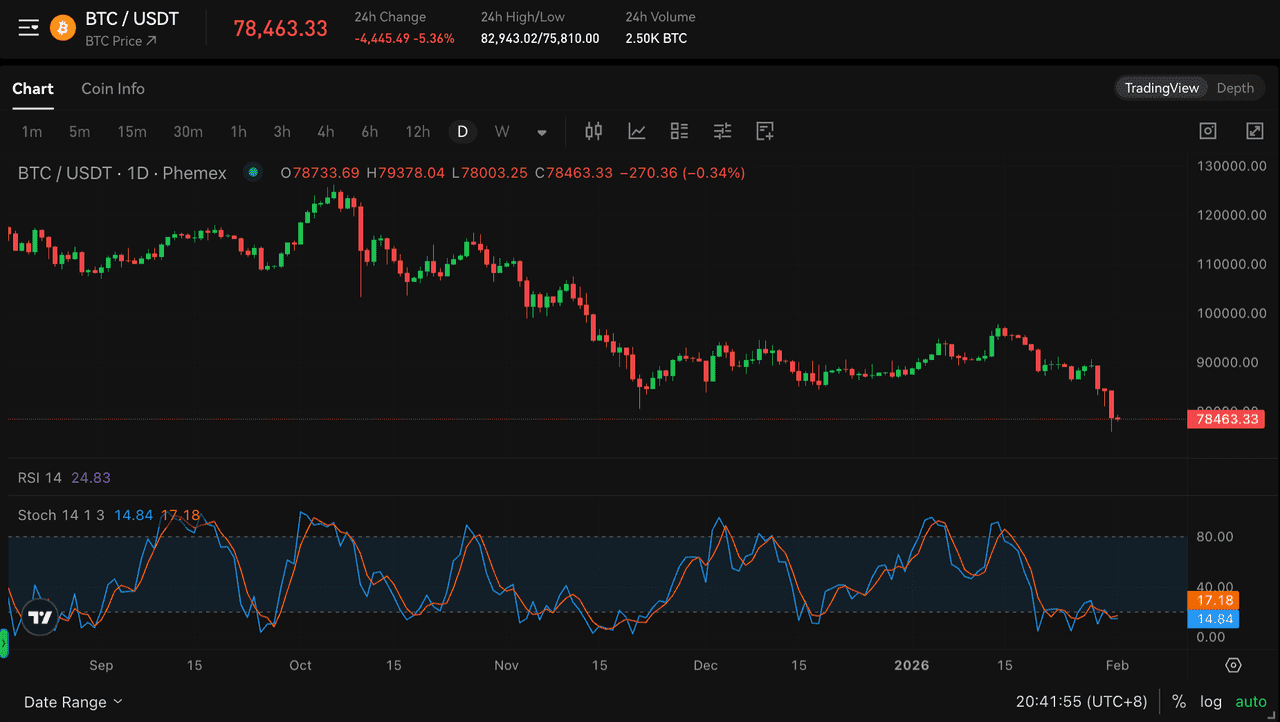
Stochastic Indicator for BTC/USDT on Phemex (source)
The %K and %D Lines Explained
The stochastic oscillator is composed of two lines:
%K line: The main, fast oscillator line which reflects the current value of the oscillator for each period.
%D line: A smoothed (usually a 3-period simple moving average) version of %K, which acts as a signal line.
Think of %K as the raw measure and %D as a moving average that lags %K slightly, to help filter out noise.
Stochastic Formula: The standard calculation for the stochastic oscillator (using a typical 14-period setting) is:
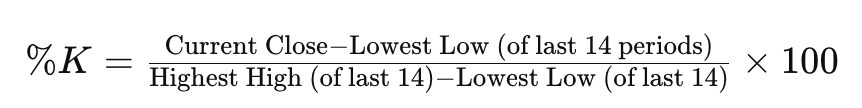
In words, %K compares where the latest closing price is relative to the lowest and highest prices over the look-back window. If the close was the highest price in that span, %K would be 100 (indicating maximum momentum upward). If it was the lowest, %K would be 0 (maximum downward momentum). A %K of 50 means the price is in the middle of the range. %D is just the 3-period simple moving average of %K, so it’s a bit slower and smoother.
Fast vs Slow Stochastic: Originally, what we call %K is sometimes referred to as the “fast stochastic.” There is also a concept of a “slow stochastic,” which is usually just an additional smoothing. Many charting platforms actually default to plotting the slow stochastic oscillator, where what they call %K is already a 3-period average of the original formula, and %D is a further average. To avoid confusion: most modern implementations let you adjust the parameters (often given as %K period, %D period, and a slowing factor). The default might be something like (14, 3, 3) – meaning 14-period %K, 3-period %D, and a 3-period smoothing for %K. In practical use, the standard output you see with two lines is fine – just be aware of what your settings are. For this tutorial, we consider the common default: a 14-period %K and 3-period %D (which effectively is “slow stochastic”).
Interpretation of the Lines: The interaction of %K and %D is key for trading signals:
When the %K line (typically plotted as a solid line, say blue) crosses above the %D line (signal line, say orange), it indicates an upward shift in momentum. If this cross happens in the oversold zone (below 20), it’s often viewed as a bullish signal – price momentum is turning up from an extreme.
Conversely, if %K crosses below the %D line, it shows momentum slowing down. A cross in the overbought zone (above 80) is taken as a bearish signal – momentum turning down from an extreme high.
The reason these crossovers matter is that since %D is a moving average of %K, whenever %K crosses %D, it means the most recent price action’s momentum (reflected by %K) has either accelerated past the recent average or dropped below it. It’s a momentum shift clue.
In summary:
%K above %D = momentum increasing (bullish bias, especially if coming from below).
%K below %D = momentum slowing (bearish bias, especially if coming from above).
Also, note how fast stochastic moves: in very quiet market conditions, it might hover around the middle. In a strongly trending move, it will pin near 100 or 0. The stochastic is bounded between 0 and 100, so it doesn’t drift – it always reflects a relative position. This is different from something like MACD which can theoretically go higher or lower without a fixed range. Being bounded makes stochastic easy to interpret at a glance (extreme vs neutral).
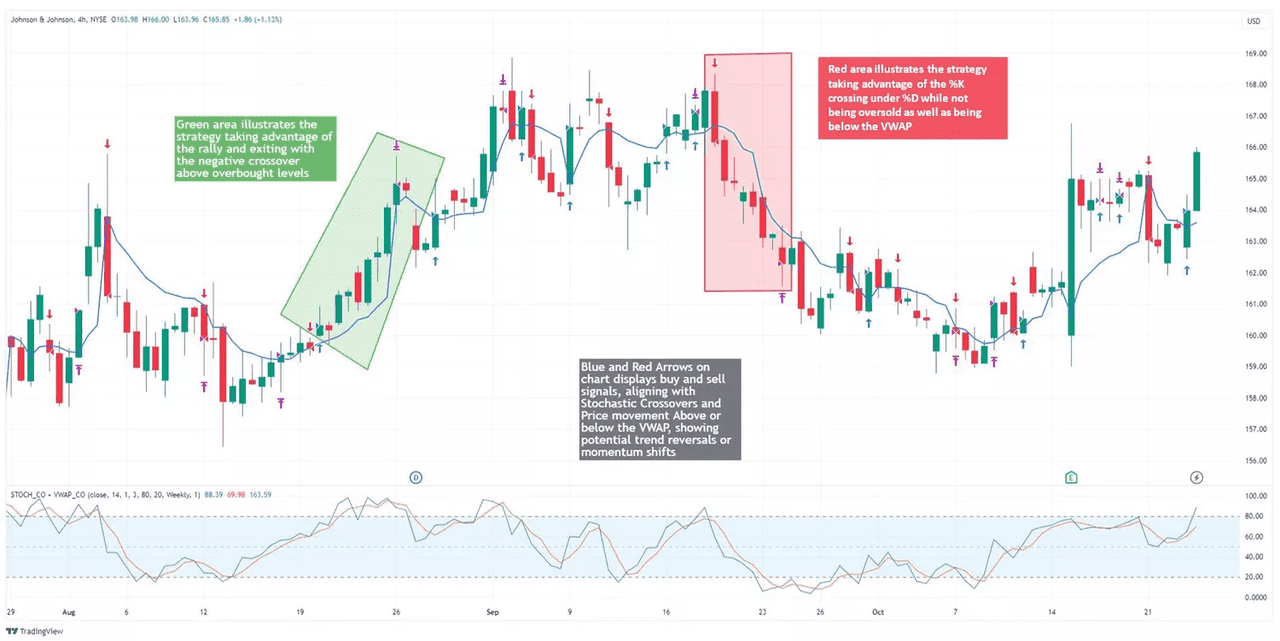
Stochastic Oscillator Trading Strategy (source)
Using Stochastic: Signals and Strategies
Now let’s get into how traders use the stochastic oscillator in practice, particularly in crypto markets known for their volatility. There are a few primary ways stochastic is applied:
Overbought/Oversold Reversal Signals: Traders watch for stochastic lines entering extreme zones (under 20 for oversold and above 80 for overbought) and then crossing. For example, Ethereum under 20 that crosses above %D suggests buyers may be stepping in, prompting a long trade. Conversely, Bitcoin above 80 with a %K crossing below %D indicates a possible pullback, suggesting profit-taking or initiating short trades. Caution is advised as overbought conditions can persist during strong trends.
Bull/Bear “Failure” Swing: If stochastic enters overbought territory but stays above 50 and turns up without crossing below 20, it may indicate a strong continuation trend. Divergence signals can also provide early warnings; if price makes higher highs with lower stochastic highs (bearish divergence) or the opposite (bullish divergence), it could indicate a reversal.
Stochastic with Support/Resistance or Patterns: Using stochastic with support and resistance analysis can enhance trade decisions. For example, if Bitcoin nears a support level at $50,000 and stochastic is below 20, it strengthens the case for a bounce. Conversely, if ETH is at resistance and stochastic is overbought, it may signal a good opportunity to take profits or short.
Multiple Time Frame Analysis: Traders may analyze stochastic across different time frames. For instance, a daily uptrend might prompt waiting for the 1-hour stochastic to dip to oversold before entering a trade. This approach helps time entries more effectively while minimizing false signals.
Combining with Other Indicators: Pairing stochastic with other indicators, like RSI or moving averages, can strengthen signals. For example, simultaneous oversold readings on both RSI and stochastic provide a stronger buy signal. Additionally, consider using MACD with stochastic to confirm momentum direction; a bearish MACD alongside an overbought stochastic could signal a firmer sell condition.
Practical Crypto Example: Let’s illustrate with a hypothetical scenario. Imagine Bitcoin has been range-bound between $95,000 and $105,000 for two weeks. On the 4-hour chart, every time BTC nears $95k, stochastic drops into oversold (<20), and each time BTC nears $105k, stochastic goes over 80. A range trader would notice this pattern. So next time BTC is around $96k and stochastic is, say, 18 and just had %K cross above %D from below, you go long, targeting mid-range or higher, and perhaps you’ll sell if it reaches the upper band of the range. Sure enough, BTC bounces to $102k and stochastic reaches ~85. Now it starts turning down, you see %K cross below %D at ~82 – you exit your long trade to lock profit, and aggressive traders might even short there, expecting a retreat (with a stop above $105k). BTC then dips back toward the range bottom and the cycle repeats. In such a scenario, stochastic is basically your oscillator of choice to time the oscillations in price.
Stochastic vs RSI vs MACD: How Do They Compare?
Relative Strength Index (RSI) and Moving Average Convergence Divergence (MACD) are two other very popular indicators. How does the stochastic oscillator differ and when might you use one versus the other?
Stochastic vs RSI: Both are momentum oscillators that identify overbought/oversold conditions, but they differ in approach. RSI measures the magnitude of recent gains versus losses and is smoother, making it suitable for trend confirmation on higher timeframes (above 50 indicates an uptrend). Stochastic focuses on closing positions within a range and is more sensitive, making it ideal for short-term timing and capturing oscillations in a ranging market. While RSI is slow-moving, stochastic can give more frequent signals, especially useful for day traders. Divergences are significant for RSI, while with stochastic, one must ensure equivalent swing point comparisons. An example is Bitcoin, where the stochastic was overbought (
96) while RSI was neutral (57), suggesting caution.Stochastic vs MACD: These indicators serve different purposes. MACD is a trend-following momentum indicator based on the convergence/divergence of two moving averages and oscillates around a zero line. It identifies trend changes but lacks overbought/oversold indicators like stochastic. MACD is great for confirming trends, while stochastic helps pinpoint entry/exit points in shorter swings. In practice, using MACD for trend direction and stochastic for timing provides a strategic advantage. Overall, MACD acts as a trend/momentum filter, while stochastic serves as a fast oscillator for short-term shifts, complementing each other effectively.
To summarize differences in a handy way (inspired by a comparison table):
Sensitivity: Stochastic reacts more quickly to price changes; RSI is a bit slower; MACD is slower still (especially in signaling an actual cross).
Best use case: Stochastic for short-term reversals in ranging or mild trending conditions; RSI for confirming trend strength or spotting classic divergences; MACD for identifying trend direction and momentum shifts in trend-following strategies.
Range vs Unbounded: Stoch and RSI are bounded 0-100, making overbought/oversold straightforward. MACD is unbounded (though you interpret it relative to its own past extremes).
Output: Stochastic and RSI output on similar scales (just different math); MACD outputs two lines oscillating around zero (more of a dual moving average system).
Ease for beginners: Many find RSI simpler (one line, clear 70/30 rule). Stochastic has two lines but is still beginner-friendly. MACD is also two lines plus histogram, and some newbies find it a bit to interpret at first but it’s not too hard.
There’s no “best” indicator – each has pros/cons. In fact, some chart setups include both RSI and stochastic. One common combination is Stochastic RSI – which is actually applying the stochastic formula to RSI values (basically an indicator of an indicator). Stochastic RSI ends up extremely twitchy and is used for very fast signals – beyond our scope here, but be aware it exists; crypto traders sometimes use Stoch RSI on short timeframes.
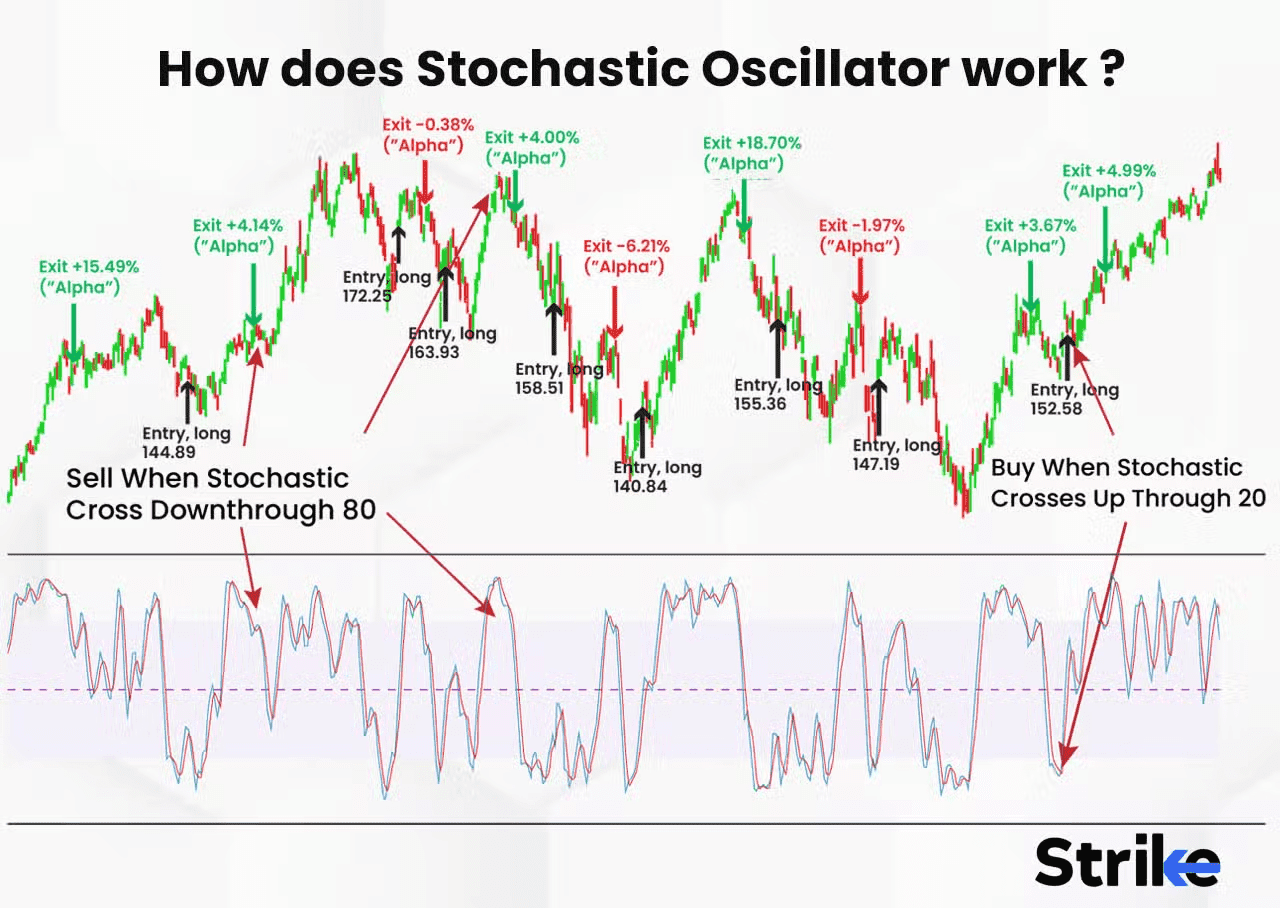
How the Stochastic Oscillator Works (source)
Tips for Trading Crypto with Stochastic
Use the Right Settings: While the default 14,3 stochastic works for many, adjusting the look-back period can be beneficial in different market conditions. For choppy markets, consider an 8-period setting for quicker signals, while in highly volatile scenarios, a longer period or smoothing with %K slowing 5 helps reduce noise. Always test settings on historical charts, but avoid over-optimizing—sticking close to defaults is often effective.
Don’t Rely on Stochastic Alone: It's essential to seek confirmation from price action or other indicators to enhance reliability. A stochastic buy signal is more credible alongside bullish patterns or volume spikes. Use stochastic as one tool in your analysis, combining signals to filter out poor trades.
Avoid Whipsaws: In low volatility, stochastic can generate false signals. Consider lengthening the timeframe or indicator period, or refrain from trading in these conditions. When markets are range-bound, stochastic can catch swings; in trending markets, adapt your strategy by following trends and using breakouts. Implementing a trend filter can reduce whipsaw losses.
Divergences Can Warn You: Watch for divergences where price moves contrary to stochastic. Bearish divergence (higher price, lower stochastic) or bullish divergence (lower price, higher stochastic) can signal potential reversals. Combine these divergences with other indicators for better accuracy.
Practice on Historical Charts: Review past price moves and stochastic behavior to build intuition. Recognize patterns that led to significant price changes, which can inform real-time trading decisions.
Risk Management on Signals: Always manage risk with stop-loss orders. Don’t hold positions solely based on stochastic signals if the price movement contradicts expectations. If a stochastic signal fails, it may indicate a contrary trend. Cutting losses promptly is crucial.
Adapting to Altcoins: Different altcoins exhibit varying volatility, which may require adjustments to stochastic settings. Higher volatility may warrant tighter thresholds (e.g., 85/15), while stable coins like Bitcoin often work well with 80/20. During extreme market conditions, focus on price action instead, as oscillators may become less effective.
Conclusion
The stochastic oscillator is a valuable indicator for crypto trading, especially in markets with clear oscillatory behavior. It helps identify when momentum is fading or picking up, allowing for better timing of entries and exits.
For beginner to intermediate traders, it’s essential to recognize key signals like crossovers in extreme zones and confirm with price action (e.g., don't buy solely because it’s oversold). It should be used alongside trend analysis and other indicators.
Advanced traders can integrate stochastic into custom systems or algorithms, applying specific thresholds for buying and selling. Each cryptocurrency may respond differently to stochastic due to its unique "rhythm," but overall, the emotional nature of crypto markets makes them susceptible to momentum indicators.
Whether day trading Bitcoin or swing trading altcoins, the stochastic oscillator offers insights into market psychology and helps anticipate price actions. If you want to put this knowledge to use and trade with the stochastic oscillator indicator, then Phemex is the user-centric exchange that caters to both beginners and advanced traders.