

 The Moving Average Convergence Divergence (MACD) is a widely-used momentum indicator among traders. Developed in the 1970s by Gerald Appel, it illustrates the relationship between two moving averages of price. Essentially, MACD helps identify both the direction of trends and their momentum. For cryptocurrency traders, MACD can signal bullish or bearish trends as they begin or end. By monitoring MACD’s lines and histogram, you can identify good entry and exit points in the often-volatile crypto markets. Let's break down how MACD works and how to trade it effectively.
Introduction
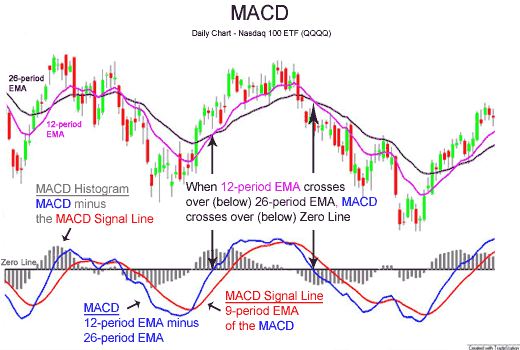
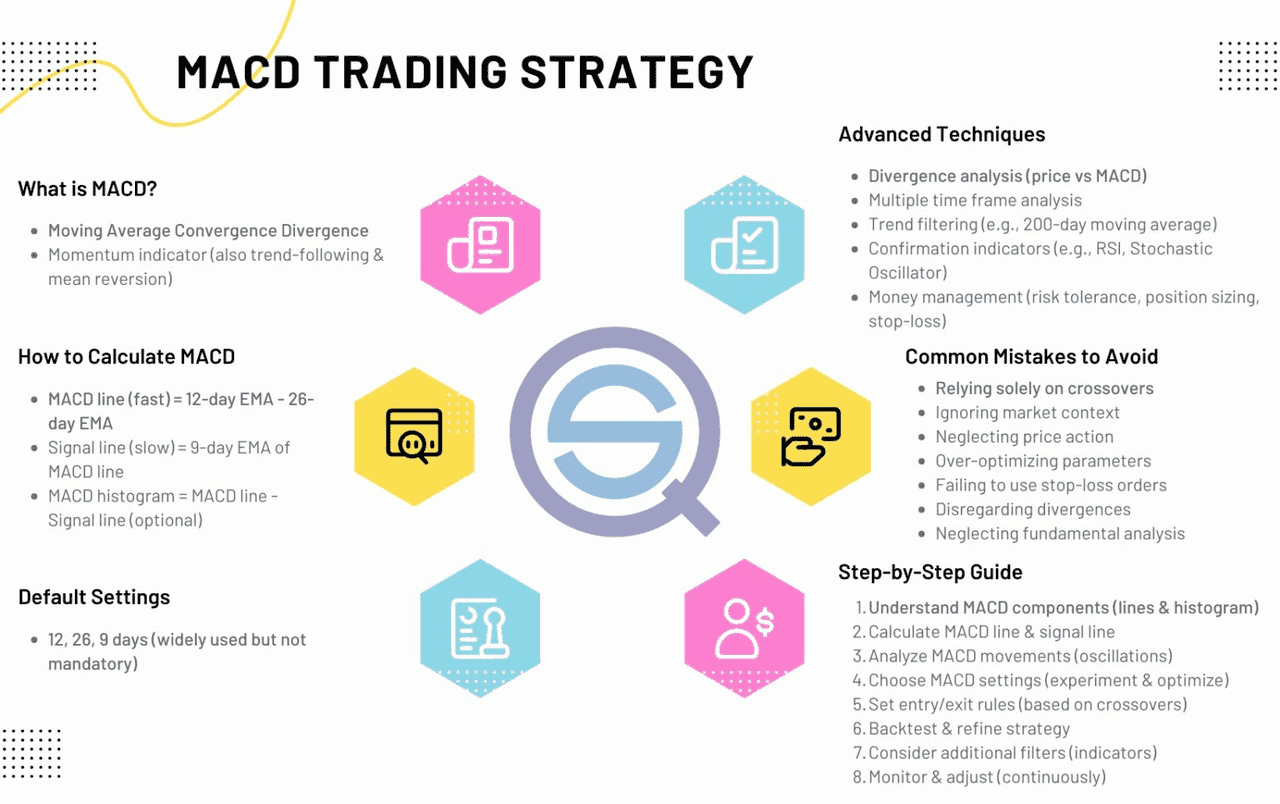
MACD comprises three components: the MACD line, the signal line, and the histogram. The MACD line is the difference between a faster and a slower exponential moving average (commonly the 12-period EMA minus the 26-period EMA). The signal line is usually a 9-period EMA of the MACD line, which smooths it out. The histogram represents the difference between the MACD line and the signal line.
When the MACD line crosses above the signal line, it typically suggests upward momentum; conversely, when it crosses below, it indicates downward momentum. In cryptocurrency charts, these crossovers and changes in the histogram provide traders with visual cues about potential trend shifts. Since MACD integrates trend-following (through the moving averages) with momentum analysis, it can identify emerging trends that might be overlooked by simple moving averages or oscillators alone.
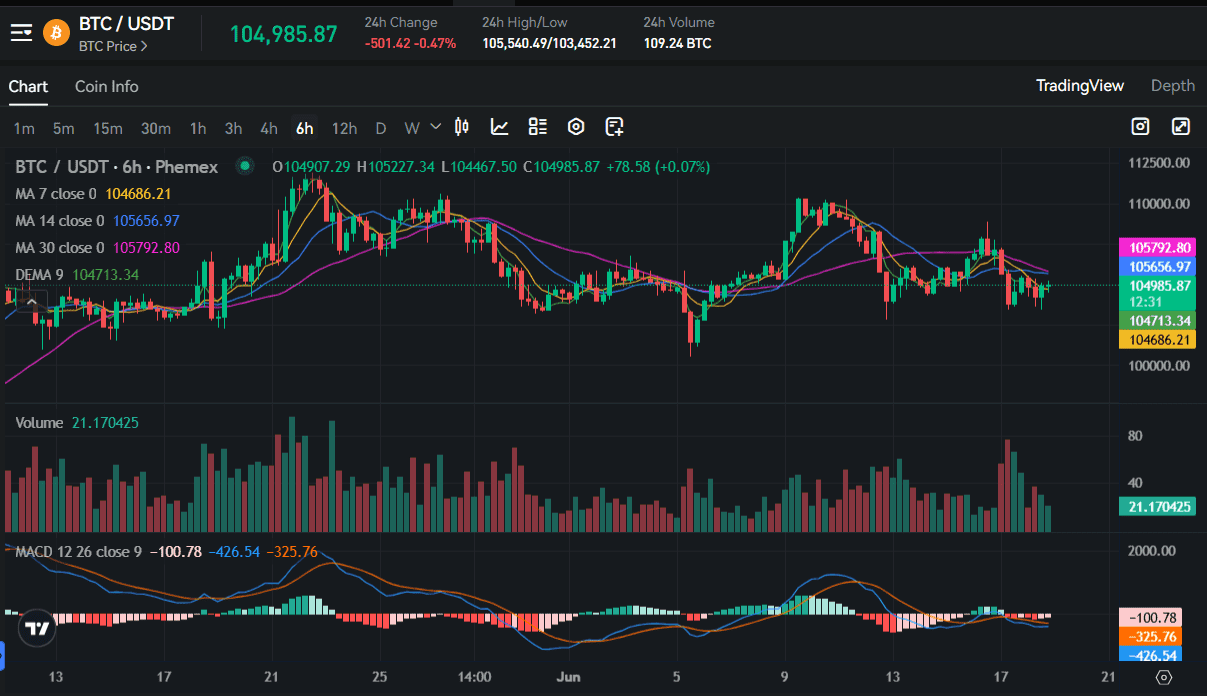
Bitcoin MACD 12/26/9 (source)
What Is MACD?
The MACD (Moving Average Convergence Divergence) is calculated as the difference between the 12-period Exponential Moving Average (EMA) and the 26-period EMA. This difference reflects short-term versus long-term trends. On a chart, the MACD indicator typically displays two lines: the MACD line and a signal line.
A positive MACD value occurs when the MACD line is above the zero baseline, indicating that the 12-period EMA is above the 26-period EMA, which is a bullish signal. Conversely, a negative MACD indicates that the 12-period EMA is below the 26-period EMA. MACD helps investors identify potential entry points for buying or selling by highlighting shifts in momentum.
The histogram, usually shown as vertical bars, illustrates the distance between the MACD line and the signal line. Growing bars signify that momentum is building in the direction of a crossover, while shrinking bars indicate that momentum is fading.
MACD is recognized as a trend-following momentum indicator. Unlike the Relative Strength Index (RSI), it does not provide fixed overbought or oversold levels; instead, it is relative to recent price action. The common configuration of MACD is 12/26/9 on daily charts, but traders often adapt it for different timeframes. In the cryptocurrency market, some traders experiment with faster settings, such as 7/19/5, to respond more quickly to intraday fluctuations; however, the standard 12/26/9 configuration remains a reliable baseline.
One advantage of using MACD is that it combines both trend analysis (via moving averages) and momentum, offering a more comprehensive signal for traders.
Psychology Behind It
MACD essentially measures the speed and change of price movements, which resonates with trader psychology. When the MACD line rises above zero, it means recent prices are higher than past prices (short MA above long MA), fueling bullish sentiment. A crossover of MACD above its signal line is often viewed as a “green light” by momentum traders. This happens because it reflects increasing buying pressure: imagine the recent 12-period EMA accelerating away from the 26-period EMA as bulls take control. Conversely, a MACD crossing below its signal line signals increasing selling pressure – a red flag for bulls and potentially panic for many traders.
Divergence psychology is also key with MACD. When price makes a new high but MACD does not (i.e., its peaks are lower), it indicates waning momentum even as traders cheer on the new high. This can create doubt and caution among investors – many will interpret such divergence as hidden bearish sentiment. Likewise, if price makes a lower low but MACD’s lows are rising, it hints bulls are quietly accumulating, injecting optimism. Essentially, MACD divergence can be viewed as a game of “check the engine’s revs” – if the car (price) is going faster but the engine (MACD) isn’t revving more, something’s off.
How to Identify MACD on Charts
On a crypto price chart, the MACD indicator often appears in its own pane below price. You’ll see two lines (often one thick and one thin) plus histogram bars. Here’s how to read it:
-
MACD Line vs Signal Line: The blue (or differently colored) MACD line is EMA12–26. The orange (or other color) is the signal line (9-EMA of MACD). When the MACD line crosses above the signal line, it is generally a bullish signal; when it crosses below, it is bearish. These crossovers are the bread-and-butter signals.
-
Histogram: The bars above/below zero show the distance between MACD and signal. Rising bars above zero mean strengthening bullish momentum; falling bars above zero (or bars below zero shrinking) mean weakening momentum. Conversely, bars below zero getting deeper denote increasing bearish momentum. Many traders watch for the histogram to flip sign as an early signal: for example, when the histogram turns from negative to positive, it often happens just before a bullish crossover.
-
Zero Line Cross: While less discussed, a MACD crossing above zero (regardless of the signal line) indicates that the short EMA has crossed above the long. Some use this as a cue that a bullish trend is underway, especially on larger timeframes.
-
Watch for Divergence: If price keeps rising but the MACD line makes lower highs (bearish divergence), that warns the uptrend may stall. A bullish divergence (price down, MACD up) can signal a coming reversal. The key is to spot these mismatches between price action and the indicator.
-
Setup Optimization: In volatile crypto markets, many traders use the classic 12/26/9 on daily or 4-hour charts. On shorter timeframes (15-min, 1-hr), they may adjust to something like 7/19/5 for quicker signals, though this is more sensitive. It’s worth experimenting in a demo account to see what fits the asset’s rhythm.
When identifying trade opportunities, many traders look for MACD crossovers in the direction of the larger trend. For example, in an overall uptrend, a MACD line crossing above the signal line on a pullback is taken as a continuation. Crossovers are more reliable when they conform to the prevailing trend, so first determine trend (via moving averages or price swing analysis), then use MACD crosses as entries in that trend’s direction.
MACD Analysis
How to Trade With MACD
MACD can be employed in several ways:
-
Crossover Strategy: The simplest is to trade the MACD line cross of the signal line. Buy (go long) when MACD crosses above signal; sell/short when it crosses below. To improve accuracy, many traders only take crossovers that happen above/below certain levels. For example, a bullish crossover while MACD is already above zero (so both MACD and signal are above baseline) is stronger than one where both are below zero.
-
Histogram Reversal: Some traders watch for the histogram to flip signs. For instance, bars turning from red (below zero) to green (above zero) often precede price upswings. This technique anticipates the crossover by watching the decreasing gap.
-
Divergence Trading: If you spot a MACD divergence (as discussed), you might enter a trade opposite to the prevailing minor move. For example, if ETH price makes a new swing high but MACD’s high is lower, you could interpret this as a warning and tighten long stops or even place a short, expecting a reversal. Conversely, bullish divergence (price makes lower low, MACD higher low) could be used as a buy signal.
-
Trend Confirmation: Use MACD to filter trades. In a strong trend (say Bitcoin up 20% over a week), you might only take long signals when MACD is above zero. If MACD is below zero during an uptrend, you might avoid longs and wait for it to flip positive.
Here’s an example: Bitcoin has been trending up, but it recently pulled back. On the daily chart, MACD’s blue line dips but then crosses back above the orange signal line while both are still above zero. A trader might see this as a strong buy signal – the uptrend has resumed momentum. They could enter and place a stop just below the recent swing low. As the trend continues, MACD’s histogram would likely show tall green bars, confirming the move. Eventually, when MACD flattens or crosses down, they’d consider taking profit.
The key is discipline: MACD signals are objective. Don’t argue with a clean crossover just because you feel the trend should continue. Conversely, if you feel a reversal but MACD is rising, it’s wise to hold off or wait for confirmation. As with any strategy, backtesting and demo trading a MACD system can help refine entries and exits for the crypto pair you trade.
When Not to Use MACD (Limitations)
MACD is not foolproof. It is inherently a lagging indicator because it relies on moving averages of past prices. In highly volatile or sideways crypto markets, MACD can generate false signals or whipsaws. For instance, in a ranging market, MACD might cross up and down frequently without meaningful price follow-through. Investopedia warns that MACD divergences in particular produce many “false positives” in consolidations. In plain terms, MACD may signal a reversal that never materializes if the market is just meandering.
Another limitation is lack of fixed thresholds. Unlike RSI which has 70/30 bounds, MACD’s values are unbounded. You must interpret its lines relative to each other. This makes it somewhat subjective unless rules (e.g. only trade crossovers above/below zero) are established.
MACD also struggles in a choppy market. Traders often avoid using MACD signals when the ADX (or other trend strength indicators) shows no trend. In fact, savvy traders sometimes wait to see ADX climb above 25 before trusting a MACD signal. As Investopedia notes, checking ADX can filter out false signals: if MACD gives a sell signal but ADX is low (no trend), it might pay to ignore it.
Finally, MACD works best on longer timeframes. On very short 1-minute charts, it can react too slowly or give erratic signals. Most crypto swing traders use it on 15-minute candles or higher. If you need quick scalp entries, a faster indicator might be more preferable.
MACD Trading Strategy (source)
Bonus Tips and Historical Notes
-
Origins: The MACD was introduced by Gerald Appel in the late 1970s. It gained popularity because it packaged trend-following and momentum in one indicator. Even today it remains a default on most trading platforms (including crypto exchanges).
-
Default Settings: The standard (12,26,9) is a good starting point, especially on daily charts. For faster or smaller timeframes, some traders shorten the EMAs (e.g., 7/19/5) to react quicker to intraday moves – useful in fast crypto markets but expect more noise.
-
Histogram Insight: Pay attention to histogram peaks. A very high positive histogram often precedes an overextension (MACD far above signal). Conversely, when histogram shrinks, momentum is cooling. Viewing the histogram peaks can help you anticipate when to take profits (when it starts to diminish).
-
Cross Verification: MACD is often used together with RSI or moving averages. For example, an RSI overbought reading plus a MACD bearish crossover is a strong sell combo.
-
Trending Context: Remember that MACD confirms existing trends well. If Bitcoin is in a strong uptrend (higher highs, higher lows), a bullish MACD crossover is worth acting on. But in a bear market, even bullish MACD signals may fail more often. Context is key.
MACD’s beauty lies in its versatility. It can signal entry, highlight momentum bursts, and even warn of hidden reversals via divergence. It’s no wonder traders call it one of the simplest yet most effective indicators when used judiciously.
Conclusion
MACD remains a go-to indicator for crypto traders seeking trend and momentum cues. By watching MACD line crossovers and divergences with price, you can gain early insight into shifting market dynamics. Just remember its cues are lagging, so use them in conjunction with price action and trend strength confirmation (like checking ADX).
Ready to trade with MACD on crypto? Open Phemex’s advanced charts and add the MACD indicator to see these crossovers live on Bitcoin, Ethereum, or your favorite altcoin. The platform’s professional tools make it easy to experiment with MACD settings and test your strategies in real-time. And while you’re there, explore Phemex Earn programs or join Pulse SocialFi to complement your technical analysis with community signals and decentralized finance opportunities. In 2025 and beyond, combining classic indicators like MACD with the latest crypto features will help you trade smarter.