

The financial space has unearthed all kinds of strategies to help traders and analysts better predict the outcome of market trades. One of the most critical factors that can affect asset prices, especially in the cryptocurrency space, is market sentiment. Using tools to gauge how the market feels about an asset’s cost can be crucial to maintaining a successful portfolio. If a market is determined to be overbought or oversold, various trading opportunities arise in anticipation of profiting off an eventual market correction.
How do Overbought and Oversold Levels Take Place?
An asset’s overbought and oversold levels are concepts used to gauge whether the market is trending up or down. They can also be used to predict upcoming trend reversals to better time trading orders.
Every asset has an intrinsic value, which is what the market considers an asset to be worth based on objective calculation or complex modeling. Often, traders will rush to buy or sell an asset driven by news, popular trends, earnings reports or ongoing events. This can lead the asset to sell at a price higher or lower than its intrinsic value.
What is Overbought?
When an asset is overbought, its price trends upwards for an extended period and gets pushed above its intrinsic value. In this case, price correction would mean a sell-off is due in order for prices to fall back to intrinsic value.
What is Oversold?
An oversold market implied the opposite scenario. When asset price is bearish for an extended period, it could be floating below its intrinsic value. Often, an oversold phase is followed by a bullish surge, causing price to rise back up to near its intrinsic value. If a trader correctly recognizes that an asset is oversold, he can buy in at the low price and reap greater profits.
What is ‘intrinsic value’ in overbought and oversold markets?
We know that overbought and oversold zones are deviations from the intrinsic value of an asset, but how exactly is intrinsic value determined?
It’s complicated to assess for two primary reasons: complex calculations go into determining an asset’s underlying value and the evaluation can be subjective. While some analysts heavily weigh qualitative data like the company’s infrastructure, target markets, and governance model, others emphasise quantitative factors like earnings potential.
There are two popular models designed by analysts to check what an asset or company is actually worth.

Discount cash flow (DCF) model
The DCF method uses two metrics: a company’s free cash flow and weighted average cost of capital (WACC). Free cash flow is calculated after subtracting cash outflows for supporting company operations and maintaining its capital assets.
WACC is the cost of capital, which takes company expenses into account. IT tells an investor the expected returns on an asset after all the capital costs have been paid out. In this model, evaluators also add any future cash inflows from profitable projects and investments to determine the intrinsic value more accurately.
Ideally, for an asset with healthy market performance, a company’s overall cost of capital should always be below its rate of return and intrinsic value.
Market risk-based model
Models for calculating the intrinsic value of an asset can also be used to estimate market risk. The risk factor attached to a stock price is known as its beta value. This determines the asset’s volatility level. A beta value of 1 would be market-neutral because it’s in line with the overall market.
When beta is greater than 1, the asset is running at high risk and volatility. When beta is below 1, the asset is considered relatively safe. This is factored into an asset’s intrinsic value. Technical analysis uses a combination of indicators to paint a clearer picture of price trends, reversals, and the overbought or oversold zones.
Indicators that Gauge Overbought and Oversold Markets
Determining whether an asset is overbought or oversold requires a certain amount of knowledge about market indicators. The three main ones that help most are the Relative Strength Index (RSI), Stochastic Oscillator, and Bollinger Bands.
RSI overbought vs oversold
The Relative Strength Index is a kind of momentum oscillator that charts how quickly and significantly asset prices move. It can be used to determine whether the asset is overbought or oversold.
- Overbought = RSI> 70
- Oversold = RSI <30
In the below graph, the RSI chart runs right under the main price chart window, indicating the overbought and oversold regions of the asset. RSI values can range between 0 to 100. An asset with an RSI value above 70 is said to have entered overbought territory, whereas it is in the oversold zone if RSI drops below 30.
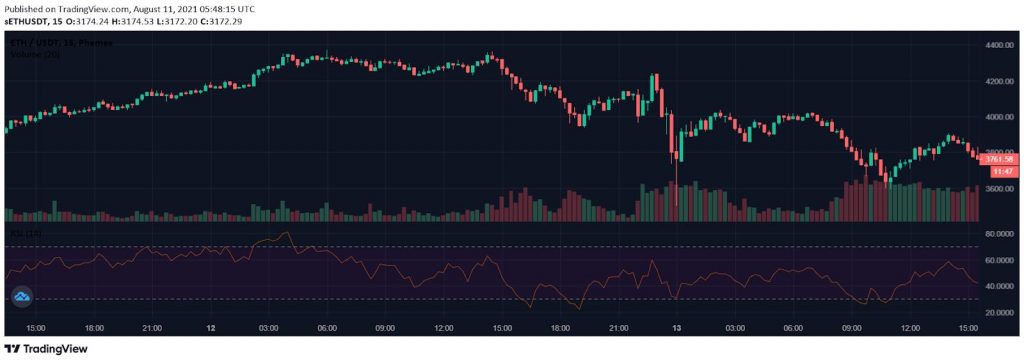
ETH/USDT price chart | Source: TradingView
Stochastic Oscillator overbought vs oversold
Developed in the 1950s, the Stochastic Oscillator accurately locates an asset’s overbought or oversold zones. Like the RSI, the Stochastic Oscillator is a momentum oscillator and uses an asset’s price action and history to determine future trends.
- Overbought = Stochastic >80
- Oversold = Stochastic <20
This metric takes the day’s closing price and compares it to a range of asset prices over a certain period to. The indicator ranges from 0 to 100, and the asset is considered overbought when the graph oscillates above 80. When the value falls below 20, the asset is thought to have crashed into oversold territory.

Below is an example of the Stochastic Oscillator showing the overbought and oversold zones on the BTC/USDT price chart. The Stochastic Oscillator is sensitive to market movements, so small yet sudden price changes can cause the indicator to change.
To reduce this sensitivity, traders either adjust the observed time frame or use a moving average to provide more perspective.

BTC/USDT price chart | Source: TradingView
Bollinger Bands overbought vs oversold
- Overbought = Price move towards the Upper Band
- Oversold = Price move towards the Lower Band
Bollinger Bands are a set of indicators used to gauge market volatility. It uses three main components: the upper Bollinger band, lower Bollinger band, and a simple moving average.
The upper and lower bands move around the moving average to indicate the bounds of current market prices. Bands widen to illustrate higher volatility, and tighten when prices tend to be more stable. Bollinger bands can be great for detecting when an asset is overbought or oversold.
Below is a chart showing Bollinger bands wrapped around the price line and a moving average cutting through the middle. Though the bands are the main event here, the moving average also provides support and resistance levels to the asset’s price movements.
Statistically, the two bands are known to encompass 95% of price movements between them. Whenever the price breaks out either above or below the bands, there’s a high chance the market will see explosive moves in the opposite direction. Such circumstances may signal an overbought or oversold market.

BTC/USDT price chart | Source: TradingView
Conclusion
No indicator alone can predict how markets will price asset values moving forward. While the above indicators are great for detecting overbought and oversold levels, they don’t always present the entire picture. They should be used alongside other indicators to boost the accuracy of findings.
For instance, one of the more popular combinations comprises the 20-day Exponential Moving Average (EMA), 200-day Simple Moving Average (SMA), and the Stochastic Oscillator. Individually, these indicators offer narrow perspectives on the market, but together they can offer a clearer picture.
Read More
- Uptrends and Downtrends: How to Spot and Trade Them?
- Stochastic Oscillator: Everything You Need To Know
- How to Read Crypto Charts: Learn Trading Chart Patterns
- What is Stochastic RSI: Finding Overbought and Oversold Levels of An RSI
- What is Chande Momentum Oscillator (CMO): An Alternative to the RSI Indicator
- What are Highs and Lows in Trading: The World of Financial Highs and Lows
- Buy Low, Sell High Crypto: 4 Things To Do (3 To Avoid)
- Phemex Analysis in A Minute: OM Surge 325% in 5 Days! What's Next?