
Key Takeaways
On-Balance Volume (OBV) is a technical analysis indicator that uses trading volume to predict potential price movements.
OBV adds volume on up days and subtracts it on down days to show whether volume is flowing into or out of an asset.
Traders use OBV to identify bullish or bearish divergences between volume and price trends.
It works best when combined with other indicators or chart patterns to confirm potential signals.
OBV is commonly applied in both crypto and traditional markets to assess momentum and trend strength.
Technical analysts often say “volume precedes price.” The On-Balance Volume (OBV) indicator is built on exactly that idea – that changes in trading volume can foreshadow price movements. OBV is one of the simplest yet most powerful indicators for gauging the flow of money into and out of an asset. In this tutorial, we’ll explain what OBV is and how it works, show you how to calculate and interpret it, demonstrate how to use OBV in crypto trading (with strategies like trend confirmation and divergence), provide real chart examples, and compare OBV with other popular volume-based indicators. By the end, you’ll understand how to incorporate OBV into your trading toolkit to better time entries and exits based on volume dynamics.
What is OBV? – Volume’s Voice in Technical Analysis
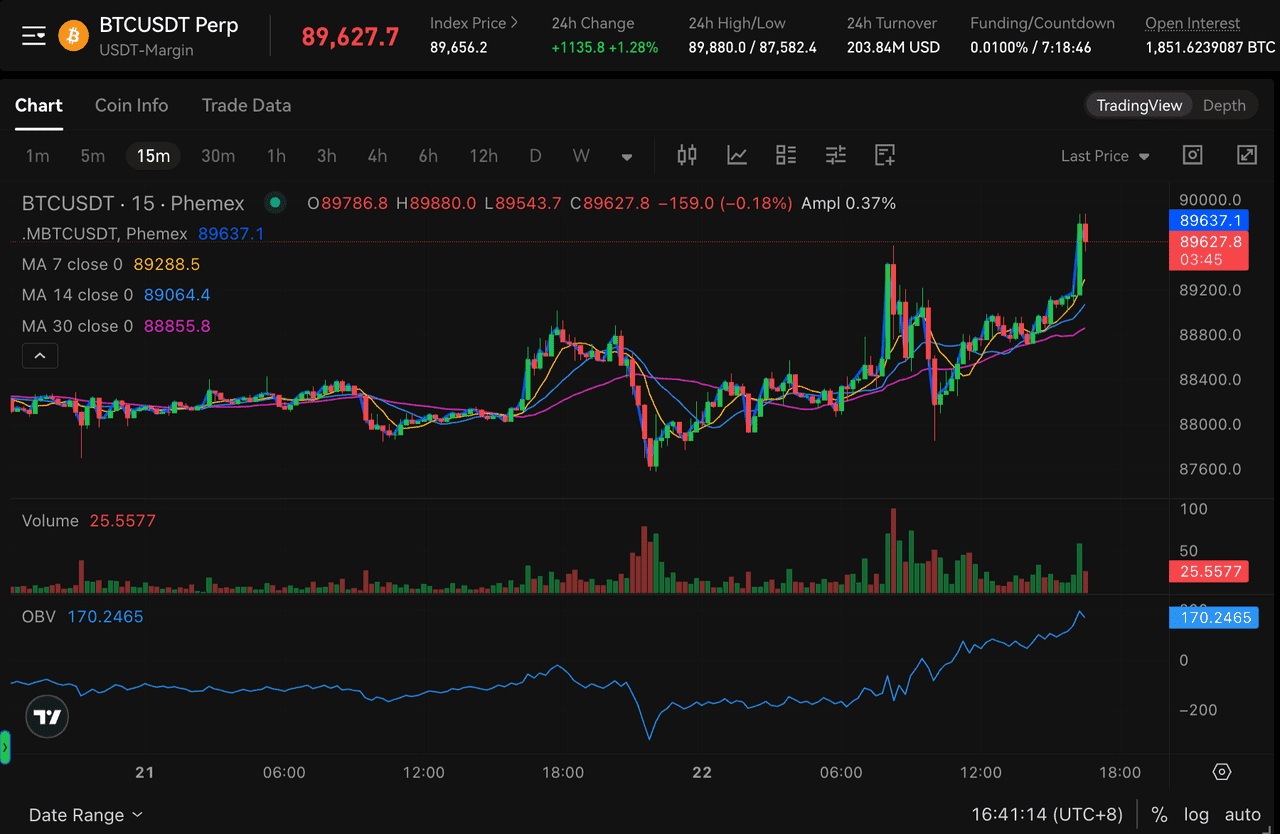
On-Balance Volume (OBV) is a momentum indicator that links volume to price changes, developed by Joe Granville in his 1963 book. It measures the flow of buying and selling pressure by maintaining a cumulative total: adding volume on up days and subtracting on down days. A rising OBV indicates increased buying activity, while a falling OBV reflects selling pressure. The absolute value of OBV is less important than its trend relative to price. It can signal market conviction, with higher OBV suggesting institutional buying and lower OBV indicating potential distribution. In crypto markets, OBV helps identify activity by large players, even when prices remain stable.
How is OBV Calculated?
The calculation of OBV is straightforward. You only need price and volume data. Here is the formula and rules:
- OBV equation:
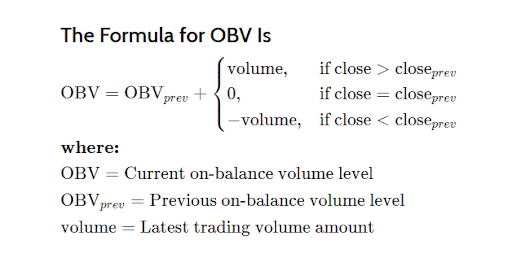
By these rules:
Up day (price goes up) – add the day’s volume to cumulative OBV.
Down day (price goes down) – subtract the day’s volume from OBV.
Flat day (no change) – OBV unchanged.
Let’s illustrate with a quick example:
Day 1: Price = $100 (no previous day, start OBV at 0 for baseline).
Day 2: Price = $105 (up from $100), Volume = 5000. OBV = 0 + 5000 = 5000.
Day 3: Price = $103 (down from $105), Volume = 7000. OBV = 5000 – 7000 = -2000.
Day 4: Price = $103 (unchanged), Volume = 6000. OBV = -2000 (unchanged, since price didn’t move).
Day 5: Price = $106 (up from $103), Volume = 8000. OBV = -2000 + 8000 = 6000.
In this sequence, OBV moved up and down based on volume and price direction, ending higher at 6000 indicating net positive volume flow over the period.
Because OBV is cumulative, it’s often started at an arbitrary value (like 0) and then just tracks changes. What’s important is not the absolute number, but the shape of the OBV line. Is it making higher highs and higher lows (uptrend)? Flat? Diverging from price?
To summarize interpretation:
Rising OBV (line slanting up) – signifies accumulation: buying pressure. Often bullish, as it suggests volume is supporting the price rise (or even leading it).
Falling OBV – signifies distribution: selling pressure. Often bearish, especially if price hasn’t yet fallen much – could be a warning sign.
Sideways OBV – roughly equal buying and selling volumes; during price consolidation, a flat OBV is expected. A breakout from flat can be insightful.
How Does OBV Work? – Using OBV in Crypto Trading
Using OBV effectively involves looking at the relationship between the OBV line and the price chart. There are two primary ways traders apply OBV:
Trend Confirmation (Volume Confirmation): Does OBV move in tandem with price, confirming the trend’s strength?
Divergences: Is OBV moving in the opposite direction of price, indicating a potential upcoming reversal?
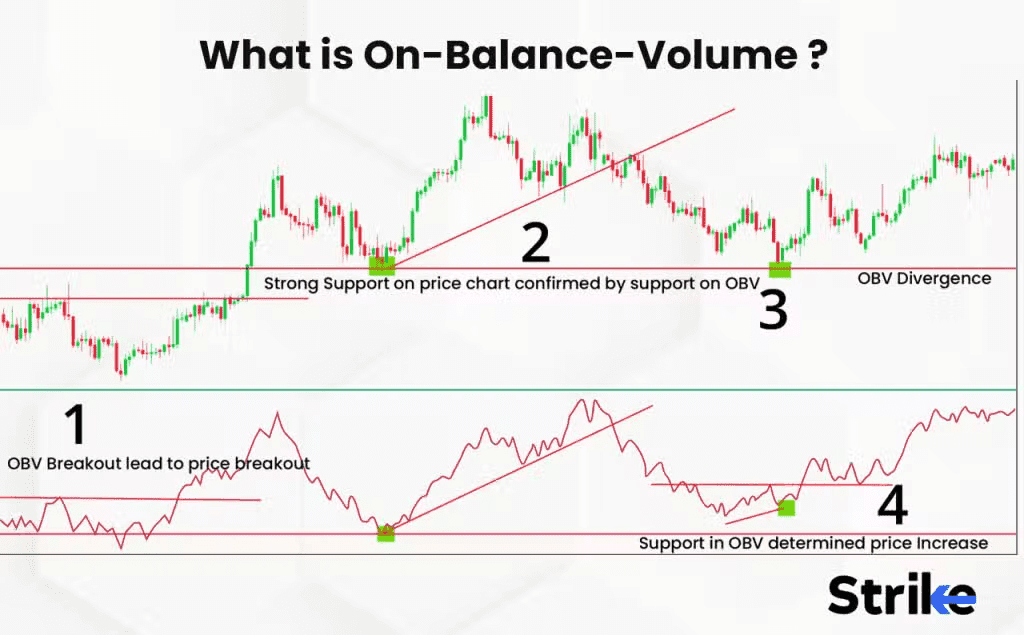
OBV Trend Confirmation
When an asset’s price is trending clearly, On-Balance Volume (OBV) can confirm the trend's strength. In a healthy uptrend, OBV should also trend upward, indicating that buying volume exceeds selling volume, suggesting strong buying interest. If both price and OBV are making higher highs, it signals a robust trend.
Conversely, in a downtrend, a declining OBV confirms prevalent selling volume, reinforcing confidence in the continuation of the downtrend. For instance, if Bitcoin’s price rises over a month while OBV climbs steadily, this alignment supports the trend. If price pulls back but OBV remains steady with low volume, it could be a bullish sign.
During breakouts, a spike in OBV alongside a price break above resistance is a confirmation signal. High volume suggests the move is genuine and likely to last. Sometimes, OBV even breaks resistance before price does, indicating smart money is buying.
Traders may draw trendlines on OBV. A break of an upward trendline could signal weakening buying pressure, even if the price hasn't shown weakness yet. In the context of the 2021 Bitcoin rally, a rising OBV confirmed the bull trend, while flat OBV amid new price highs could signal weak volume support—serving as a cautionary sign.
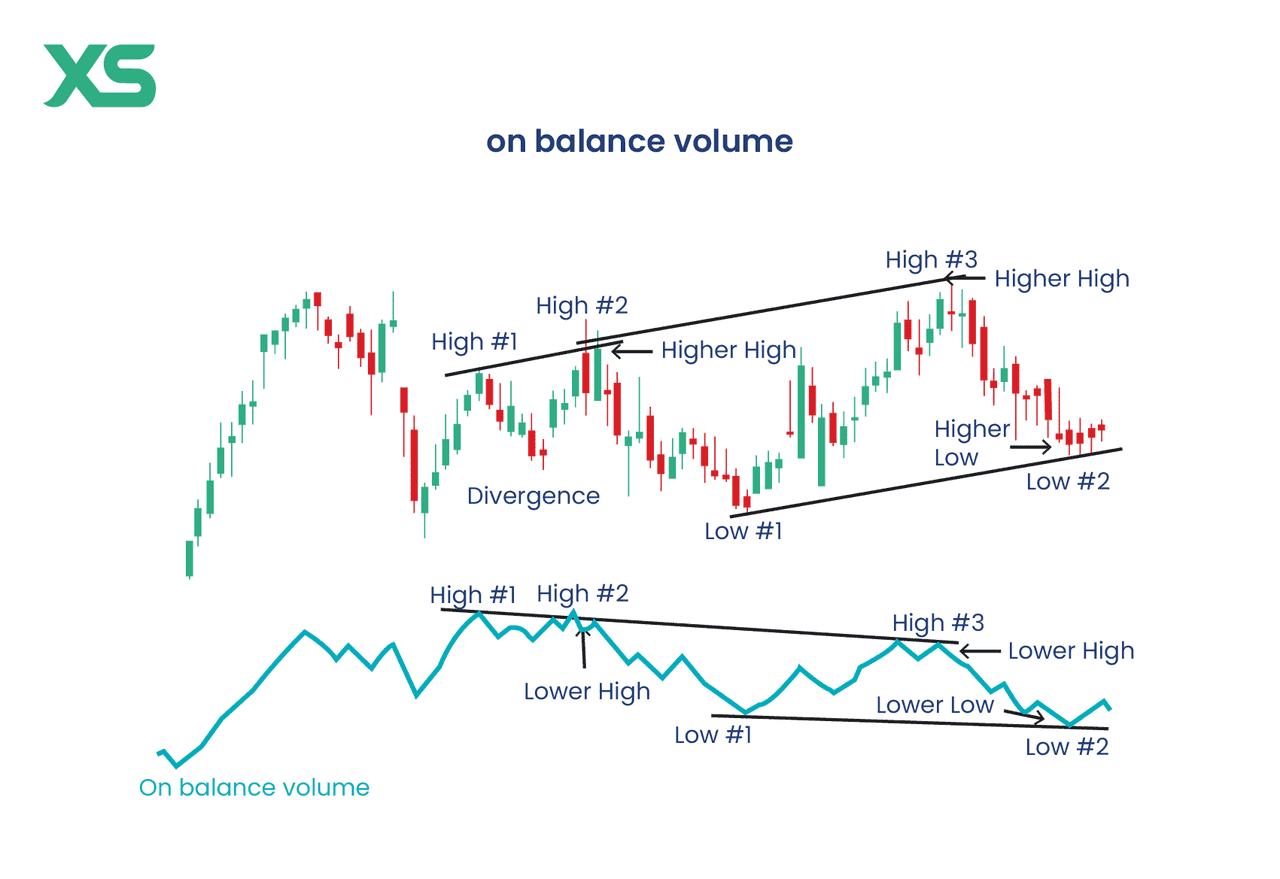
OBV Divergence – Anticipating Trend Reversals
A divergence occurs when an indicator and price show contradictory signs. In the case of On-Balance Volume (OBV), classic divergences include:
Bullish divergence: Price makes lower lows (e.g., dropping from $2,000 to $1,400), but OBV makes higher lows (e.g., increasing from 200,000 to 210,000). This indicates waning selling pressure and suggests accumulation, often preceding an upward price reversal. Traders may consider entering long positions or tightening stop-losses on shorts, especially if reinforced by other indicators like RSI.
Bearish divergence: Price makes higher highs (e.g., rising from $80 to $130), while OBV shows lower highs. This suggests the rally is losing strength and could lead to a bearish reversal, prompting traders to take profits on longs or short positions.
Hidden divergences: These include hidden bullish divergence (higher price low but lower OBV low, indicating trend continuation) and hidden bearish divergence (lower price high but higher OBV high, suggesting downtrend continuation).
Real crypto charts often reflect these divergences before significant price movements. For instance, before Bitcoin surged from ~$4k to $5k in April 2019, OBV had been rising, signaling accumulation. Conversely, before Bitcoin's drop from ~$65k in April 2021, a bearish divergence was evident as OBV was lower than in February, predicting the subsequent decline.
Using OBV in Trading Strategies
Here are a few common ways traders incorporate OBV into their strategies:
Confirmation Tool: As mentioned, if you trade classic chart patterns (breakouts, head & shoulders, etc.), use OBV to confirm. E.g., breakout trading: when a coin breaks above a resistance, check if OBV also broke above a prior high or resistance level. If yes, it’s a stronger signal (volume confirming). If OBV is lagging, you might be cautious or wait.
OBV Trendline Breaks: Some traders draw support/resistance or trendlines on OBV just like on price. A break in OBV trend can precede price trend break. For example, if price is in uptrend but OBV starts making lower lows (breaks an uptrend line), it could warn the uptrend is weakening.
OBV and Moving Averages: You can also apply a moving average to OBV (say a 20-day MA on OBV). Crossovers of OBV vs its MA might signal shifting momentum. For instance, if OBV crosses above its moving average, it might confirm a bullish shift in volume flow.
Filtering Trades: OBV can filter signals from other indicators. Suppose your strategy uses RSI for entry – you might require OBV to be sloping up as an extra filter to only take long signals when volume flow is supportive.
Divergence Plays: As a standalone trade signal, bullish or bearish divergences on OBV often justify a counter-trend trade. Many trading books advise combining OBV divergence with other clues (like candlestick patterns or oversold/overbought conditions) for higher probability. For instance, a bullish OBV divergence + a double bottom pattern on price + high volume spike on the second low might give you confidence to go long.
Keep in mind: no indicator is perfect. OBV can sometimes give false signals, just like any other tool. For example, OBV might show a divergence, but external factors or news could invalidate it. Or OBV might flatline during a strong trend because volume is steady, not giving much clue – yet the trend continues. Thus, OBV is best used in conjunction with other analysis (price action, support/resistance levels, etc.) to build a complete picture.
Advantages and Limitations of OBV
Advantages:
Simplicity: OBV boils down complex volume-price dynamics into an easy-to-read line. It’s straightforward even for beginners to plot and understand (volume up vs down).
Leading Indicator Potential: OBV is often considered a leading indicator – it can signal moves before price confirms. As discussed, divergences can tip you off early. It’s less lagging than something like a moving average because it’s directly reactive to daily volume.
Works Across Markets: OBV was invented for stocks but translates well to crypto, futures, etc., because volume is a universal concept. In highly speculative crypto markets, OBV can sometimes cut through noise by focusing on what the big money might be doing (accumulating or distributing).
Great for Trend Trading: It helps you judge if a trend is healthy. Many trend traders use OBV to avoid head-fakes – e.g., don’t short an uptrend if OBV keeps rising (smart money still buying), or don’t trust a rally if OBV is falling.
Limitations:
False Signals & Whipsaw: OBV can generate misleading signals, especially in choppy, range-bound markets. Volume spikes caused by non-directional events (like a big news candle that ultimately closes flat but with huge volume) can jerk OBV around without a clear price trend change. Also one big volume day can skew OBV for a while even if it was an anomaly.
No magnitude of price change: As noted, OBV doesn’t consider how much price moved, just direction. Thus, if price has a marginal new high on huge volume vs a significant new high on moderate volume, OBV might not distinguish – it treats both as positive volume. This can occasionally mask subtleties. Other indicators like Accumulation/Distribution (A/D) line try to account for how close the close is to the high/low (we’ll discuss A/D in comparison shortly).
Subjectivity in Interpretation: Identifying divergences or trend confirmations has an element of art. Two traders might draw different trendlines on OBV or define the divergence window differently. There’s also the need to confirm OBV signals with context – not all divergences lead to big moves; some just resolve with a minor pause.
Whale/Exchange Activity Distortions: In crypto, volume data can sometimes be irregular. For example, if an exchange experiences a flood of wash trading or one whale moves a large amount on-chain, OBV could spike without a proportional price move. Since crypto markets run 24/7 across many exchanges, volume data quality matters. Usually, when we chart OBV on something like TradingView for a crypto pair, it’s using exchange volume for that pair. Watch out if the volume includes unusual spikes (maybe due to an exchange outage or error) – OBV will incorporate that.
A specific crypto limitation: fake volume on some exchanges could theoretically make OBV less reliable if you’re using data that isn’t clean. Sticking to major exchanges or aggregated reliable volume is advisable.
Altogether, OBV remains a popular and useful indicator in crypto trading, especially for those who value volume analysis. It tends to be most powerful during transitions – helping sniff out when a trend is building strength or losing it, beyond what price alone shows.
OBV vs Other Volume-Based Indicators
How does OBV compare to other volume indicators? Let’s briefly compare a few:
Accumulation/Distribution (A/D) Line: Created by Marc Chaikin, A/D weighs volume by the closing price's position within the day's range, addressing OBV's limitation of not considering magnitude. While A/D can provide nuanced signals, it might be slower and oversensitive to daily price fluctuations. OBV, being binary, offers clarity. Both often give similar signals, but discrepancies can arise in volatile intraday swings.
Volume Price Trend (VPT or PVT): VPT adjusts volume against percentage price changes, confirming trends like OBV but is more sensitive to large price moves. It can highlight divergences that OBV might miss, making them complementary tools.
Money Flow Index (MFI): Essentially RSI combined with volume, MFI gives overbought/oversold readings on a scale of 0–100. Unlike OBV, which focuses on trend analysis, MFI provides clear numeric thresholds.
Volume Oscillators (like Volume Oscillator, VO): These compare short-term and long-term volume averages. While they indicate volume surges, they don’t link volume to price direction like OBV does.
VWAP (Volume Weighted Average Price): VWAP serves as an intraday price benchmark, distinct from OBV's focus on volume trends.
In summary, OBV’s unique strength is its simplicity and clear narrative of volume flow. Many other volume indicators attempt to refine the concept, but OBV remains hugely popular – if not for primary signals, as a secondary confirmation tool for a lot of trading systems.
Real-World Chart Example and Trading Scenario
Let’s put it all together with a hypothetical (but realistic) trading scenario in crypto:
Scenario: You’re analyzing Cardano (ADA) which has been in a downtrend but seems to be basing around $0.25. You notice that over the past few weeks, price tested $0.25 twice and held. The second test even dipped slightly lower to $0.24 but quickly bounced back. On the price chart, it looks like a possible double bottom forming. You pull up OBV on the daily chart. You see that at the first $0.25 low, OBV was at say 1.2 million. At the second low, price went to $0.24 (lower low), but OBV is now at 1.25 million – higher than before. So OBV made a higher low while price made a lower low – a bullish divergence. In addition, OBV has started ticking up even when price is still flat between $0.25–$0.30.
This catches your attention. It suggests that despite Cardano’s weakness in price, significant accumulation might be happening at these lows – volume on up days (maybe minor up days during the base) outweighed volume on the sell-off days. Essentially, strong hands could be buying the dip.
To further strengthen the case, you check a shorter timeframe (4H OBV) – perhaps you see OBV there also showing an uptrend while price is in a tight range, confirming incremental buying pressure.
You decide this is a good opportunity to go long, anticipating a trend reversal upward. You enter a position around $0.28, with a stop loss under $0.24 (just below the recent low). Your target could be the next resistance around $0.38 or higher, depending on how far you think a reversal can go.
Sure enough, a week later, positive news hits or simply the market turns, and ADA’s price breaks above $0.30. OBV leaps as volume pours in on the breakout, confirming the move. The price rallies to $0.37. OBV is now significantly higher than at the base – everything looks solid. You might trail your stop or take partial profit.
Eventually, at $0.38-$0.40, you notice something concerning: price makes a new swing high, but OBV doesn’t make a new high. In fact, OBV started to flatten out even as price pushed that last leg. This bearish divergence on a short-term scale signals the move might be ending. Combining that with the fact $0.40 is a known resistance, you decide to exit most of your position. Shortly after, ADA pulls back to $0.33 – a successful trade guided in part by OBV signals at entry and exit.
This story highlights how OBV can be a two-way tool: first to spot a bullish divergence entry, then to spot a bearish divergence to warn of exit. It also shows how OBV works best in context of support/resistance and patterns (double bottom + OBV divergence was the confluence here).
Conclusion
The On-Balance Volume (OBV) indicator embodies the principle that "volume leads price." In the volatile crypto market, where sentiment can shift quickly, OBV reveals important volume trends that price alone may overlook.
A rising OBV signals accumulation and confirms uptrends.
A falling OBV indicates distribution and confirms downtrends.
Divergences between OBV and price can precede major reversals.
To use OBV effectively, combine it with sound trading practices like chart patterns and support/resistance levels. For example, an OBV bullish divergence at a long-term support level is more reliable than one in isolation. Always consider the broader market context, as volume can be influenced by events such as news or exchange outages.
Practicing reading OBV on various charts helps you understand the volume story. This indicator is particularly valuable in the crypto market, known for its retail-driven volume and the behavior of "crypto whales." While OBV’s simplicity is a strength, it can be supplemented with other indicators for deeper insights. However, many traders find OBV, in conjunction with price action, offers a strong tool for market analysis.
Next time you assess a coin, remember to examine the OBV line; it can reveal accumulation or distribution ahead of significant price movements. As the saying goes, “Volume is the fuel that drives the market,” and OBV helps gauge that fuel.
Looking to put your newly gained knowledge of the OBV indicator into action? Phemex is a secure and user-friendly exchange where you can buy, sell, and trade a wide range of digital assets. With advanced trading tools, low fees, and robust security, Phemex empowers both beginners and experienced traders to navigate the crypto markets with confidence.