
One of the most popular trading indicators used across all markets are Bollinger band (BB) indicators, which were developed by John Bollinger, a well-known trader in traditional markets. They have become one of the most widely used technical analysis tools for traders across all asset classes. These bands are designed to measure the volatility of a market and help traders identify overbought or oversold conditions, along with potential breakout opportunities. Unlike other indicators that focus on price trends, Bollinger Bands focus on market volatility by creating a dynamic boundary around a moving average, which adjusts in real-time based on market conditions.
The Bollinger band consists of three lines, one of which most traders are already quite familiar with — the 20-period simple moving average (SMA). The exterior lines that envelope this indicator are the standard deviation bands, which by default represent two standard deviations above and below the 20 period SMA. Understanding how Bollinger Bands work and how to use them can greatly improve a trader’s ability to anticipate price movements and react appropriately to changing market conditions.

What Are Bollinger Bands?
Bollinger bands may seem quite complex, in essence, they are trading tools used for the technical analysis of investment assets. They are utilized by traders to make an informed prediction on what the price might do next — something which can help determine their trade. Bollinger bands focus on the standard deviation of an asset’s value, as well as its moving average value.
The Bollinger band formula is as follows:
-
Simple moving average (SMA): The bands’ central component is the moving average value of the asset over a pre-determined period (usually 20 periods).
-
Standard deviation bands: The two lines that border either side of this central line are the measurements of the asset’s standard deviation in price — one being the lowest and the other being the highest. These two bands work as the Bollinger band’s parameters, with the distance between them being known as the Bollinger band width.
Bollinger bands work best when the middle band, or SMA, reflects the intermediate term trend, as in this way the asset’s trend is combined with the asset’s relative price information.
What Is The Bollinger Bands Formula?
Without having a thorough grasp of the core components of BB, it is impossible to know how to read Bollinger bands, or look at Bollinger band trading, or understand how to use Bollinger band trading strategies. Thus, to ensure a full understanding of the Bollinger band’s formula, a definition for each of the components can be found below.
-
Simple Moving Average
The very core and central component of a Bollinger band is the simple moving average (SMA).
This moving line is a calculation of the average trading price of an asset over a period of time — usually 20 periods. This means that the closing price of the asset is taken over the last 20 periods (this can be days, hours, minutes, or others, depending on the trading period being looked at) and then divided by the total number of periods — in this case 20.
-
Bollinger Bands Standard Deviation
The second part of a Bollinger band is the standard deviation (SD) — two bands depicting the typical price deviation from the mean value of an asset. A low standard deviation indicates that the values tend to be close to the mean of the asset’s value. A high standard deviation indicates that the values are spread out over a wider range.
Typically, the Bollinger band standard deviation of an asset’s value will fall within two standard deviations from the mean value of the asset. To be precise, according to the Empirical Rule, 68% of the values will fall within one standard deviation while 95% will fall within two standard deviations.
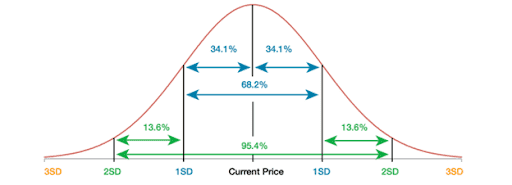
Bollinger band settings mean that a trader can set the two outer bands to two standard deviations either side, or to another number — for the reason above, however, most traders will set them to two standard deviations. The price will move up and down between these two standard deviations (and thus between the two outer bands of the Bollinger band) while crossing over the central line of the band — the SMA.
Bollinger Bands Calculation
In its default form, Bollinger bands standard deviation are set to 2 SD, but a trader can increase or decrease this by setting them to capture more or less of the target values. Traders can also change the moving average settings if they wish to, although the standard is to set it to 20 periods.
How Do Bollinger Bands Work?
It is no good knowing what components a Bollinger band has if a trader does not know how to read Bollinger bands nor understands how this indicator works. Reading Bollinger bands is simple:
-
If the SMA is beginning to incline upward, then the price may be turning bullish.
-
If the SMA is beginning to take a downward turn, then the price may be turning bearish.
-
If the price fluctuation heads toward the upper limit of the top Bollinger band standard deviation, then, since 95% of the price fluctuations will fall within 2 SD, the trader can assume that the price is likely to fall.
-
The same goes vice-versa. If the price fluctuation is about to hit the bottom Bollinger band standard deviation line, then the trader can assume that the price may soon rise.
This is why Bollinger bands are some of the most popular trading indicators — not only are they simple to read, but they are essentially two indicators in one.
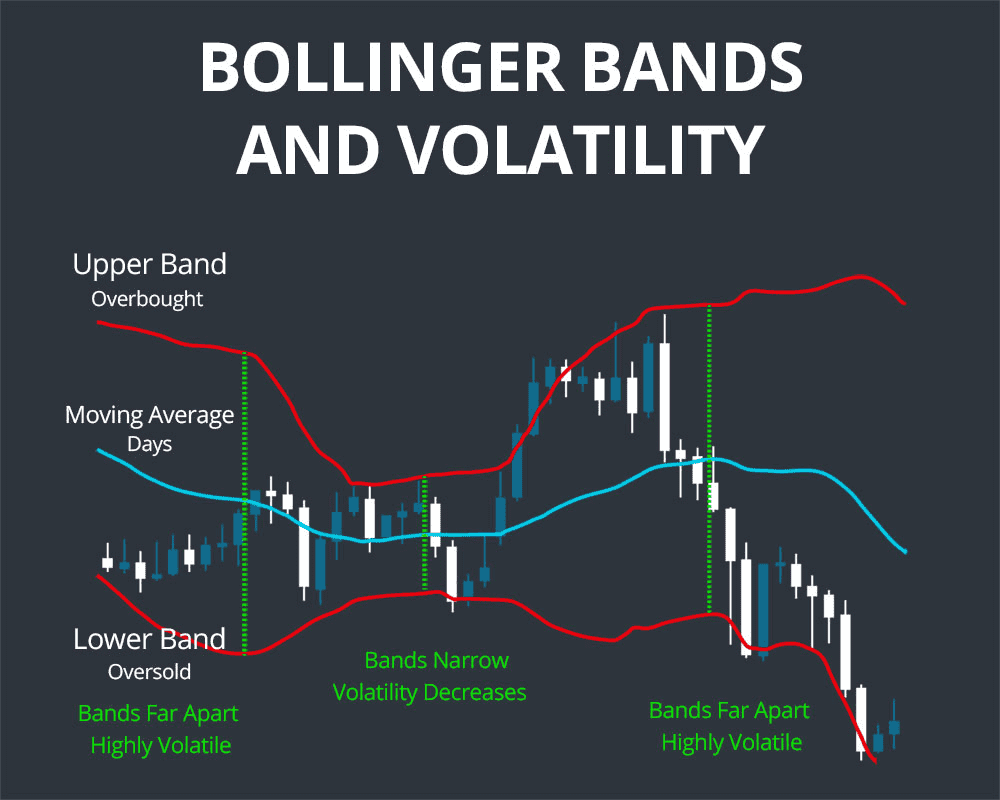
Additionally, the standard deviation bands can indicate volatility and price breakouts:
-
Wide Bollinger bands: In periods of high volatility, the two outer bands will widen to allow space to incorporate most of the price range. This widening Bollinger band is therefore indicative of high price volatility.
-
Narrow Bollinger bands: In periods of low volatility, the two outer bands will narrow to contain the price range. This narrowing Bollinger band is therefore indicative of low price volatility. When a price goes into a bottleneck, with wide outer Bollinger bands followed by a narrowing of these Bollinger bands, this can be indicative of a price breakout.
Bollinger Bands and Price Action
Traders can interpret the movement of price within and around the bands to make predictions about future price action. The most common strategies that utilize Bollinger Bands focus on the behavior of the price relative to the bands, particularly when it touches or breaches the bands. Here are some key insights:
-
Overbought and Oversold Conditions:
-
Upper Band Touch: When the price reaches the upper band, it suggests that the market may be overbought, or at least that the price has moved too far, too quickly. A pullback could be imminent.
-
Lower Band Touch: When the price hits the lower band, it suggests the asset might be oversold. This could present a buying opportunity if the price is expected to revert to the mean (the SMA).
-
However, touching or breaching the bands does not automatically mean a reversal is coming. These levels often signal potential turning points but require confirmation through other indicators or price action.
Bollinger Bands Trading Strategy
Although Bollinger bands are used in many trading systems, traders most commonly use them to spot mean reversion opportunities and changes in volatility.
1 Use the Bollinger Bands to spot mean reversion trading
For mean reversion trading, Bollinger bands are best used when the price is exhibiting a vast ranging behavior. The idea behind this strategy is that, over time, the price tends to return to the average price. With this strategy, the upper and lower bands act as the dynamic support and resistance levels. When the price ranges and moves either to the top band or the lower band, traders can look for signs that the move is either becoming exhausted or being absorbed, meaning that it is likely to return to the average price. In simpler terms, if the price is approaching the lower SD band, it’s likely to rise and return to the average price — meaning that traders may want to go short on their trade. If the price is approaching the higher SD band, it is likely to take a downturn and return to the average price — meaning that traders may want to go long on their trade. This method is best applied when the bands are not widening, instead remaining fairly stable and thus showing low volatility.
In ranging conditions, the price is accepted within a range of values, which can lead to great risk-to-reward opportunities as there is a bigger range between the highs and the lows. When the price approaches an extreme of what these normal values are, as long as the trader operates under the assumption that the range is to continue and the conditions are to persist in the same way as they have been, there is good opportunity for profit.
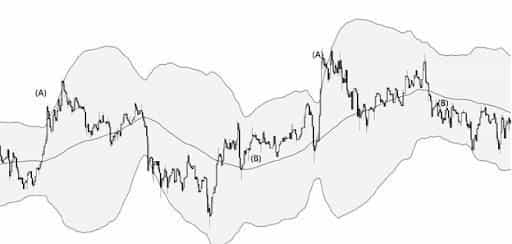
There are plenty of strategies that traders can experiment with using this method:
(A)-One might be to look for three drives into the highs or lows to look for trading opportunities back to the mean.
(B)-Another might be to play the successful crosses and retests of the mean with the intention of taking a move back to an extreme.
2 Using Bollinger Bands To Spot Changes in Volatility
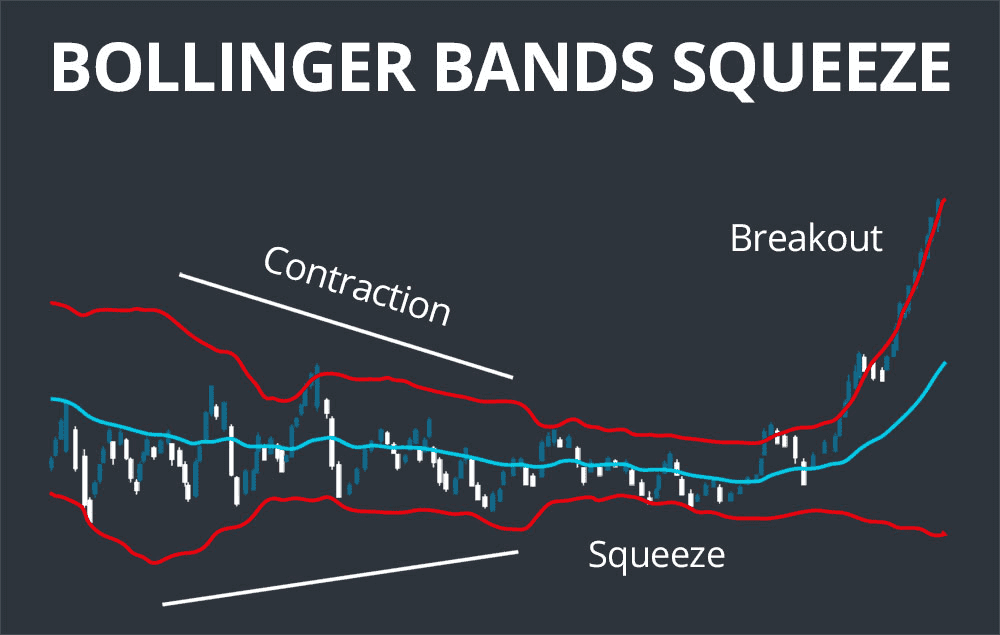
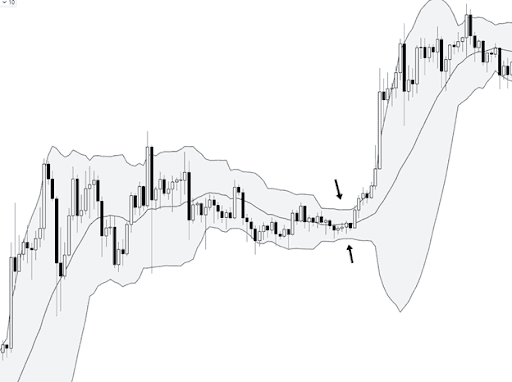
One other popular use for Bollinger bands is to spot changes in volatility. Specifically, the type of compression that occurs before breakouts or continuation. In markets, compression usually leads to expansion and then back to compression again — a pattern that if a trader knows how to exploit can lead to great returns. One thing that we can look for to potentially time or spot periods that precede breakouts, are areas where the Bollinger bands begin to compress or bottleneck.
3 What is Bollinger Squeeze
Often, when a market is trending, the Bollinger Bands will remain expanded, and the consolidations that occur during the trends will lead back to compressions. Spotting the bottlenecking can allow a trader to position themselves properly in the tightest area, offering a superior location to define risk and place a stop. This can be especially useful for breakout traders. Identifying this behavior can also allow a trader to prepare themselves for a volatility squeeze if they are already in a position.
Types of Bollinger Bands
In addition to standard BB indicators, there are also other types of Bollinger bands:
-
Bollinger bands width (BBW) indicators: Put simply, the BBW indicator is the difference between the upper and lower SD bands of the BB indicator, divided by the middle SMA band. The BBW indicator provides a simple way to visualize the consolidation of price (narrow Bollinger band standard deviation) before price movement or periods of high volatility (wide Bollinger band standard deviation).
-
The Bollinger band width calculation is: (upper BB – lower BB)/ middle BB
-
-
Bollinger band percent B, or percentage bandwidth (%B):Introduced by the BB indicator creator, John Bollinger, in 2010 (nearly three decades after the BB indicator), the %B indicator considers the relationship between price and the upper and lower SD Bollinger bands. In total there are six basic relationships that can be quantified — from %B above 1, which indicates that the price is above the upper band, to %B below 0, which indicates that the price is below the upper band.
-
The %B calculation is: (current price – lower band)/(upper band – lower band)
-
The best thing to do with any of these indicators, as with all indicators, is to experiment with them. Try them across both the lower and the higher timeframes, with both default and modified settings. This can be helpful to beginners, as generally speaking, the higher the timeframe you are in, the stronger the signals tend to be. Bollinger band charts are free on Phemex, meaning that novice traders can easily learn how to trade Bollinger bands. Read on to find out how.
What to Keep in Mind When Trading Bollinger Bands
Common Mistakes When Using Bollinger Bands
While Bollinger Bands are effective, many traders make mistakes when interpreting the indicator. Here are some common pitfalls:
-
Misunderstanding Breakouts: Breakouts from the bands are not always profitable, especially in volatile markets. Traders should wait for confirmation before making trading decisions. A breakout is not a guarantee of sustained momentum.
-
Ignoring Trend Direction: Bollinger Bands work best in trending markets. In sideways or range-bound markets, prices may bounce off the bands repeatedly. A clear trend should be in place before using breakouts or trend-following strategies.
Advantages of Bollinger Bands
-
Dynamic Volatility Measurement: Bollinger Bands adapt to market volatility, providing a clearer picture of price action than static support and resistance lines.
-
Ease of Use: They are easy to apply to any asset and timeframe. Traders of all experience levels can use Bollinger Bands to assess market conditions and make informed decisions.
-
Multiple Strategy Applications: Bollinger Bands can be used in various strategies, including range-bound and trending markets. They allow traders to identify entry points, exits, and potential reversal zones.
Limitations of Bollinger Bands
-
False Signals in Highly Volatile Markets: Bollinger Bands may give false signals in volatile markets. When price moves sharply in one direction and remains outside the bands, it does not always result in a reversal. In such cases, additional indicators should be used to confirm the trend.
-
Not Suitable for All Market Conditions: Bollinger Bands are most effective in range-bound or trending markets but may not be as useful in sideways markets where the price doesn’t form clear trends.
-
Lagging Indicator: Like all moving averages, Bollinger Bands are lagging indicators, meaning they are based on historical price data. As such, they cannot predict future price movements with certainty.
How to use the Bollinger Bands (BB) Indicator on Phemex?
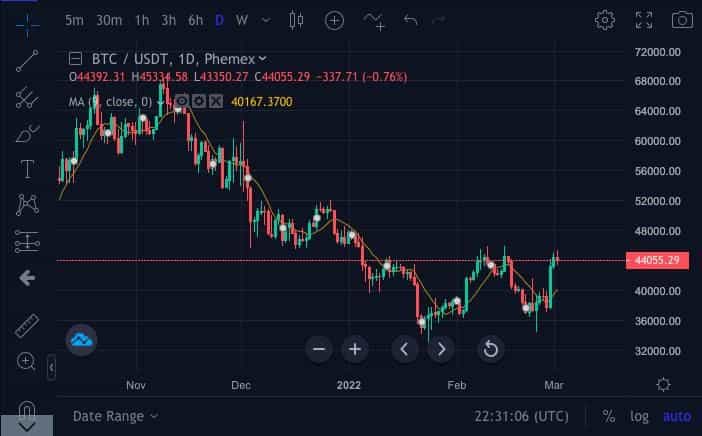
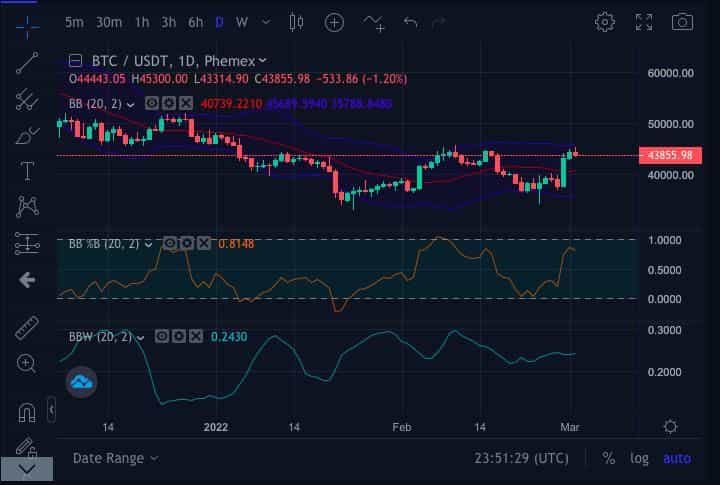
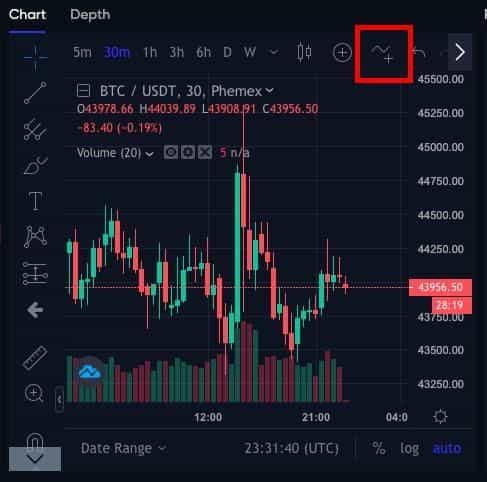
The Bollinger band indicator is a free indicator available to all Phemex users under all trade pairs. To use the BB indicator on Phemex, open your favorite trading pair. For this demonstration, we’ll use the most traded BTC/USDT pair:
-
Click on “Indicators” at the top of the chart and a new window will pop up.
-
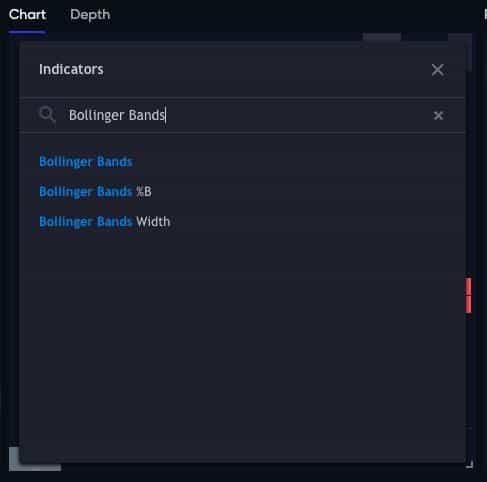
Input “Bollinger Bands,” “Bollinger Bands %B,” or “Bollinger Bands Width” in the search bar and you will find the indicator:
-
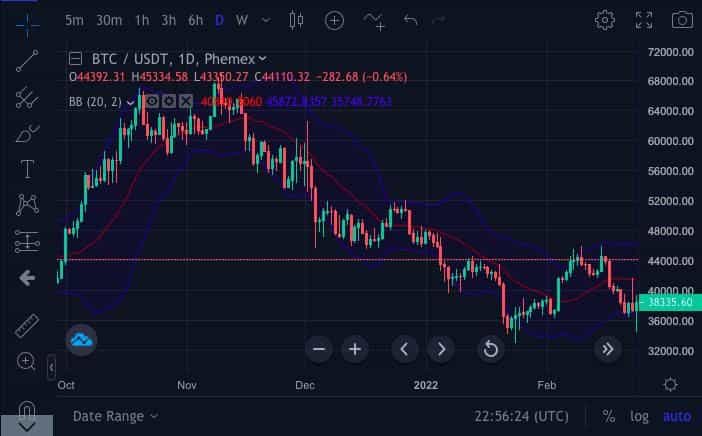
Click on the indicator and then press the “x” button to return to the chart. The Bollinger band will have been added to the chart. In this example, we are using the daily chart for the Bollinger band indicator. If we switch to any other time on the chart, the indicator will adjust accordingly. The time frame can be selected on the top left of the chart.
-
You can now practice your trading analysis using the BB indicators.
Conclusion
Bollinger bands are an excellent trading tool that should be understood and used by any trader — whether novice or pro. BB indicators can be used to understand which way the market is going, analyze volatility, and predict breakouts. However, as with all indicators, traders should not solely rely on one indicator, or even all three types of Bollinger band, to make their analysis. Traders should do their own research and use the multiple free tools at their disposal on platforms such as Phemex to ensure they are in a suitable position before making a trade. Using Bollinger Bands in conjunction with other technical analysis tools like RSI or MACD can help increase the accuracy of trading signals and enhance decision-making. While there are limitations, including potential false signals in volatile markets, Bollinger Bands remain a powerful and flexible tool for any trader looking to gain insight into price movements and volatility.
Check out our additional technical analyses to improve your Crypto Trading Skills
For any inquiries contact us at support@phemex.com
Trade crypto on the go: Download for iOS | Download for Android
Phemex | Break Through, Break Free
Read More
- What is Keltner Channel: Best Alternative to Bollinger Bands for Bitcoin (BTC)
- Standard Error Bands (SEB): Measure Trend Volatility for Advanced Trading
- What is RSI: How To Trade Bitcoin With The RSI Indicator
- How to Read Crypto Charts: Learn Trading Chart Patterns
- The TTM Squeeze Indicator: What Is It and How to Use It?
- Crypto Price Action Trading Strategy
- The 8 Most Important Crypto Candlestick Patterns
- TradingView: What Is It and How to Use It to Trade with Phemex