

Summary
-
Hidden divergence is the opposite of regular divergence, where the indicator action makes higher highs or lower lows while the price makes lower highs or higher lows, respectively.
-
Bullish hidden divergence occurs when the value of an asset makes a series of higher lows and at the same time, the indicator makes a series of lower lows.
-
Bearish hidden divergence happens when its price action forms progressively lower highs in the presence of progressively higher highs developed by the indicator.
Divergence is a forex trading strategy regularly used by currency and cryptocurrency traders worldwide. It refers to the disagreement between the momentum indicators or oscillators, and the price. Commonly used indicators include relative strength index (RSI), stochastics, and moving average convergence/divergence (MACD). In a regular divergence, price makes higher highs or lower lows while an oscillator makes lower highs or higher lows, often signaling a potential trend reversal. In a hidden divergence, price makes a lower high or higher low while the oscillator makes a higher high or lower low, indicating the prevailing trend may continue.
What Is Divergence?
In day trading, divergence helps traders recognize and react approximately to price trends. Divergence refers to the price and momentum being out of sync, meaning that there’s a higher potential for a correction or reversal. The value of an asset can only diverge up to a certain extent before a major price swing occurs and it returns to what the market believes it should be worth.
There are two types of divergence:
-
Regular/Classic divergence, which happens when the price trend creates higher highs or lower lows while the indicator makes lower highs or higher lows, respectively.
-
Hidden divergence, which is the opposite of regular divergence, where the indicator action makes higher highs or lower lows while the price makes lower highs or higher lows, respectively.
Regular divergence is especially useful to cautiously predict the end of a trend, while hidden divergence can be used as an indication of trend continuation.
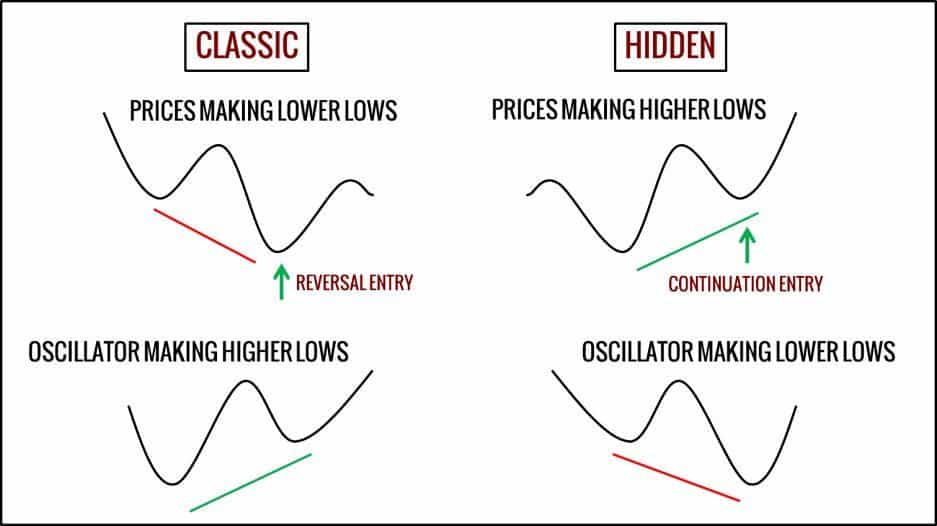
Differences between regular and hidden divergence (Source: Trading Setups Review)
What Is Hidden Divergence?
What is a Bullish Hidden Divergence?
What is a Bearish Hidden Divergence?
How to Identify Hidden Divergence?
Use the RSI indicator and the MACD indicator to identify hidden divergence
One of the most reliable indicators is the RSI. In short, the RSI compares the average gain and the average loss over a certain time frame. This indicator is commonly used to identify overbought and oversold conditions in the market.
The next popular indicator is the MACD, which basically shows the relationship between two moving averages of an asset’s price. The divergence signals produced by the MACD usually resemble those produced by the RSI.
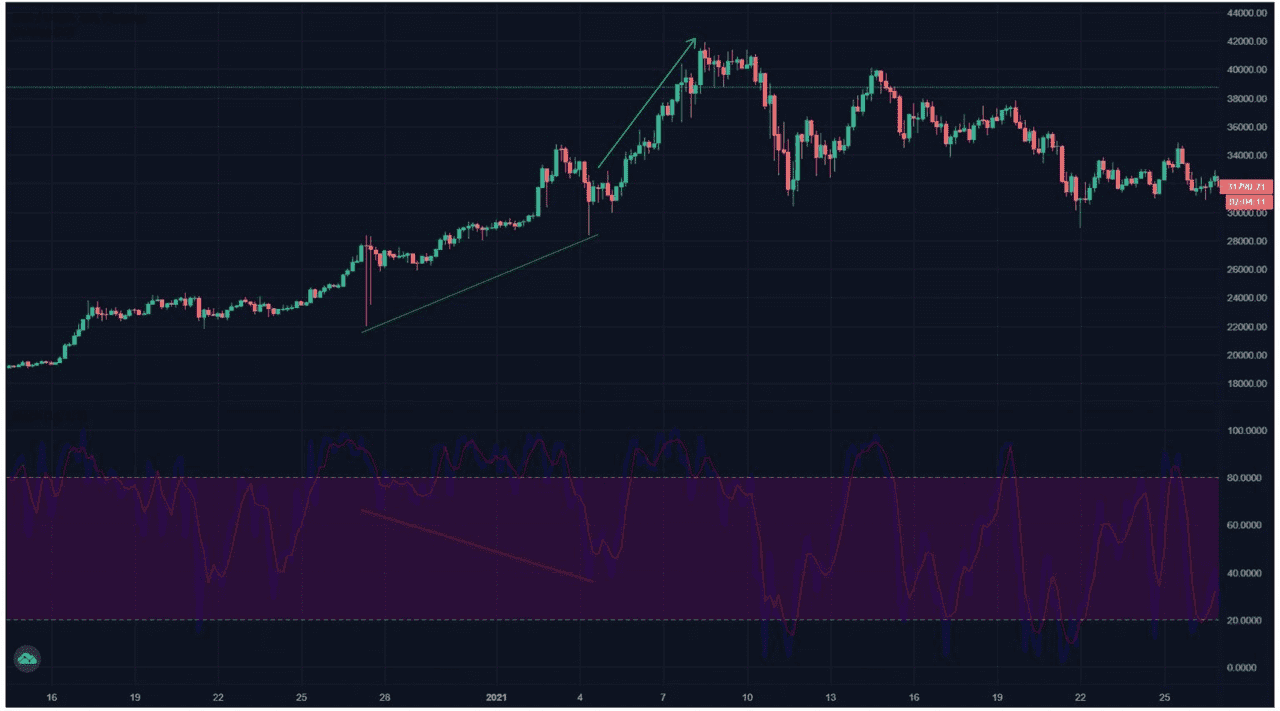
The figure below shows an example of a bullish hidden divergence identified using the MACD and RSI. From the figure, the price chart shows consecutive higher lows while the MACD and the RSI show successive lower lows.
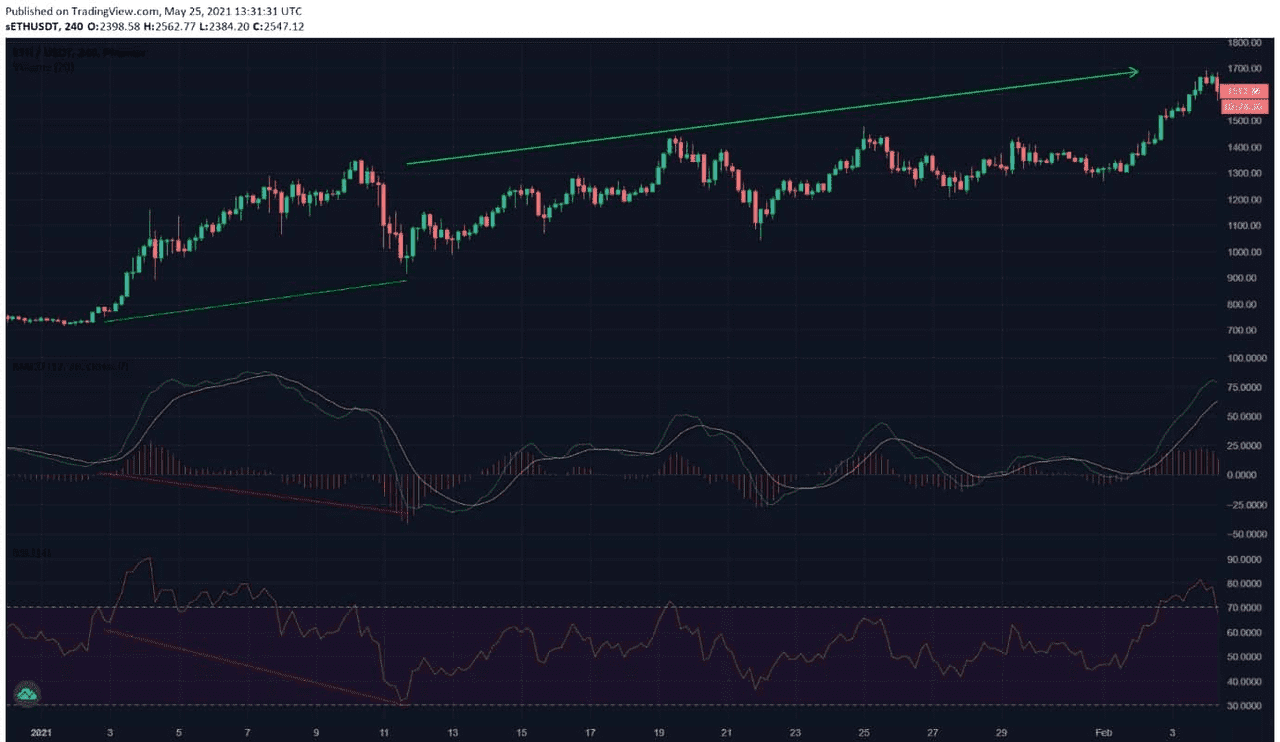
Bullish hidden divergence identified from an Ethereum price chart from January 1, 2021 to February 3, 2021, 4h time frame with the MACD and the RSI (Source: Phemex, TradingView)
Use the stochastic oscillator to identify hidden divergence
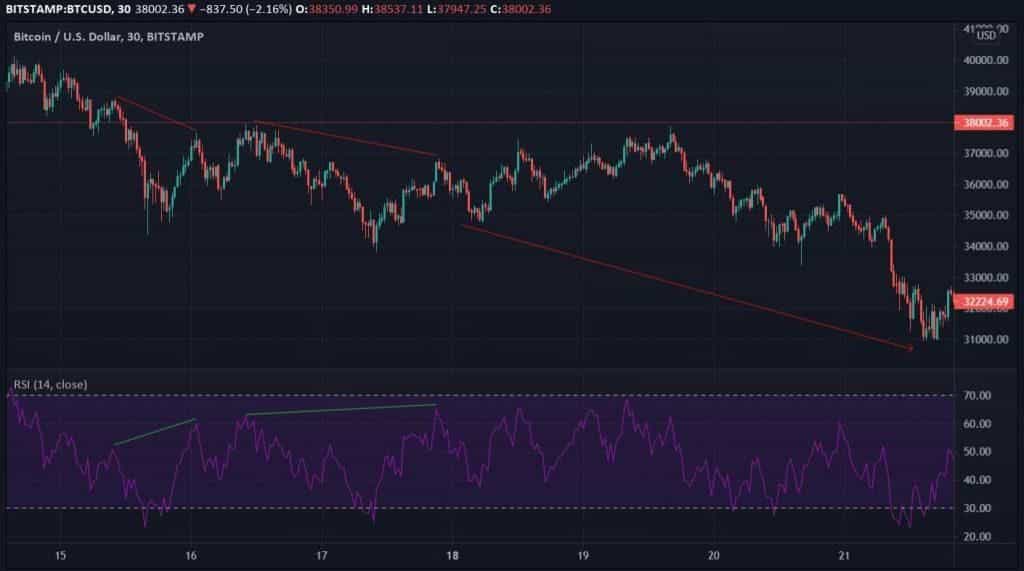
Another common indicator is the stochastic oscillator, which was first introduced by George Lane in the 1950s. This oscillator is mainly used to compare an asset’s closing price to a range of its prices over a certain time span. In the figure below, the stochastic oscillator is used to identify a bearish hidden divergence. The figure shows that the price chart has progressively lower highs while the stochastic oscillator has consecutive higher highs.
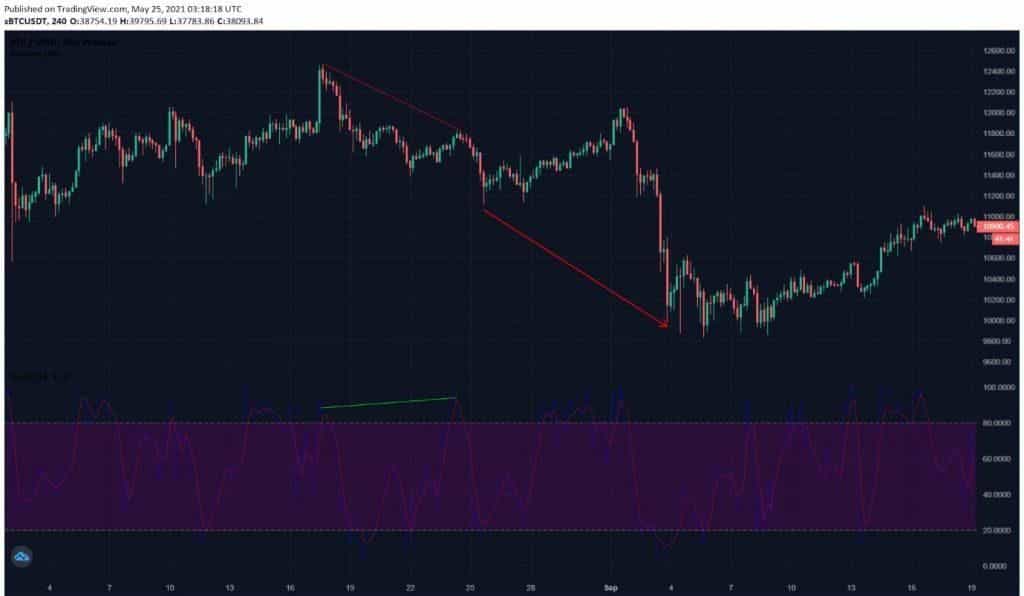
Bearish hidden divergence identified from a Bitcoin price chart from August 4, 2020 to September 19, 2020, 4h time frame with stochastic oscillator (Source: Phemex, TradingView)
Using Indicators to Spot Hidden Divergence
The choice of indicator can vary, but the concept remains the same. Leading indicators like RSI and Stochastic are popular for spotting divergence because they react quickly to price changes and oscillate within known ranges.
-
RSI (Relative Strength Index): RSI measures recent gains vs losses to indicate if an asset is overbought or oversold. It’s handy for divergence trading. For hidden divergence, traders watch RSI’s lows and highs relative to price. In a bullish hidden divergence, you’d see RSI register a lower value even as price makes a higher low, implying weakening momentum that belies the price’s resilience. In a bearish hidden divergence, RSI would peak higher even as price’s bounce is lower than the previous high. RSI divergence signals often precede price action, giving an early warning.
-
MACD (Moving Average Convergence Divergence): MACD is a combo of two moving averages and a histogram that shows their difference. It’s somewhat a lagging indicator but can also highlight momentum shifts. MACD divergences typically mirror RSI divergences. Traders using MACD will look at the histogram or the MACD line lows/highs for divergence with price. Hidden divergences on MACD can confirm what RSI shows, since both often give similar divergence signals. For example, a bullish hidden divergence might show MACD histogram making a deeper trough even as price’s trough is higher, suggesting the pullback is losing steam and the uptrend will resume.
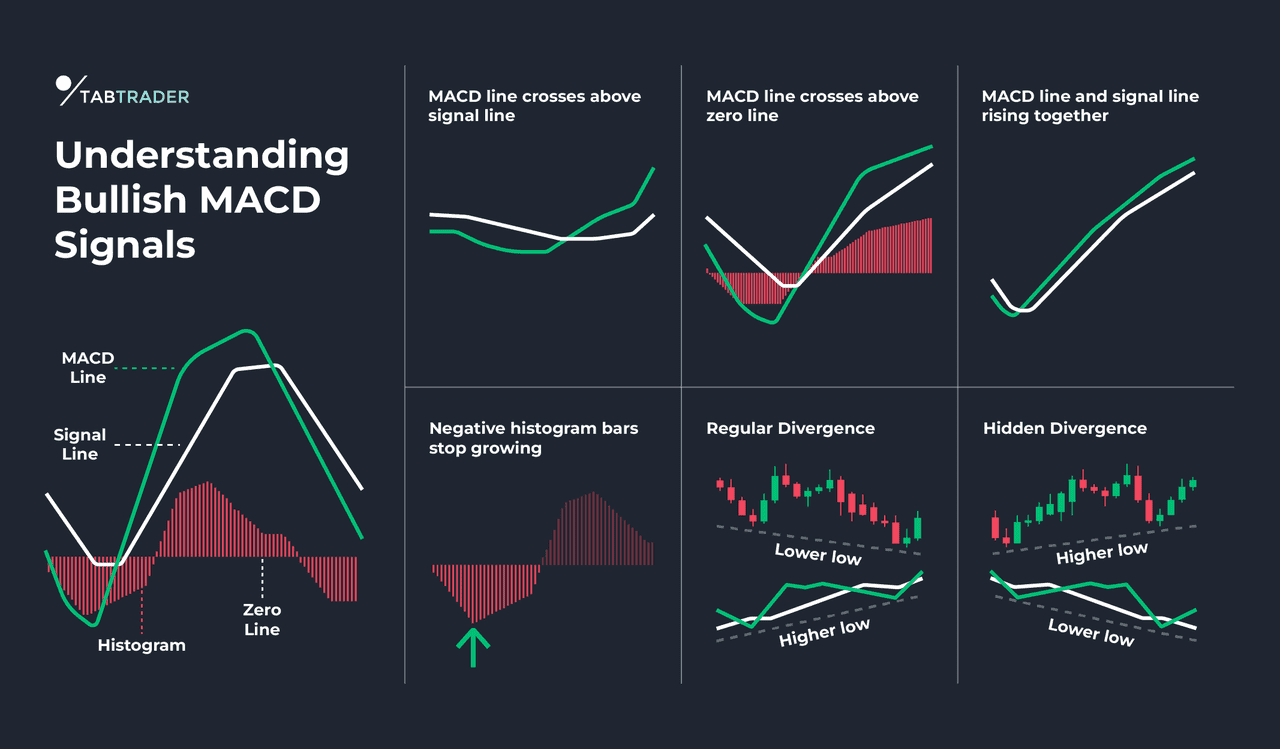
MACD and Hidden Divergence (source)
-
Stochastic Oscillator: The stochastic measures where price closes relative to its recent range, and it’s another oscillator useful for divergence. It tends to be more volatile. A hidden divergence using stochastics might look like this: in a downtrend, stochastic peaks at, say, 80 on a minor rally, after peaking at 70 on the previous (higher) rally – that’s a higher high in the oscillator against a lower high in price, a bearish hidden divergence signal. The stochastic oscillator example is illustrated by Phemex in a Bitcoin chart: as Bitcoin’s price formed progressively lower highs in Aug–Sep 2020, the stochastic indicator made higher highs, marking a bearish hidden divergence and foreshadowing continuation of the downtrend. On the flip side, an uptrend with stochastic forming lower lows while price makes higher lows indicates a bullish hidden divergence.
Each indicator might give slightly different signals at times, so some traders use multiple indicators for confirmation. For instance, if both RSI and MACD show a bullish hidden divergence at the same time on a 4-hour chart, that’s a stronger confirmation to buy than just one indicator alone.
Key Tip: Hidden divergences are often more reliable on higher time frames (e.g. 4-hour, daily) compared to very short intervals. On longer time frames, market noise is reduced, and the patterns of highs and lows are clearer, leading to more significant divergence signals. The trade-off is you’ll get fewer signals on a daily chart than on a 5-minute chart, but they may be more meaningful. On very short time frames, you might even encounter conflicting signals – it’s possible to see a regular divergence and a hidden divergence simultaneously in choppy markets (e.g., a bullish regular divergence and a bearish hidden divergence at the same time). This can be confusing, so choosing the right time frame and focusing on obvious, well-formed divergences is important for success.
How to Trade Hidden Divergence
Rule 1: Look for the “Four Price Scenarios”
For a hidden divergence to exist, the price trend must have formed one of the following:
-
Higher low than the previous low
-
Lower high than the previous high
One of these four scenarios must occur in the price action before it makes sense to check the indicator signal. The first two scenarios are self-explanatory and were shown previously in the bearish and bullish hidden divergence. The double top and double bottom are patterns that form due to movements in the value of an asset. In short, a double top pattern forms the letter “M” while a double bottom forms the letter “W.” The peaks and troughs of the price chart do not necessarily need to reach the same points for the double top and double bottom pattern to appear.
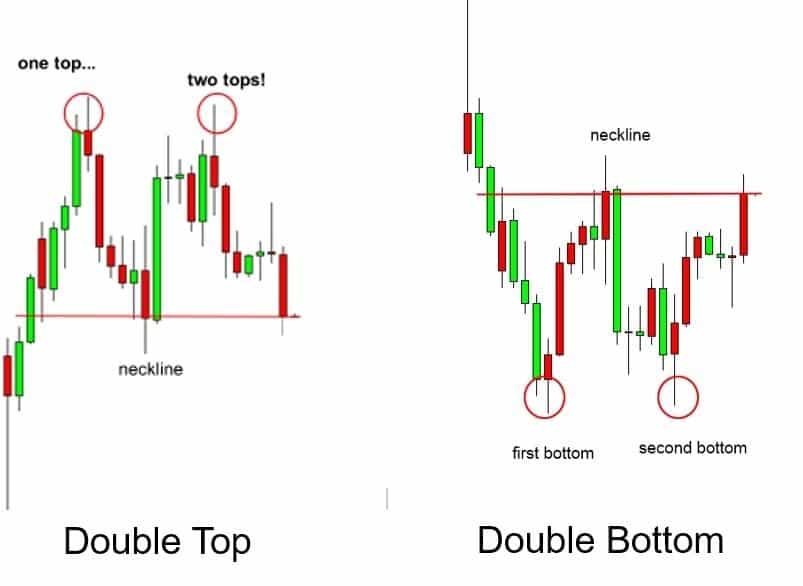
Double top and double bottom patterns. (Source: BabyPips)
Rule 2: Only Connect the Lows for Bullish Hidden Divergence
For bullish divergence, connect the lows on the price action and the lows on the indicator as well. As shown in the figure below, the lows on the price chart must vertically line up with the lows on the indicator.
For bullish hidden divergence, vertically line up the connected higher lows on the price chart with the connected lower lows on the indicator. (Source: Phemex, TradingView)
Rule 3: Only Connect the Highs for Bearish Hidden Divergence
For bearish divergence, connect the highs on the price chart and do the same to the highs on the indicator. As shown in the figure below, the highs on the price chart must vertically line up with the highs on the indicator.
For bearish hidden divergence, vertically line up the lower lows on the price chart with the connected higher highs on the indicator. (Source: TradingView)
Rule 4: The Gradient of the Line Hints at the Strength of the Divergence
Rule 5: Don’t Double Down on Divergence
How Reliable Is Hidden Divergence?
Although divergence is a powerful sign indicating a change in the direction of a market’s movement, it cannot be used in isolation. New traders should focus on regular divergence before incorporating hidden divergence into their trading practices.
Remember that divergence does not always result in a strong reversal. According to one analyst, divergence indicators sometimes are meaningless and cannot predict major price action changes.
Instead, the price may have just entered sideways consolidation after a divergence. A sideways trend or consolidation refers to the horizontal price movement where the price of an asset trades within a stable range. For that reason, it’s useful to combine trading strategies because the use of only one indicator cannot capture the whole market context. By using two or three indicators simultaneously, traders may form a more robust strategy to better define a trend and choose more appropriate reactions.
Sometimes, when using two or more different indicators, the indicator signals may differ from one another and imply different market conditions. In such cases, it’s best to take a step back and examine whether the conflicting signals are obvious and strong. If they are, it’s a good idea to stay away from the asset for the time being.
Tips on using the Hidden Divergence
Can a regular divergence and a hidden divergence occur at the same time?
On the other hand, in shorter time frames, there is a possibility that bearish regular divergence and bullish hidden divergence (or bullish regular divergence and bearish hidden divergence) may occur at the same time. Thus, it is important to choose a suitable time frame to maximize the profit potential and minimize confusion.
Remember that regular divergence signifies a change in the trend’s direction and should be traded at the end of the trend, while hidden divergence suggests strength coming into the trend and should be traded at the beginning of the trend. When trading divergence, there should be obvious ups or downs on the price chart for a trend that actually exists.
Conclusion
Hidden bullish and bearish divergences are powerful tools for traders to capitalize on trend continuations. They allow you to enter or stay in trades at points where others might mistakenly see a reversal. To recap, a bullish hidden divergence (higher low in price, lower low in oscillator) suggests an uptrend will resume, and a bearish hidden divergence (lower high in price, higher high in oscillator) suggests a downtrend will continue. These signals, confirmed with indicators like RSI, MACD, or Stochastics, can provide high-quality trade opportunities.
However, like all strategies, divergence trading should be practiced with sound risk management and realistic expectations. Divergences do not guarantee profits – they are warnings or indications, not certainties. The market could always behave differently due to unforeseen news or simply because no method is 100% predictive. New traders are often advised to get comfortable with regular divergences (reversal signals) before moving on to hidden divergences, as the latter can be a bit more advanced in spotting and timing.
In 2025, with crypto markets as dynamic as ever, divergence strategies remain very relevant. Many professional traders continuously use them in combination with other techniques to navigate Bitcoin and other cryptocurrency price swings. By understanding the nuances of hidden divergence and practicing identifying them on historical charts, you can improve your timing for trend trades. Always remember to consider the larger trend, use confirming tools, and manage your risk. If used wisely, hidden divergences can be a valuable addition to your trading arsenal – helping you “buy the dip” in a bull run or “sell the bounce” in a bear market with greater confidence that the primary trend will reassert itself.