

Summary
-
The Relative Strength Index (RSI) is a trading indicator that measures the momentum and rate of speed at which the price of an asset is moving at.
-
RSI Calculations: RSI Value >70% = Overbought, RSI Value <30% = Oversold
The Relative Strength Index (RSI) helps to measure the momentum and rate of speed at which the price of an asset such as Bitcoin (BTC) is moving. The RSI crypto indicator is used in the crypto, stock, forex, and other financial markets. For crypto traders, RSI is useful because it provides clear, actionable signals in markets known for volatility. It can help you time entries and exits by indicating when a coin might be due for a bounce or a pullback. The RSI crypto indicator is available for free for all traders on Phemex. Scroll below for demonstrations on how to use it to place successful trades. In this article, we’ll explain what RSI is and how it works, delve into the psychology and rationale behind the indicator, show you how to identify key RSI signals, and outline strategies to trade with RSI.
What Is RSI?
RSI is an indicator that measures the momentum and rate of speed at which the crypto price is moving. RSI is one of the best indicators for crypto trading and a favorite among veteran traders. The readout from this indicator can be used to determine if assets such as Bitcoin are overbought or oversold.
The core of this indicator is based on the average upward price change vs. the average downward price change for a given period of time.
How To Calculate RSI?
‘RS’, or Relative Strength, is the Average of ‘N’ closes upward divided by the average of ‘N’ closes down. This value is then indexed to 100 by using the following formula: RSI = 100 – (100/1 + RS)
This leaves us with a value that fluctuates between 0-100. For this reason, this indicator is known as an “oscillator.”
The standard period setting for this calculation is over a 14 day period based on the periodicity you select. A daily chart will look back over the last 14 days, and a weekly chart will look back over the previous 14 weeks, and so forth.
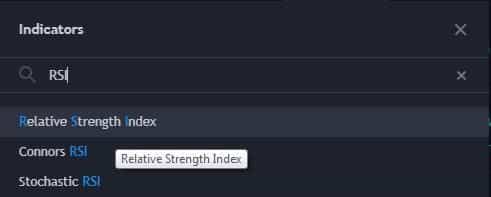
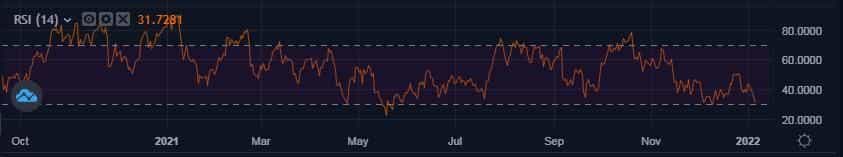
Phemex provides the best app for the RSI indicator. If you input “RSI” under “Indicators” on any charts such as BTC/USDT, you will get the RSI indicator underneath:
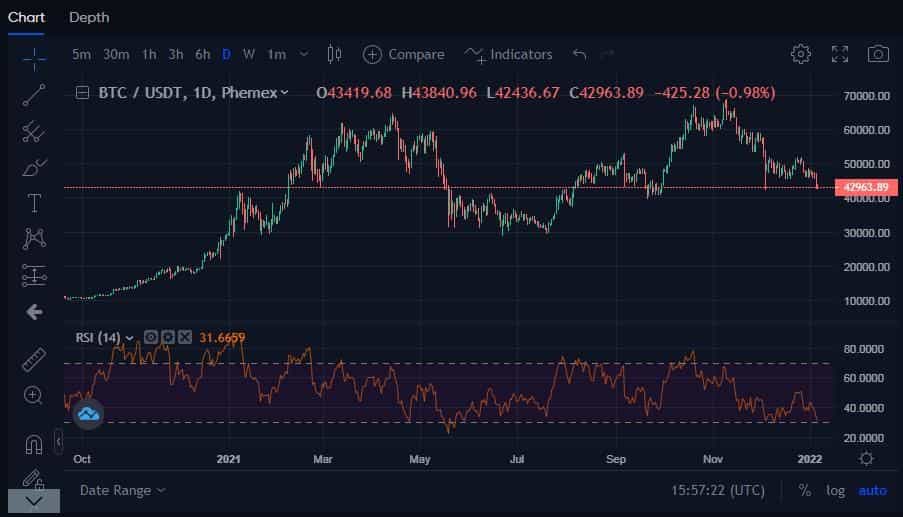
How To Read The RSI Indicator?
Overbought RSI & Oversold RSI
-
RSI Value >70% = Overbought
-
RSI Value <30% = Oversold
RSI values are marked in numbers. The readouts give us insights, and an asset are either “overbought” or “oversold”. RSI values of over 70 are considered overbought territory, and values below 30 are said to be oversold.
If an asset is overbought (>70), this means it’s appreciating and could break down to the downside. If an asset is oversold (30<), it means it’s depreciating and could reverse to the upside.
Applying these criteria in isolation can lead to unfavorable results. Instead, read on to learn about some of the better use cases of the RSI to give you an edge when using it.
The indicator works best when combined with other indicators. For example, RSI with volume can tell you if the volume peaked at multiple points to justify the upward price movement, or if it just peaked once and is going to break down.
Stochastic vs RSI: What’s The Difference?
StochRSI is a popular indicator based on the original RSI indicator. The key difference is that RSI derives data and runs calculations based on price fluctuations in the crypto.
StochRSI is derived from the RSI indicator itself, re-confirming calculations from the RSI indicator. The biggest difference is in the speed that StochRSI and RSI move. StochRSI moves much faster from overbought to oversold, while RSI tends to move more slowly.
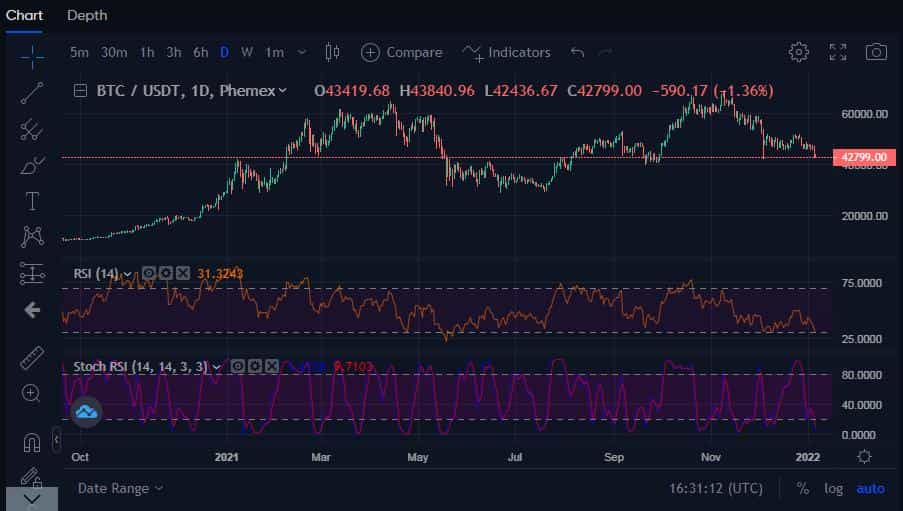
On Phemex, both these indicators can be combined to give a trader a much better overview of the current price situation.
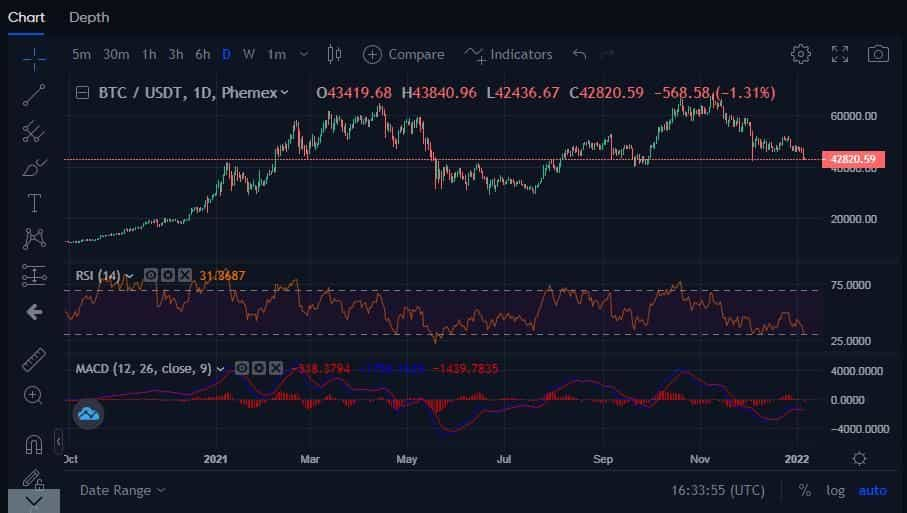
What Is The RSI & MACD Strategy?
The moving average convergence divergence (MACD) is a reliable indicator available at Phemex for all trade pairs. The MACD, like RSI, is a momentum-following indicator that displays the balance between the moving averages of Bitcoin or another crypto.
The RSI and MACD strategy is best used together. After you locate the MACD indicator on the chart, you can combine them both to plan a trade:
What Is The Key Difference Between MACD & RSI?
The key difference between MACD and RSI is that MACD compares two exponential moving averages (EMAs) while RSI measures price percentage changes from tops to bottoms. Combined together, they can give a strong signal when Bitcoin is about to make a move.
MACD is useful for a highly volatile market, and RSI tends to top out at the 70-80 level and bottom out at the 30-40 level. While they are some of the most reliable indicators, they won’t produce 100% accurate signals and can sometimes be misleading.
How To Understand The RSI Indicator?
1- The RSI can remain overbought and oversold for quite some time.
In bull markets, we see that Bitcoin often remains in overbought territory without any real relief, and in bear markets, the opposite. The RSI is a momentum oscillator that can be useful at pointing out and making obvious the periods in which the price has continued in one direction for an extended time.
However, these conditions are times when this would be the norm. For this reason, the RSI might be best used as a signal or warning that goes off for you to start paying attention to the trend and for other signs that it might be getting overextended in either direction. It is not something that should be acted on immediately.
2- RSI dictates price action.
It is important to understand how the calculation and reading of the indicator relates to the price action you are seeing. If the price has been moving in a relatively tight range for a prolonged period of time, the RSI would likely be very neutral.
Therefore, any impulsive move that follows is going to act as an outlier and throw the indicator to one extreme. This could be the breakout that leads to continuation. You would not want to look at this as an oversold or overbought reading that is worth trading.
3- The RSI is best applied in its most suitable trading environment
Similar to moving average (MA) indicators, the RSI is best applied in its most suitable trading environment. For moving averages, these are trends. Meanwhile, the RSI is often best used in ranges where a drop-off in momentum at the extremes is one of the telltale signs of expected reversals.
Applying the RSI in a strong trending environment is one of the easiest ways to end up acting on false signals. It is quite common for traders to spot divergences in the RSI in a trending market.
What’s important to understand is that all trending markets are going to be filled with RSI divergences given the very normal periods of consolidation that occur after impulsive trends. These are always going to read as a divergence in momentum.
How To Use The RSI Indicator?
Using the RSI indicator on Phemex is easy. All you need is to register an account and you’re ready to go. The indicator is free for all users.
1. Enable the RSI indicator
The indicator is available for free to all traders. Click “Indicators” above the chart and search for “RSI”.
2. Use RSI as a bias/momentum context check
If the RSI is trading over the 50 line, we should look for confirmation in price action that the trend is strong, and possibly look for longs. If price is trading below, we will look for confirmation that the trend is weak and look for short opportunities.
Often, we see that in a downward or an upward trend, the line will act as a loose support or resistance zone, and that once reclaimed, it will indicate that context has changed regarding momentum. Either it can pick up again for the first time, or suddenly it is now unable to regain steam.
3. Using divergences as a reason for a second look or confirmation of other strengths/weaknesses present
As we stated above, we need to be careful with this form of application. Often, in hindsight, it seems like a sure thing, but it is usually something that is cherry-picked to look better than it is.
What Is The RSI 14 Meaning?
The RSI indicator uses the number 14 to measure length. This means that you’re looking at RSI analytics for the last 14 days or 14 weeks.
This can be changed according to the trader’s desires. If you want to increase the length you can easily do so by clicking the gear icon in the top left corner and adjusting accordingly.
In the default settings on Phemex under your chart, the number “14” automatically shows up next to the RSI indicator.
What Is A Good RSI Number?
A good RSI number for shorting crypto is 70-80, while a good RSI number for longing crypto is 20-30. A trader could make profitable trades based on the RSI indicator alone using these measurements. To make money in crypto, traders are taught to “buy low and sell high.” RSI can help a trader buy and sell at the right time. The RSI indicator was specifically designed to help you time bottoms and tops.
Use RSI In a Bearish Trend & a Bullish Trend
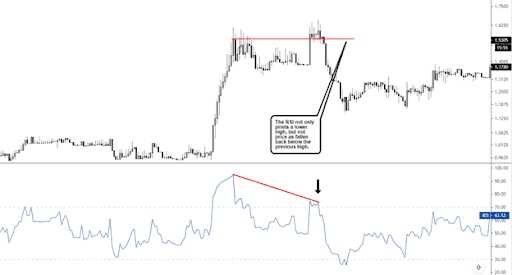
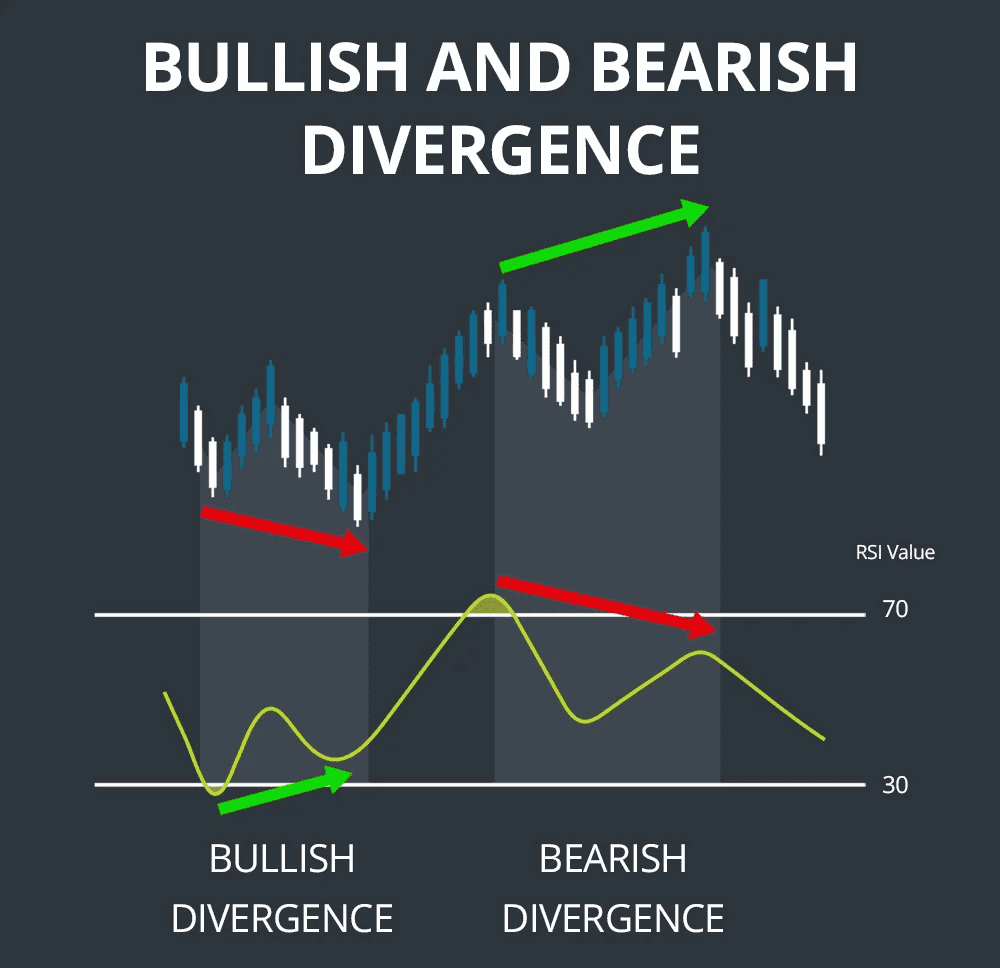
A good RSI to buy is when it’s below 40 and a good RSI to sell is when it’s above 70. In the case of a bearish trend, a bullish divergence is when price makes a lower low but the RSI makes a higher low. In the case of a bullish trend, a bearish divergence is when price makes a higher high but the RSI makes a lower high.
However, using the RSI for divergences is problematic if you act prematurely. For example, let’s say the price impulses upward after being sideways for a period of time. Right after the impulse upwards it begins to form a flag that shoots up higher.
After the initial impulse, the RSI can be very overbought. While the consolidation that forms immediately after is normal, the RSI is going to calculate this price action as having less momentum if it did not continue upward at the same rate of speed as the initial impulse candle. This is always going to print a divergence in a trending market, whether this is a strong uptrend or a strong downtrend.
The action we can take from this type of momentum feedback is to use price action as an anchor point. Let’s say that not only do we make a lower high in RSI, but now also we have lost the high that put in the initial high in the RSI reading. Only now might we have a case for a reversal. If anything, this really is just a measure of confirmation.
What Is A Bad RSI Number?
You want to avoid selling below 40 and buying above 70. In either case, you could be panic-selling or FOMOing in at the peak of a bull run.
Similar any other indicator, a system can be built around the RSI. It is after all one of the most common trading indicators available.
Psychology behind RSI
The RSI (Relative Strength Index) indicator reflects the aggregate psychology of market participants, essentially measuring fear and greed. Understanding these psychological signals can enhance how you use RSI.
-
Overbought Psychology (>70 RSI): An RSI above 70 indicates strong buying pressure, reflecting greed. Here, the market may be overheating, and a pullback is likely as profit-takers emerge and buying enthusiasm wanes. While this doesn’t mean the price is too high, it suggests that the recent gains may not be sustainable.
-
Oversold Psychology (<30 RSI): An RSI below 30 shows intense selling and prevalent fear. This can lead to capitulation, where prices stabilize and may bounce back as sellers exhaust themselves. However, in a strong downtrend, RSI can remain below 30 for a while, indicating sustained fear.
-
RSI Mid-Values (40-60 zone): This zone represents equilibrium between buyers and sellers. An RSI rising above 50 suggests bullish momentum, while falling below 50 indicates bearish sentiment. Levels around 40 and 60 can act as support or resistance.
-
Divergences (Momentum vs. Price): Divergence occurs when the price hits a new high or low but RSI does not. A bearish divergence (higher price, lower RSI) signals trend exhaustion, while a bullish divergence (lower price, higher RSI) suggests that selling pressure may be weakening, often indicating potential reversals.
Is RSI Reliable?
RSI is among the most reliable indicators for both short-term and long-term trends. However, RSI tends to be more accurate when it conforms to or matches other long-term trend patterns.
A wise trader should use the RSI indicator on day/week charts to analyze previous price movements and derive conclusions about the current state of the market.
What Does Low RSI Mean?
Low RSI means that Bitcoin or another crypto is being oversold. This is an excellent buying opportunity for traders and accumulators. When Bitcoin bottoms out, it rarely trends below the bottom unless it’s in a deep bear market.
Bitcoin has traditionally bottomed out in the 30-40 RSI range. If you wonder what is a good RSI to buy, values in the low 30s and 40s may be an ideal place to buy Bitcoin. This often indicates that Bitcoin is expecting a trend reversal and might get some upward momentum in the short term.
If a trader wants to improve the accuracy of their RSI indicator, they can elevate their overbought setting to 80 and their oversold setting to 20. This will weed out most market noise and help them make calculated moves.
Where To Find A Bitcoin RSI Alert?
If you want to set up alerts when the Bitcoin RSI indicator makes a move, the most widely-used site is TradingView.
TradingView allows you to add custom alerts for all trade indicators. These alerts can be emailed or texted to a trader. Use this alerts reference guide and find the RSI indicator on TradingView to set up alerts.
You can use the Phemex BTC/USDT pairs on TradingView to strategize your trade on the site before you open an actual trade on Phemex.
Conclusion
The Relative Strength Index is a proven indicator that can greatly assist your crypto trading decisions. It distills complex price action into a simple oscillator reading, telling you when momentum is running hot or cold. By learning to interpret RSI signals – from classic overbought/oversold conditions to powerful divergence patterns – you can anticipate shifts in market direction and avoid chasing hype or panicking at bottoms. Remember that RSI, like all indicators, is best used in conjunction with other analysis: consider trend context, support/resistance levels, and volume to confirm what RSI is suggesting. Prior to using the RSI indicator, make sure to heavily backtest it and always record data around your trading performance.
As you implement RSI-based strategies, having a reliable trading platform is essential. Phemex offers everything a trader needs to capitalize on RSI signals effectively. With spot and futures trading available, you can go long or short depending on whether RSI hints at a bullish reversal or a bearish turn. You can easily pull up advanced charts on Phemex with built-in RSI and other indicators, customizing settings to your liking. Moreover, Phemex allows you to employ trading bots and conditional orders. In conclusion, mastering RSI can significantly enhance your trading, and doing so on a platform like Phemex ensures you have the speed, tools, and support to act on those insights.