

Summary:
-
Oscillator trading is the use of oscillator indicators to identify the direction, strength, or weakness of a trend before making a trade.
-
If an oscillator line is trending downwards, this indicates a negative (bearish) trend. If it’s trending upwards, it indicates a positive (bullish) trend. If there are multiple lines in an oscillator, the crossing of those lines could indicate a trend reversal in the opposite direction.
-
The most famous technical indicators are mostly oscillator indicators, such as MACD and RSI.
In technical analysis of crypto and other markets, oscillator trading refers to using oscillator indicators to gauge market momentum and identify potential trend reversals. Oscillators are popular among traders because they can signal when an asset (like Bitcoin or Ethereum) is overbought or oversold, and indicate the strength or weakness of price trends. In this updated guide, we’ll break down what oscillators are, how they work, and the benefits of using them. We’ll also highlight the top 5 oscillator indicators traders use (such as RSI and MACD) and discuss how they can be applied in crypto trading today.

What Is An Oscillator?
An oscillator is a technical indicator that fluctuates between positive and negative territory within a range, located beneath a price chart. The purpose of oscillators is to identify the direction, strength, or weakness of a trend. Most traders make successful trades in trending markets, and oscillators specialize in identifying the current trend.
Oscillators that derive data over a longer period, such as RSI, tend to be great for value investing because we can wait for oversold support levels to buy crypto at a discount. The oscillators that derive data from a short period, such as StochRSI, are sensitive and suitable for day trading strategies.
On some indicators the line reaching upper limits signals a bullish uptrend while on other indicators it signals overbought levels. The middle level is mostly marked with 0. Oscillators have one or multiple trend lines. The signals and trends always vary by the indicator.
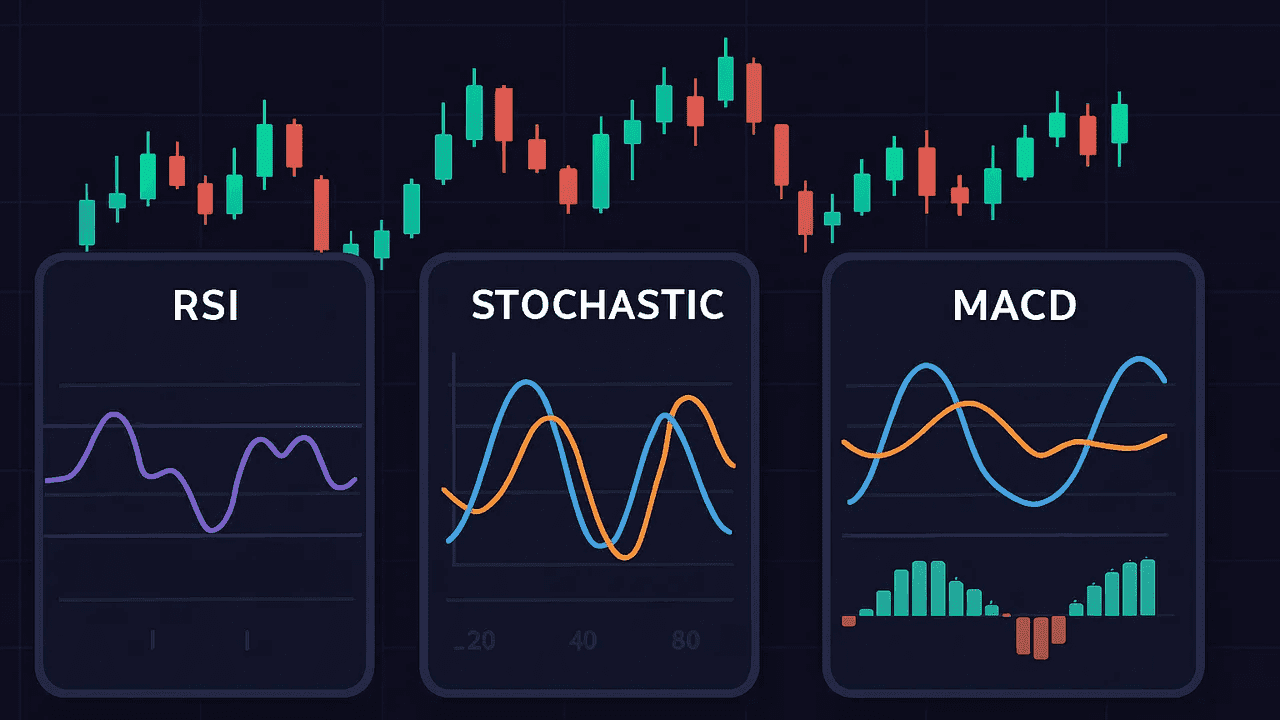
The most famous indicators we use for trading tend to be oscillator indicators:
-
Moving Average Convergence Divergence (MACD) – the most used indicator of all time.
-
Relative Strength Index (RSI)
-
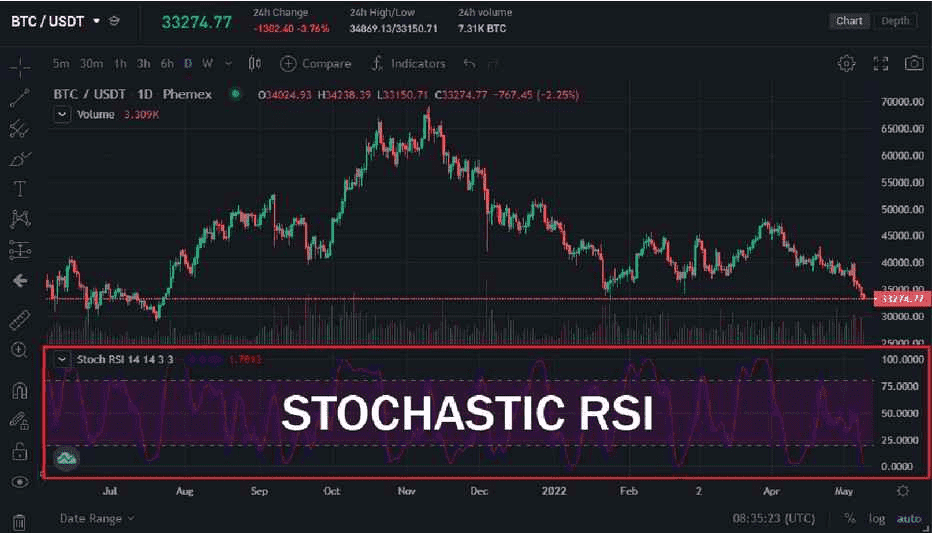
Stochastic RSI (StochRSI)
-
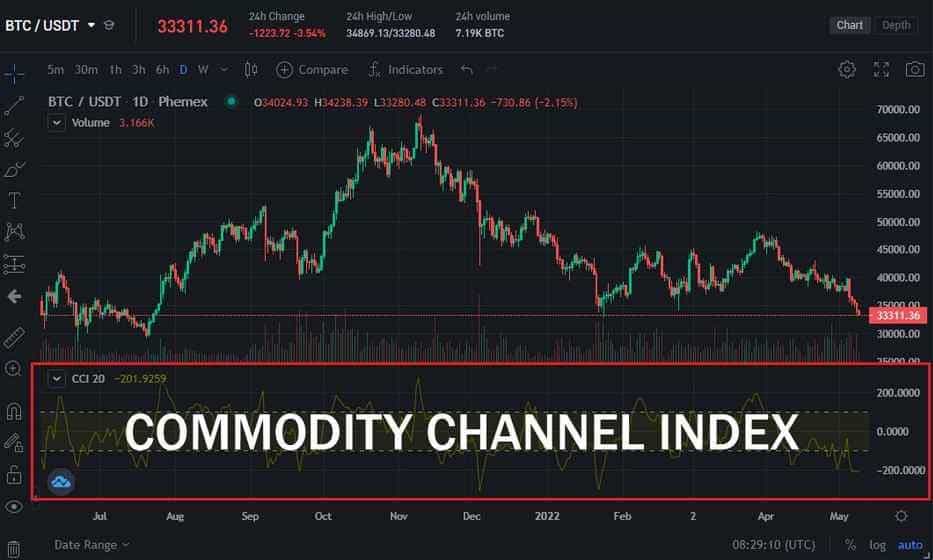
Commodity Channel Index (CCI)
-
Money Flow Index (MFI)
-
Elder’s Force Index (EFI)
-
Fisher Transform (FT)
-
Awesome Oscillator (AO)
-
Williams %R (&R)
-
And many others – visit our technical analysis section to learn about them.
What Are The Different Types Of Oscillators?
Oscillators are very similar and easy to read, but there are slight distinctions in the data they output and the limits they employ. Here are the two types of oscillators.
-
Leading & Lagging Oscillators
Leading oscillators are oscillators that provide data about the current trend. A leading indicator sends trade signals as they occur, and takes in account previous historic data. These indicators are often based on “weighted” moving averages such as the SMA and EMA that place weight on recent price data. Most oscillator indicators are leading indicators and this includes the RSI, StochRSI, CCI, Williams %R, and Chande Momentum Oscillator.
Lagging oscillators are oscillators that work nearly identical to leading indicators, but they either place weight on historic data or they don’t account for the last day. An example of a lagging oscillator is the MACD.
-
Range-Bound & Non-Range Bound Oscillators
Range-bound oscillators are contained within a range in absolute values. No matter which chart we use (1D, 4H, 1H, etc.) the upper and lower range limits will be the same. For example, on the RSI indicator the upper (overbought) range is always 70 and the lower (oversold) range is always 30. This helps traders because it gives context about the limits in relation to historic prices. If the indicator goes above the upper range, or the psychological resistance level, we are in a strong uptrend.
Non-range bound oscillators do not have a fixed range and the values vary based on the chart. This is partially due to the mathematical formula they employ. For example, the Elder Force Index indicator might reach +5,000,000 on one chart and -400,000 on another. The only context we have in regard to range is that it’s positive or negative since the values differ on every chart.
Types of Oscillators (source)
What Are The Benefits Of Oscillator Trading?
Oscillator indicators offer traders various insights in the following scenario:
-
Overbought/Oversold levels: If the price of crypto is trending in an extreme direction, this can be classified as “overbought” or “oversold”. Oscillators indicate these conditions based on the trend line reaching the boundaries.
-
Buy/Sell Signals: Oscillator indicators can provide buy and sell signals based on a crossover strategy. If an oscillator uses two moving averages, the crossing of these averages can indicate a new trend formation and we can open a trade accordingly.
-
Trend Trading: An oscillator rating can confirm the current trend. If a trader suspects that he is in a bullish trend based on the price action, the oscillator will confirm this by moving to positive territory on the upper end and vice versa. Centerline crossovers (i.e. above or below 0) indicate the start of a new trend.
-
Day Trading: Sensitive oscillators such as StochRSI help traders develop an oscillator intraday strategy for day trading. The increased sensitivity and weighted price data enables it to show the current trend of the day and we can trade while ignoring historical data.
-
Divergence Trading: If the oscillator indicator shows different values from the current price trend (i.e. Bitcoin’s price is going up, but the oscillator is going down) this indicates a potential divergence to the upside or downside.
Oscillators tend to follow the current price chart, but they provide unique data that gives an informed trader an edge over traders who trade without technical indicators.
How Do Oscillators Work?
Oscillator indicators apply mathematical formulas to calculate positive and negative trends and divergences. The data used is a combination of price data such as the closing prices, highs, and lows. More advanced indicators use volume profiles histograms and incorporate historic data over multiple x-period.
For example, if the average price of Bitcoin was $40,000 last week and the average price is $50,000 this week, the oscillator would likely move into positive territory because the price is appreciating.
Instead of directly applying the line on top of the Bitcoin candles such as Pivot Points (PP) or Bollinger Bands (BB) indicators, oscillators use their own chart that gives us a different perspective on the price action. Many of them rely on Moving Average (MA) indicators that calculate average prices over a certain period. Some might even use multiple moving averages. For example, the RSI indicator uses the SMA. By applying smoothening (additional time values), they increase the accuracy of their predictions.
Some oscillators are more sensitive than others. Sensitivity refers to the speed of movement of the oscillator. For example, the Stochastic RSI indicator is highly sensitive and it can move from “overbought” to “oversold” levels in a matter of days. Meanwhile, the Relative Strengths Index is less sensitive and it can take weeks or months for the trend line to move in a different direction. This is because it uses long-form data to correlate the current price to historic prices.
Top 5 Oscillator Indicators to Use for Oscillators Trading
To learn how to use oscillators in trading, a trader can start with the most popular oscillators that have been used in commodities and stock markets for several decades. Here are the top picks.
-
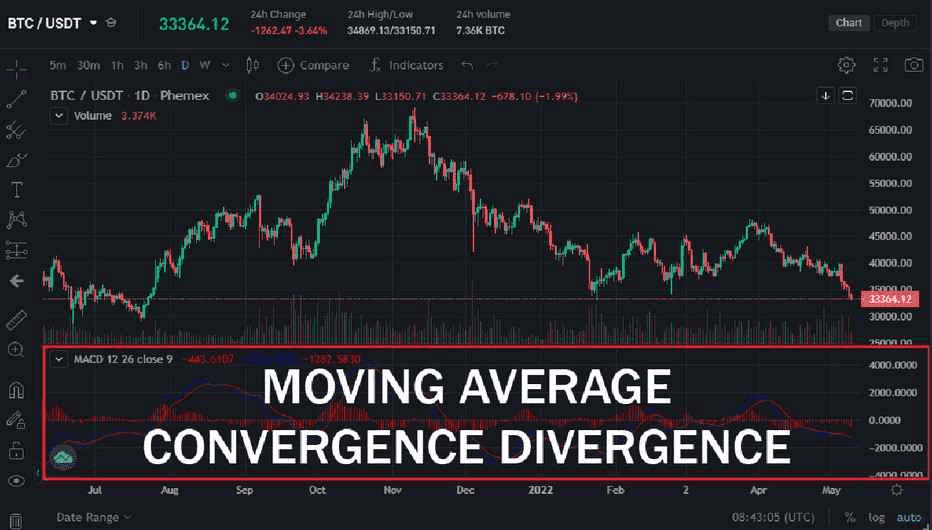
Moving Average Convergence Divergence (MACD)
The MACD indicator is the most used indicator in the world across all markets. It is a testament to the effectiveness of all oscillator indicators and is based on two Exponential Moving Averages (EMAs) that place weight on recent period data. One is the “Signal” line that signals a trend reversal once it crosses the MACD line. The indicator also includes a histogram (red trend line) that indicates the current trend:
-
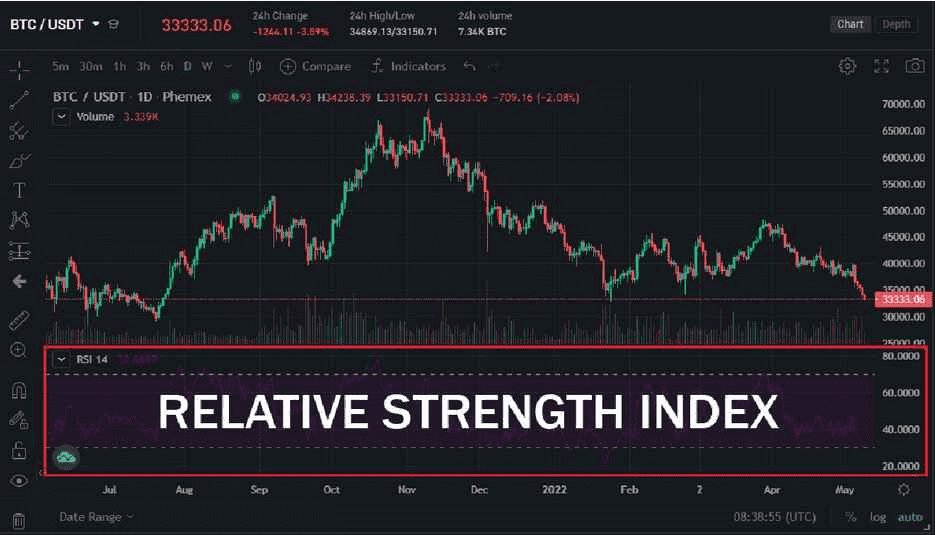
Relative Strength Index (RSI)
The Relative Strength Index indicator is the most used indicator in crypto because it accounts for long-form data and is ideal for the volatility of the crypto markets. When Bitcoin is overbought or oversold, the historic references can let us know exactly how and signal if we’re reaching critical support & resistance levels:
-
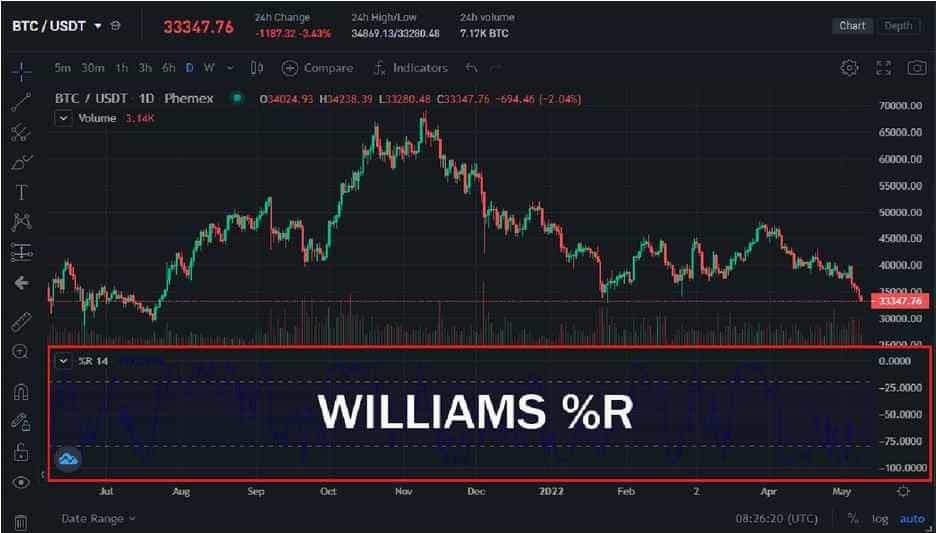
Williams %R
The Williams %R or the “Williams Percentage Range” indicator is a sensitive indicator that detects overbought and oversold levels. It is ideal for oscillator intraday trading because it is range-bound and the values fluctuate rather quickly, showing us daily entry & exit points:
-
Commodity Channel Index (CCI)
The Commodity Channel Index is a leading, range-bound indicator which measures the current trend. The indicator is based on moving averages and the deviation from those moving averages, alerting traders of potential divergence:
-
Stochastic RSI (StochRSI)
The Stochastic RSI indicator is a sensitive indicator that moves between 0-100 and indicates overbought and oversold levels. The advantage it has is that it has two moving averages marked as “K” and “D” line – the crossover between these two lines indicates a trend reversal and alerts us to trade accordingly:
What Is The Difference Between Indicator And Oscillator?
Indicators and oscillators are technical analysis tools. An oscillator is considered an indicator, but it is unique and distinct in that it is contained in upper and lower limits. If we compare a regular indicator that moves over the candles such as Bollinger Bands (BB) to an oscillator indicator such as Relative Strength Index (RSI), we can easily see the distinction:
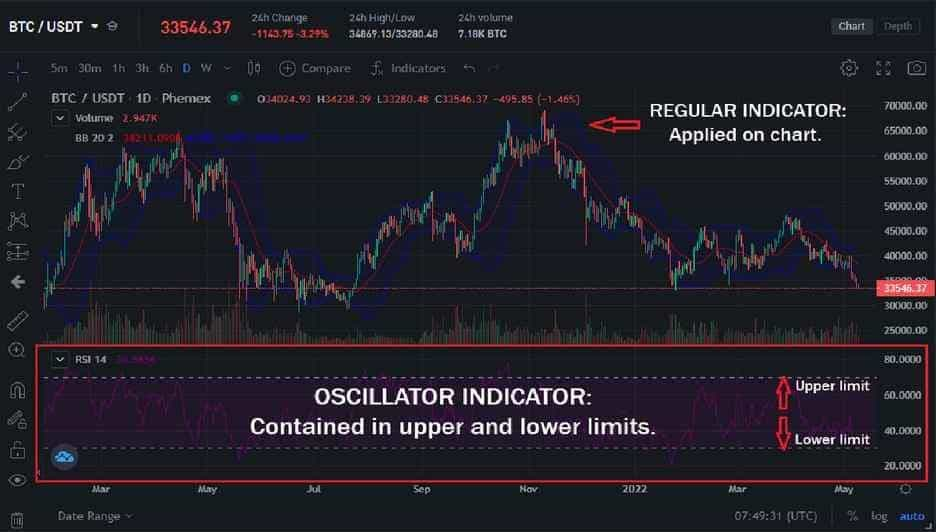
Oscillator vs indicator on the Bitcoin chart.
Bollinger Bands are the blue bands on the candles that envelop them in a channel-like structure and indicate support and resistance levels. RSI is the oscillator below the chart that shows overbought and oversold levels in a limited range, separate from the chart. While both indicators and oscillators belong to the category of “technical indicators”, we can clearly see that Bollinger Bands is not an oscillator while RSI is an oscillator.
All oscillator indicators look almost the same because they have one thing in common: they all oscillate over a centerline. The line splits the readout between positive and negative territory. An oscillator can remain at an extreme level such as “overbought” for a long time, but it will eventually reverse to the downside – or vice versa. This is where the best trading opportunities arise and smart traders can ride the new trends as they’re forming.
It’s common to combine an oscillator with other types of indicators for a fuller picture. For instance, you might use a moving average to define trend direction and an oscillator to time entries within that trend (buy dips in an uptrend when oscillator is oversold, etc.). This way, you’re not solely relying on one tool.
One big difference to remember: Oscillators can remain extreme for long periods in strong trends, which other trend indicators will clearly show as trending. So if you only looked at RSI you might think “sell, it’s overbought” but a trend indicator might say “this is a powerful uptrend, don’t go against it!” Balancing these perspectives is key to effective technical analysis.
Tips for Using Oscillators in Crypto Trading
Here are some practical tips for oscillator trading in the cryptocurrency market:
-
Use Multiple Timeframes: Crypto can be volatile. An oscillator may signal overbought on a short timeframe, while a higher timeframe might indicate a continuing trend. Always check higher timeframes before counter-trend trading.
-
Combine with Price Action: Validate oscillator signals with price movement. For example, if RSI indicates oversold, check if it coincides with significant support or a reversal pattern.
-
Avoid “Oscillator Overload”: Using too many oscillators can lead to confusion. Instead, pick one or two that you are comfortable with, like a momentum oscillator (RSI) and a trend oscillator (MACD).
-
Adjust Settings if Needed: Default settings are good starting points, but you may need to tweak them for faster markets or longer timeframes based on your trading style.
-
Watch for Divergences: Divergences between price and oscillators can signal potential trend reversals. For instance, if Ethereum reaches a new high but the RSI does not, it may indicate weakness.
-
Mind the Trend Regime: In strong trends, use oscillators for entry signals in the trend direction, rather than for reversals.
-
Beware of False Signals: Low timeframes can lead to whipsaws. Look for confirmation before acting on signals.
-
Use Stop Losses: Oscillator signals are not guaranteed. Implement stop-loss strategies to manage your risk if the trade moves against you.
With practice, oscillators can enhance your market analysis and help you quantify momentum effectively.
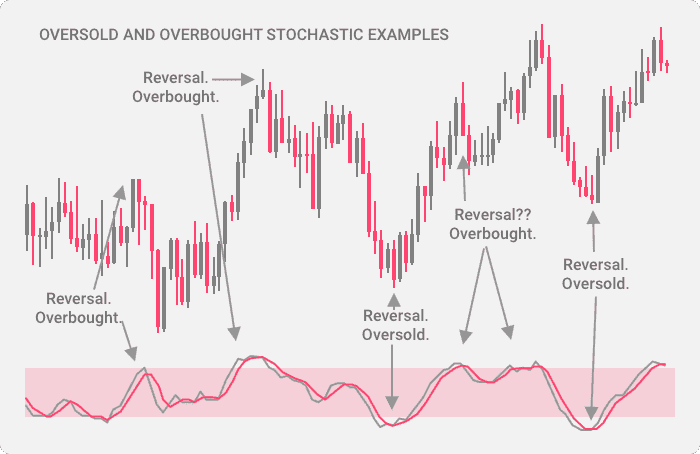
Overbought and oversold Stochastic RSI (source)
Conclusion
Oscillator trading revolves around leveraging these powerful indicators to make more informed trading decisions. In this guide, we covered what oscillators are, how they differ from other indicators, and introduced the top 5 oscillators commonly used in crypto trading today – RSI, MACD, Stochastic (and StochRSI), CCI, and Williams %R. Each of these offers a window into the market’s internal momentum, helping traders identify trends, gauge strength, and spot potential reversals.
Always use oscillators as part of a balanced analysis. They are best used in combination with trend analysis, support/resistance levels, and good risk management. No single indicator is a magic bullet, but oscillators are among the most reliable tools to have. They’ve been used by traders for generations, and they continue to be relevant even as new tools (and automated trading bots) come onto the scene – many trading algorithms themselves incorporate these classic oscillators under the hood.
If you’re new to oscillator trading, a good way to start is to pick one indicator (say, RSI or MACD) and apply it to your charts. Observe how it behaves in different market conditions. See how it related to price movements in historical data. This will build your intuition. From there, you can expand to other oscillators or more advanced concepts like combining multiple or adjusting parameters.
Phemex’s Academy and Blog offer a wealth of information on technical indicators and trading strategies (including detailed articles on many specific oscillators). Make use of these resources to deepen your understanding. With practice, oscillator indicators can become an invaluable part of your trading strategy – helping you buy when others are fearful (oversold) and sell when others are greedy (overbought), all while staying aligned with the prevailing trend. To learn more about oscillator indicators you can implement with your trading strategy, visit Phemex’s comprehensive technical analysis section.