

Technical analysis remains vital for crypto traders in 2025. One popular momentum oscillator is the Williams %R indicator – a tool to identify overbought and oversold conditions in crypto markets. Williams %R (Williams Percent Range) helps traders time potential price reversals by measuring where the latest closing price lies within a recent high-low range. In this comprehensive guide, we’ll explain what the Williams %R indicator is, how it works, and how to use it effectively in cryptocurrency trading. We’ll also compare Williams %R to other momentum indicators like RSI and Stochastic, provide practical examples from 2024–2025 price action, and share tips to avoid common pitfalls. By the end, beginner to intermediate traders will understand how to leverage Williams %R in crypto to make more informed trading decisions.

What Is the Williams %R Indicator?
The Williams %R was developed by trader Larry Williams in 1973 as a way to gauge market momentum and extreme price levels. It oscillates between 0 and -100 and indicates how close the current price is to the highest high or lowest low over a look-back period (typically 14 periods). In simpler terms, Williams %R shows whether prices are near the top or bottom of their recent trading range:
-
Values near 0% (e.g. -10% or -5%) – indicate the asset is overbought, meaning the price is close to its recent high. An overbought reading suggests buyers have pushed the price up aggressively and a downturn may be due as buying power could be exhausted. Traders consider Williams %R above -20% (in the range from -20 to 0) as the overbought zone.
-
Values near -100% (e.g. -90% or -95%) – indicate the asset is oversold, meaning the price is near its recent low. An oversold reading suggests heavy selling has likely driven the price down too far too fast, and an upturn or bounce may be imminent as selling pressure wanes. Readings below -80% (from -80 to -100) are considered oversold territory.
-
Middle values (around -50%) – indicate a more neutral condition, where the price is mid-range relative to recent highs and lows. In this zone, neither buyers nor sellers have full control, and momentum is neutral.
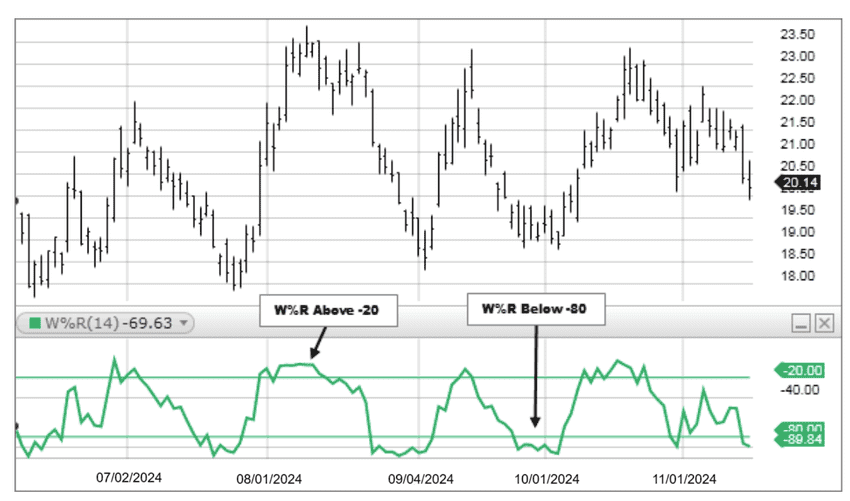
By default, charting platforms often draw horizontal lines at -20 and -80 on the Williams %R indicator to mark the typical overbought and oversold thresholds. When Williams %R moves above -20 or below -80, it signals extreme conditions.
Williams %R vs. Other Oscillators: It’s helpful to compare Williams %R with similar momentum indicators:
-
Stochastic Oscillator: Williams %R is essentially an inverted version of the Stochastic %K oscillator. The Stochastic Oscillator ranges from 0 to 100, whereas Williams %R ranges from 0 to -100. In fact, Williams %R = (Stochastic %K * -1) + 100. Both indicators measure the position of the close relative to the recent range. A Williams %R reading of -10% corresponds to a Stochastic reading of 90% – both indicating overbought levels. Williams %R’s scale (with 0 at top and -100 at bottom) can be more intuitive for some traders to visualize overbought (near 0) and oversold (near -100) conditions.
-
Relative Strength Index (RSI): RSI is another popular momentum indicator that oscillates between 0 and 100. RSI considers average price gains vs. losses over a period and marks overbought above 70 and oversold below 30. Compared to Williams %R, RSI has a built-in smoothing and typically moves more slowly. RSI uses a midpoint at 50% to gauge trend strength, whereas Williams %R focuses on extreme levels (-20 and -80) for signals. Williams %R can sometimes give earlier overbought/oversold signals because it’s very sensitive to recent highs/lows, but RSI is often used to confirm the strength of a trend. Many crypto traders use both: for example, if RSI indicates bullish momentum but Williams %R flashes an overbought warning, it may suggest caution in the short term.
-
Stochastic RSI (StochRSI): This is essentially the Stochastic applied to RSI values (an oscillator of an oscillator). StochRSI also ranges 0–100 and can generate more frequent signals. Williams %R often produces signals similar to StochRSI since both are highly sensitive. However, Williams %R is calculated directly from price extremes, whereas StochRSI is derived from RSI values. Both can be used for fine-tuning entry/exit points in crypto trades.
W%R Indicator (source)
How to Calculate Williams %R
Williams %R is straightforward to calculate. The standard setting uses 14 periods (which could be 14 days on a daily chart, 14 hours on an hourly chart, etc.), but traders can customize this. The formula is:
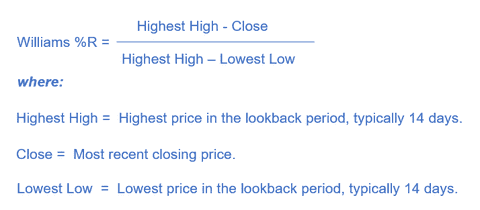
In essence, Williams %R tells us how far below the recent peak the current close is, as a percentage of the recent price range. Multiplying by -100% inverts the value into a negative percentage. A reading of 0% means the current price is the highest high of the period (very strong recent performance). A reading of -100% means the price is at the lowest low of the period (very weak recent performance).
Modern trading platforms calculate Williams %R automatically, so you don’t need to crunch numbers manually. However, understanding the formula helps you grasp what the indicator is signaling. Essentially, Williams %R is measuring where the current price is relative to recent extremes. This makes it a handy gauge of market momentum: values near 0 or -100 mean the market is pushing the extremes of its recent range (potentially unsustainable moves).
How to Interpret Williams %R in Crypto Trading
Interpreting Williams %R involves watching for the indicator to enter or exit certain zones, as well as analyzing its pattern relative to price moves. Here are the primary interpretations:
-
Overbought (0 to -20%): When Williams %R is above -20%, the asset is considered overbought, typically during strong rallies. It signals potential price corrections. For instance, if Ethereum’s %R hits -10% after a rapid rise, it suggests the rally may be weakening. Traders often wait for it to drop below -20% as a sell signal. However, in strong bull markets, it can remain overbought for extended periods without triggering sells.
-
Oversold (-80% to -100%): When below -80%, the asset is oversold, indicating potential rebounds after sharp price drops. For example, if Bitcoin’s %R reaches -95% during a selloff and then rises above -80%, it could indicate a recovery. Traders should consider additional factors like support levels and candlestick patterns to confirm buying opportunities.
-
Neutral/Mid-range (-50% ±30%): Values between -50% and either -20% or -80% show a non-extreme market. A reading above -50% suggests a bullish bias, while below -50% indicates bearish sentiment. If %R consistently moves above -50%, it hints at upward momentum, whereas sustained readings below -60 may signal further declines.
Divergences: Bullish or bearish divergences occur when the indicator goes against price trends. A bearish divergence happens when price peaks but %R does not, indicating weakening momentum. Conversely, bullish divergence occurs when price makes a lower low but %R rises, suggesting diminishing selling pressure. Confirming divergences with price actions enhances reliability.
These insights help traders make more informed decisions based on the Williams %R indicator.
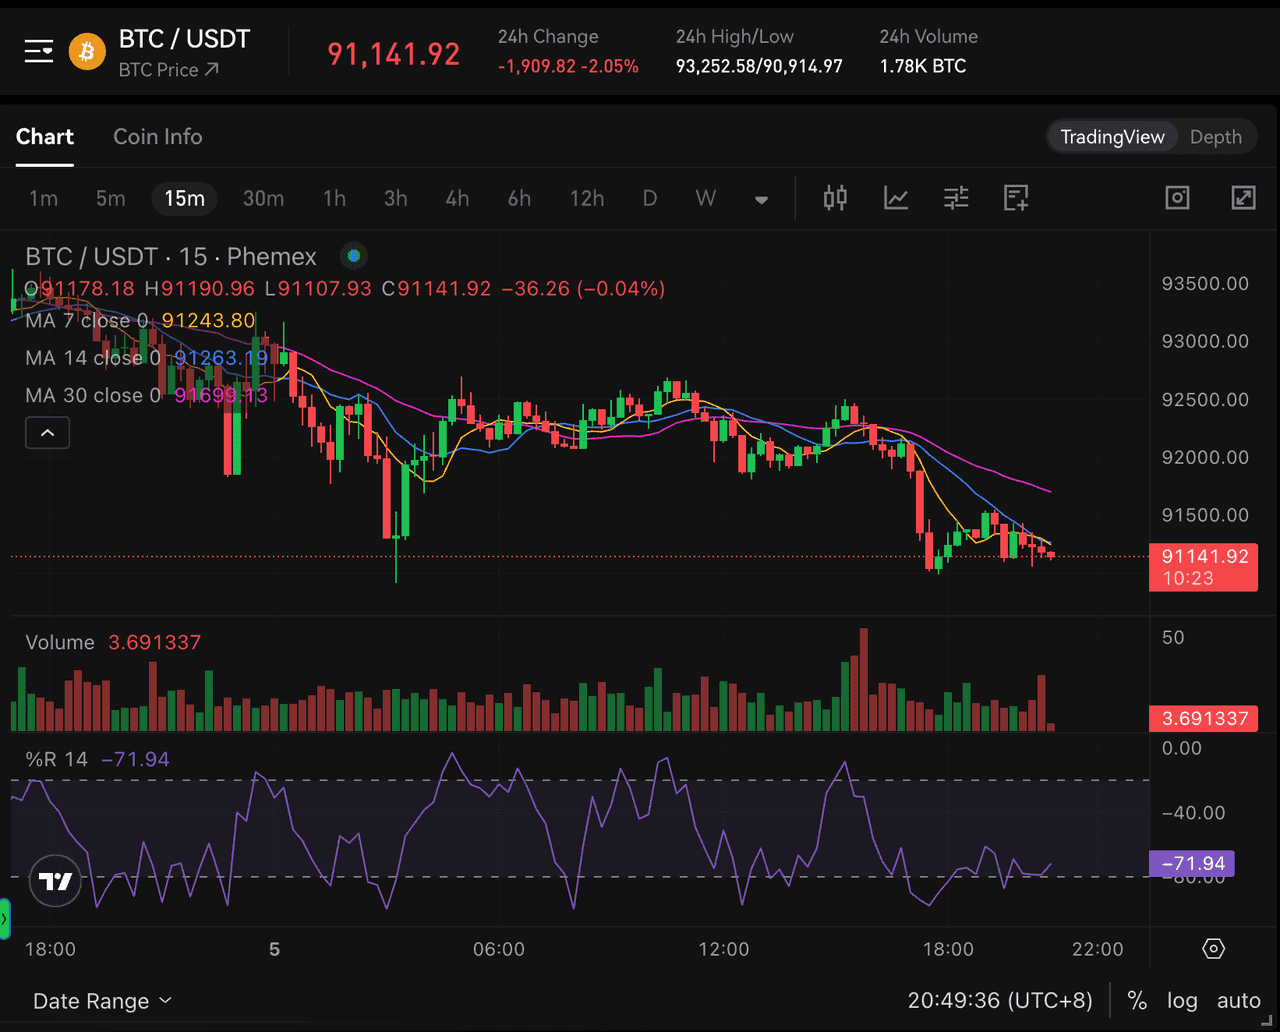
Williams %R Indicator on the BTC/USDT Price Chart on Phemex (source)
Using Williams %R in Crypto Trading – Strategies and Tips
-
Combining Williams %R with Trend Analysis: Williams %R is best used within the context of market trends. In range-bound markets, it signals overbought (above -20) and oversold (below -80) conditions, guiding traders to sell at the top of a range and buy at the bottom. For example, if BNB trades between $300 and $400, a reading above -20 at $400 suggests taking profits, while below -80 at $300 signals a potential buying opportunity. In trending markets, caution is needed as %R may frequently indicate overbought conditions in strong uptrends. Traders may ignore these readings and look for dips as buying opportunities. In downtrends, they can wait for brief rallies to establish short positions without blindly acting on oversold signals. Always assess if the market is trending or ranging to interpret %R signals accurately.
-
Entry and Exit Triggers: A buy signal occurs when %R climbs above -80 after being below it, suggesting a reversal from oversold conditions. For instance, if Solana (SOL) reaches -85 and rises to -75, it could indicate a rebound opportunity. Additional confirmations, like bullish patterns, can help filter out false signals. Conversely, a sell trigger happens when %R drops below -20 after being above it, indicating a reversal from overbought conditions. A case with Cardano might show a drop from -10 to -25, suggesting a pullback. Confirmations using bearish patterns can enhance trading confidence.
-
Use Multiple Timeframes: Multi-timeframe analysis with Williams %R is common among crypto traders. For example, a daily chart might show Bitcoin as overbought (-15%), while a 1-hour chart could identify an overheated reading for an optimal short entry. If the daily %R is oversold (-85%) at support, an upward turn on a 1-hour chart could present a low-risk buying opportunity. This combined approach helps avoid misleading short-term signals.
-
Compare with RSI or MACD for Confirmation: It’s prudent to confirm Williams %R signals with secondary indicators. If %R indicates overbought, check if RSI is similarly high or if the MACD is weakening. For example, a -5% reading on %R with an RSI of 60 suggests caution as the trend may still be strong. Conversely, if %R is oversold with RSI below 30 and a bullish MACD crossover, it could signal a strong buying opportunity.
-
Practical Example (2024–2025 Crypto Price Action): In April 2024, Bitcoin rallied ahead of its halving event, with Williams %R entering overbought territory (above -20) in late March and hovering between -5% and -15% for weeks. Traders who sold when %R first hit overbought missed further gains. A better strategy was to ride the trend and watch for %R to drop—by mid-April, %R fell from around -10% to below -50%, signaling a trend change and prompting many to take profits near $70k.
Moving to mid-2025, Bitcoin was in another uptrend, often showing overbought readings. Traders used the 4-hour %R to identify entries on pullbacks, buying when it dipped below -80 during an upward trend. This method worked well, allowing traders to navigate the volatile market effectively. In late 2025, %R fell into oversold territory (< -80), suggesting Bitcoin was undervalued, but the price continued to slide briefly. A bullish divergence emerged when the price made a lower low, but %R recorded a higher low (around -70). Savvy traders recognized this along with on-chain metrics, leading to a strong rally in November 2025. This example highlights Williams %R's versatility in timing trades, spotting divergences, and gauging market sentiment.
Williams %R Tips and Common Pitfalls
-
Adjust the Period for Your Asset: The default 14-period %R is a good starting point, but feel free to experiment. Highly volatile altcoins may work better with a slightly longer look-back (e.g. 20 or 28) to smooth out noise, whereas a slow-moving coin might require a shorter period (e.g. 10) to generate timely signals. Always test on historical charts to see how well the Williams %R settings would have identified past turning points for that crypto.
-
Avoid Signal Overload: While it’s tempting to use Williams %R on every timeframe with multiple other indicators, be careful not to succumb to analysis paralysis. The indicator is meant to simplify decision-making by highlighting extremes. If you combine too many indicators, you might get conflicting messages and freeze. Often a clean chart with price action and one or two indicators (say, Williams %R and maybe a moving average for trend) can be more effective than five different oscillators. Keep it simple – use Williams %R as a sharp signal, and maybe one confirmation tool.
-
Not a Standalone Strategy: Perhaps the most important reminder is that Williams %R should not be used in isolation for critical trading decisions. It doesn’t account for fundamental news, overall market trends, or volume by itself. For example, a coin’s %R might flash oversold, but if bad news just hit (like a hack or regulatory ban), the price could continue to plunge regardless of the “oversold” reading. Always consider the broader context – support/resistance levels, chart patterns, volume spikes, and fundamental drivers. Williams %R is best thought of as a timing instrument to refine entries and exits within a plan, not the sole basis of a trade.
-
Beware of False Signals in Choppy Markets: Crypto markets can be notoriously volatile and sometimes range-bound with erratic swings. In such sideways, choppy conditions, Williams %R may flip from overbought to oversold rapidly, generating many signals. Some of these will be false starts where price doesn’t follow through. One way to filter this is to increase the look-back period (to reduce sensitivity) or require confirmation (as discussed) before acting. Additionally, pay attention to the slope and behavior of %R: if it’s constantly jagged and crossing thresholds every other day, the market may lack clear direction – a cue to step back or use a different tool until a trend emerges.
-
Use Stop-Losses: If you enter a trade based on Williams %R (say you buy because of an oversold signal), always protect yourself with a logical stop-loss level in case the signal was premature and the price keeps dropping. For instance, you might set a stop just below the recent swing low when buying on an oversold bounce. This way, if the anticipated reversal doesn’t happen, your loss is limited. Conversely, if shorting on an overbought signal, consider a stop above the recent swing high. Risk management is crucial; Williams %R can hint at probable price turns, but nothing is guaranteed.
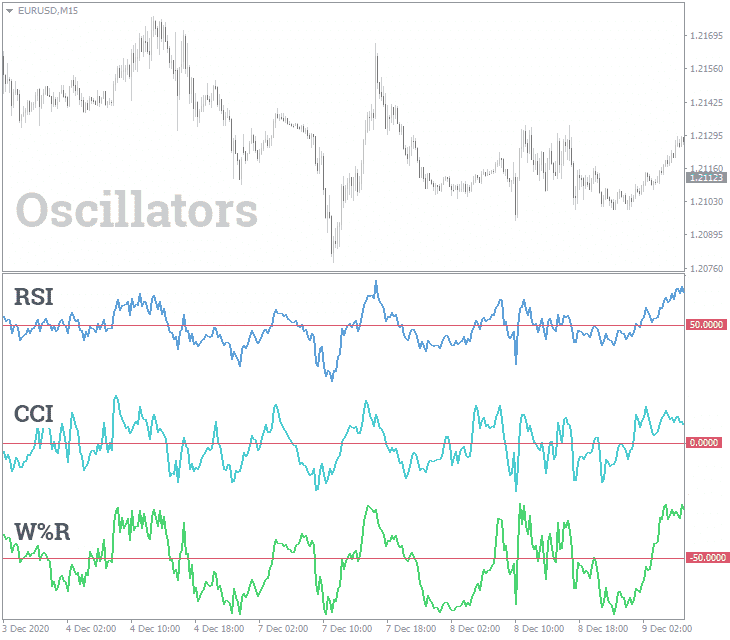
Oscillators Comparison (source)
Williams %R vs. RSI vs. Stochastic: Which to Use?
New traders often ask whether they should use Williams %R or stick to the better-known RSI or Stochastic Oscillator. The truth is, all three are valuable, and they often complement each other. Williams %R is great for its speed and sensitivity – it’s a leading indicator that will quickly react to price extremes. RSI is a bit more of a steady momentum gauge with built-in smoothing; it might save you from some false signals but could be late to the party. The Stochastic Oscillator (and its cousin StochRSI) are somewhat in between, with dual lines that provide crossovers as additional signals.
If you’re trading crypto in 2025, consider using multiple oscillators in different roles:
-
Use Williams %R to flag the immediate overbought/oversold status. Think of it as the alarm bell – “Hey, this coin is extremely overbought right now!”
-
Use RSI to evaluate overall momentum strength and longer-term divergences. RSI’s levels (70/30) can corroborate whether the extreme indicated by %R is significant.
-
Use Stochastic or StochRSI if you like having additional crossover signals and a second oscillator to double-check short-term moves.
For most purposes, you won’t need all three on one chart. Many experts recommend starting with one (say RSI for simplicity) and then adding Williams %R when you’re comfortable, to catch more nuanced entry/exit points. The combination of RSI and Williams %R is particularly potent: RSI tells you if an asset is generally overbought or oversold by its own momentum, and Williams %R pinpoints if it’s at the top tick or bottom tick of its recent range. In summary, Williams %R is a valuable addition to your toolkit. It shines in timing and can improve your trades when used alongside other analysis.
Conclusion
The Williams %R indicator is a valuable tool for crypto traders, helping identify market extremes by fluctuating between 0 and -100. Values above -20% suggest an asset may be overbought, while those below -80% indicate it might be oversold. However, it’s essential not to rely solely on %R as a buy or sell signal, as extreme readings can persist during strong trends, leading to possible false signals.
For effective use, integrate Williams %R into a broader trading strategy by confirming its signals with other indicators like RSI or MACD, considering the overall market trend, and applying good risk management practices. It’s user-friendly and accessible on platforms such as Phemex, making it a great entry point for beginners in technical analysis.
In summary, Williams %R helps time entries and exits during extreme market conditions. Being mindful of its indications can prevent emotional trading decisions and potentially uncover profitable opportunities. Combining %R with thorough analysis will enhance your ability to navigate the crypto market’s fluctuations in 2025 and beyond.