
Candlestick charts are a cornerstone of cryptocurrency trading, offering a visual representation of price movements that helps traders make informed decisions. Beyond spot trading, candlestick patterns enable traders to predict price trends for assets like Bitcoin (BTC) by analyzing market sentiment and momentum. This guide explores what candlestick patterns are, how to read them, and the eight most important bullish and bearish patterns to know for effective crypto trading on platforms like Phemex.
What Is a Candlestick?
A candlestick represents an asset’s price activity over a specific timeframe, which traders can customize (e.g., 1-minute, 1-hour, daily, or monthly) based on their trading strategy. Each candlestick displays four key components:
-
Open: The asset’s price at the start of the timeframe.
-
Close: The asset’s price at the end of the timeframe.
-
High: The highest price reached during the timeframe.
-
Low: The lowest price reached during the timeframe.
The body of the candlestick shows the range between the open and close prices, while wicks (or shadows) extend above and below to indicate the high and low. Candlesticks are typically color-coded:
-
Green: The closing price is higher than the opening price, indicating a price increase.
-
Red: The closing price is lower than the opening price, indicating a price decrease.
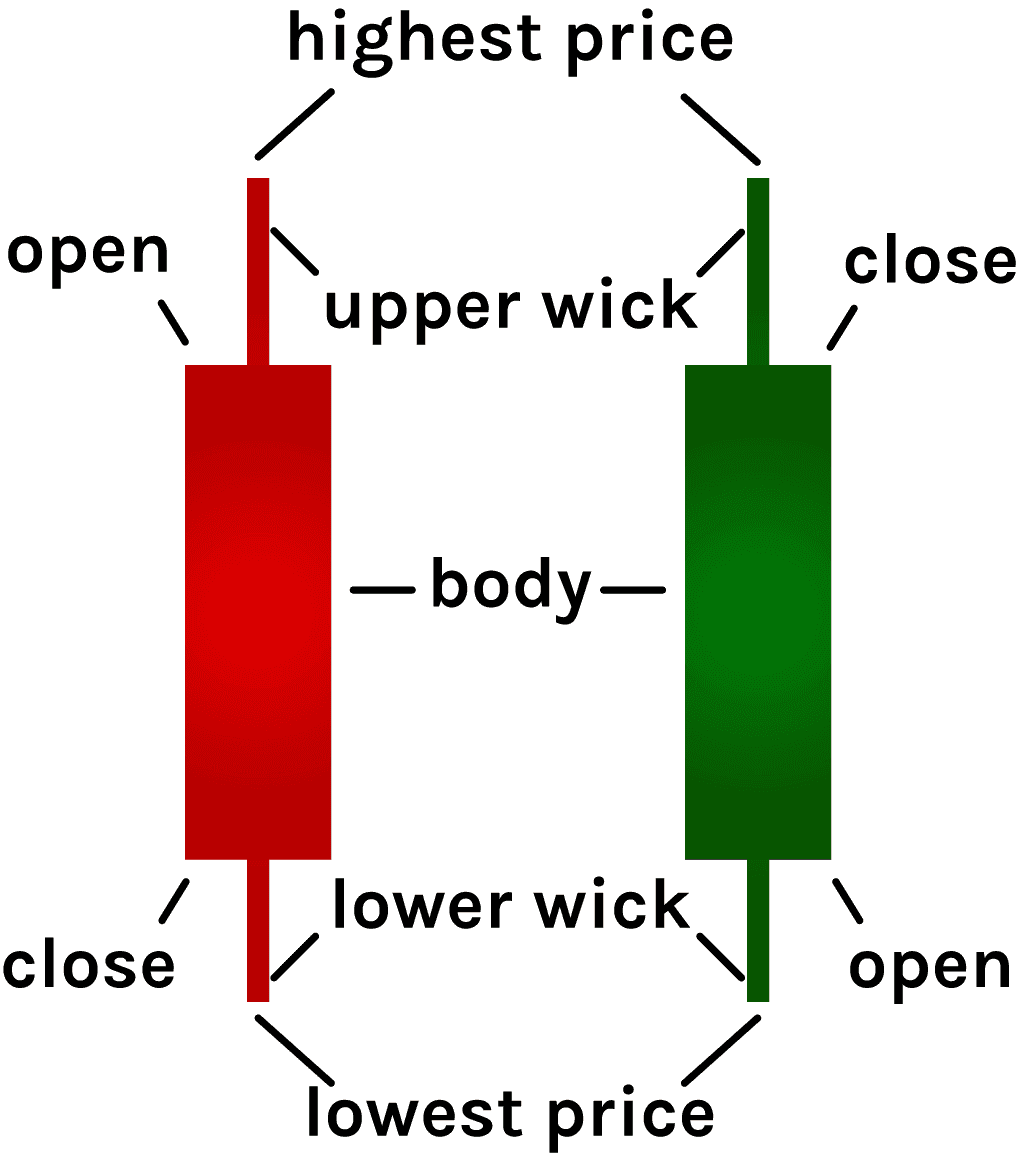
For example, in a 5-minute green candlestick for BTC, if the open is $60,000 and the close is $60,500, the body shows this upward movement. If the high was $60,700 and the low was $59,800, the upper wick extends to $60,700, and the lower wick reaches $59,800.
Why Use Candlestick Charts?
Originating with Japanese rice traders in the 18th century, candlestick charts have evolved into a vital tool for modern traders. Their visual appeal and ability to convey price action and market sentiment make them superior to simple line charts. By analyzing multiple candlesticks, traders identify patterns that signal potential price reversals or continuations, aiding critical trading decisions on platforms like Phemex.
How to Read Candlestick Patterns
Candlestick patterns form over time, revealing trends, reversals, or market indecision. A single candlestick provides insights into price action within its timeframe, while multiple candlesticks create larger patterns that traders use to forecast market direction. For instance:
-
A green candlestick with a long upper wick suggests buyers pushed the price up but faced resistance, closing below the high.
-
A red candlestick with a long lower wick indicates sellers drove the price down, but buyers stepped in, preventing a lower close.
While candlesticks may seem complex initially, regular study reveals their predictive power, especially when combined with other technical indicators like RSI or Moving Averages.
8 Essential Candlestick Patterns for Crypto Trading
Candlestick patterns are categorized as bullish (signaling potential price increases) or bearish (signaling potential price decreases). Below are five bullish and three bearish patterns every crypto trader should recognize.
Bullish Candlestick Patterns
-
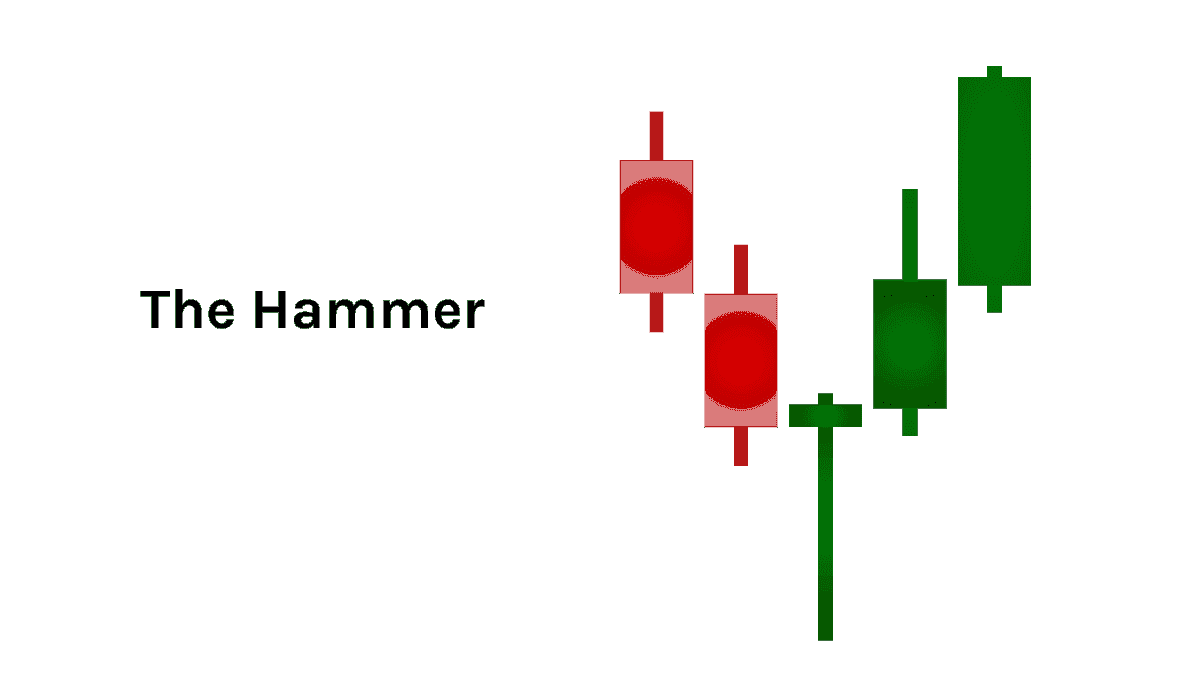
Hammer
-
Appearance: A small body (green or red) at the top with a long lower wick and little to no upper wick, formed at the bottom of a downtrend.
-
Meaning: Indicates strong buying pressure after selling, suggesting a potential reversal. For example, if BTC drops to $58,000 but closes at $59,000 with a long lower wick, buyers are stepping in, signaling a possible uptrend.
-
Signal: Potential price increase or reversal.
-
-
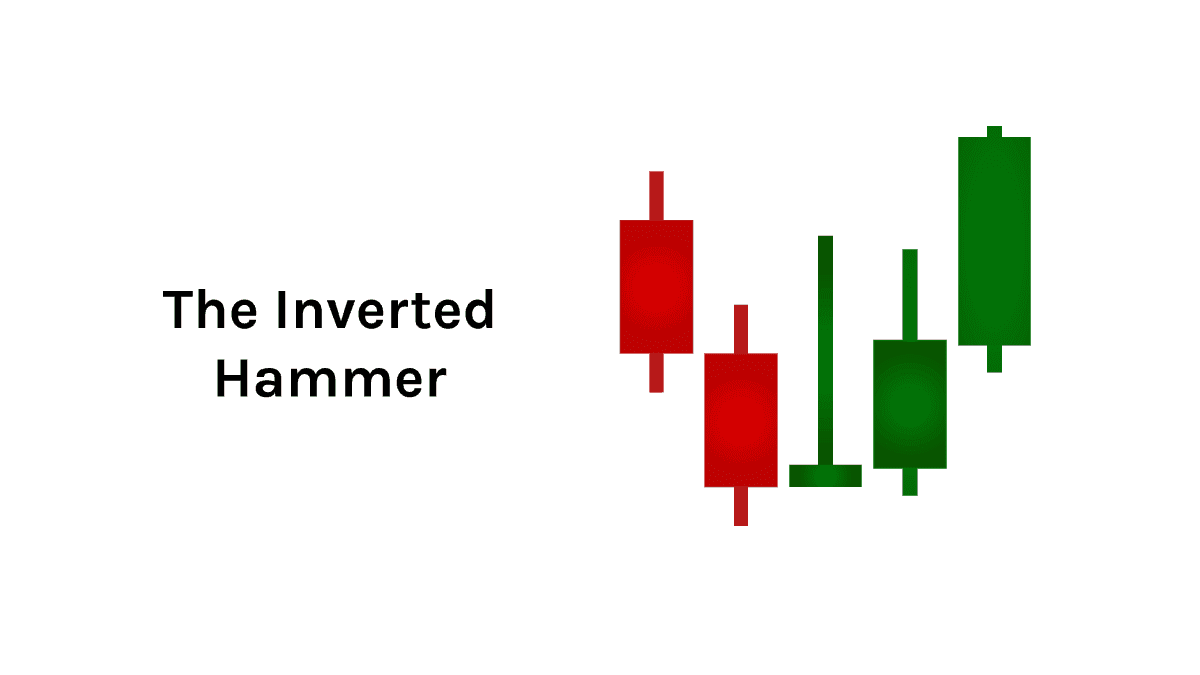
Inverted Hammer
-
Appearance: A small body (green or red) with a long upper wick and little to no lower wick, also at a downtrend’s bottom.
-
Meaning: Suggests buyers attempted to push the price higher, but sellers resisted. If followed by a green candle, it confirms a potential uptrend.
-
Signal: Start of an uptrend.
-
-
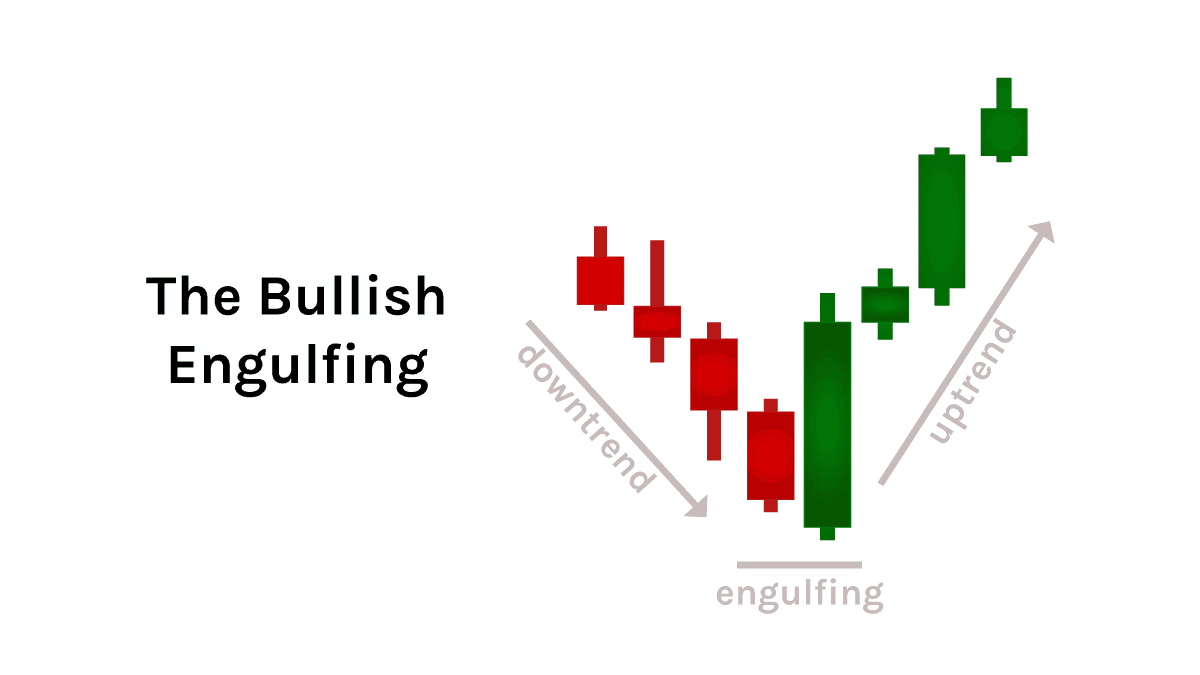
Bullish Engulfing
-
Appearance: Two candles at a downtrend’s end: a small red candle followed by a larger green candle that fully engulfs the previous candle’s body. A small gap between candles may occur (less common in crypto).
-
Meaning: Strong buying pressure overwhelms selling, indicating a shift to bullish sentiment. For example, if BTC’s red candle closes at $60,000 and the next green candle opens at $59,800 and closes at $61,000, buyers dominate.
-
Signal: Strong bullish reversal.
-
-
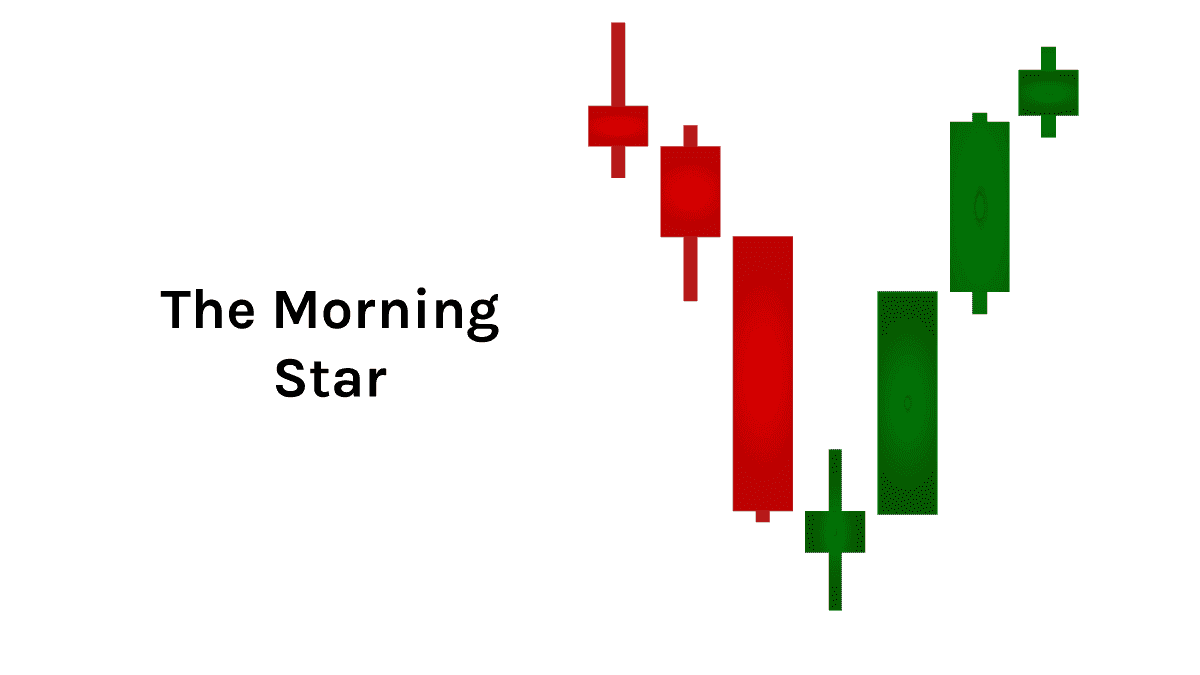
Morning Star
-
Appearance: Three candles at a downtrend’s bottom: a long red candle, a short-bodied “star” candle with long wicks (closing below the first candle), and a long green candle closing above the first candle’s midpoint.
-
Meaning: Shows declining selling pressure, with buyers taking control by the third candle, signaling a shift to an uptrend.
-
Signal: Bullish reversal.
-
-
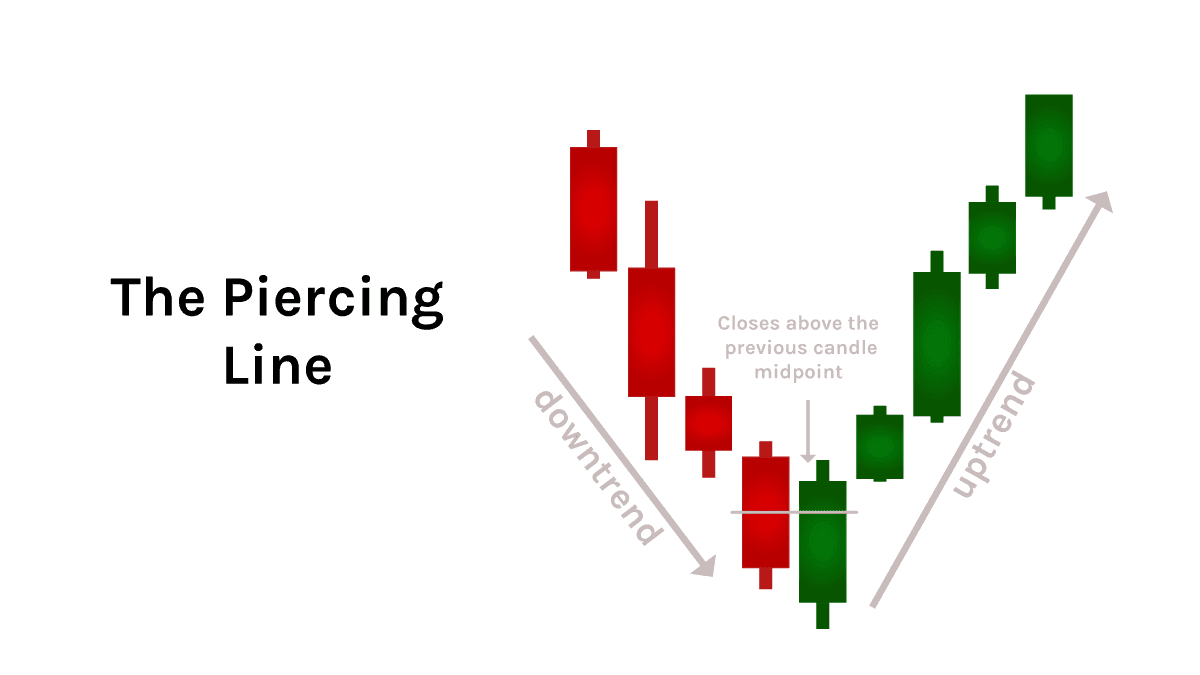
Piercing Line
-
Appearance: A long red candle followed by a long green candle at a downtrend’s end, with the green candle closing above the midpoint of the red candle’s body. A gap may exist between candles.
-
Meaning: Buyers surge after a bearish start, showing strong interest at current prices.
-
Signal: Bullish reversal with significant buying interest.
-
Bearish Candlestick Patterns
-
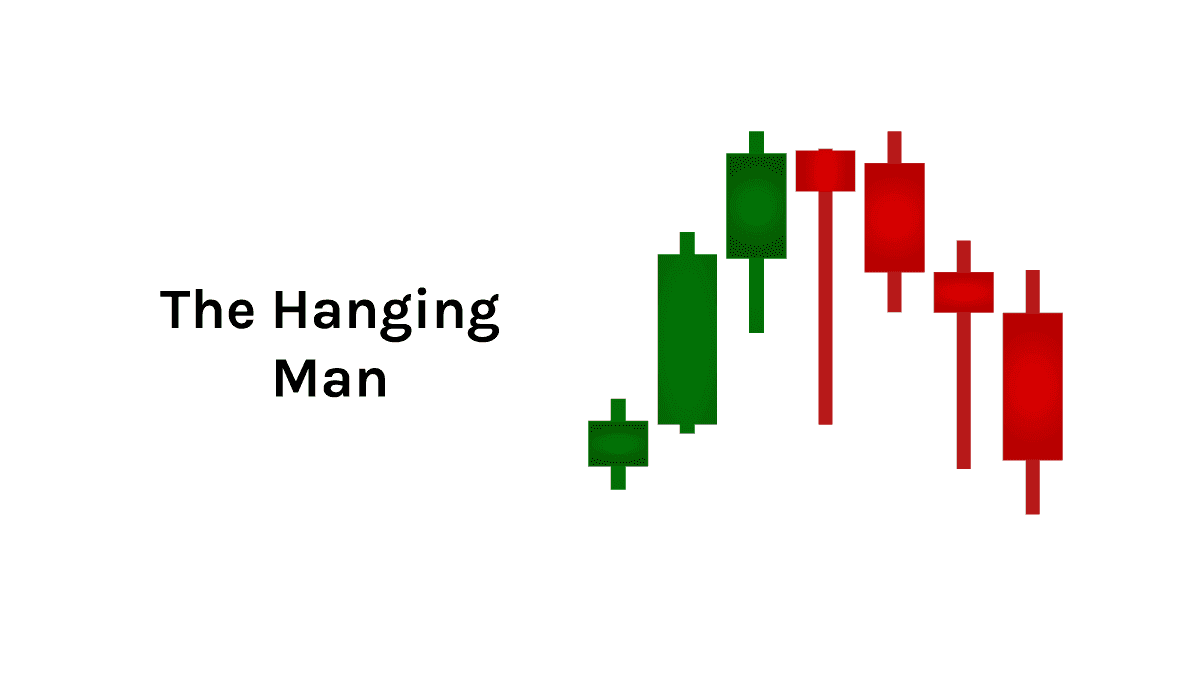
Hanging Man
-
Appearance: A small body (green or red) with a long lower wick and little to no upper wick, formed at the peak of an uptrend.
-
Meaning: Suggests selling pressure is increasing, weakening the uptrend. For example, if BTC peaks at $62,000 but closes at $61,500 with a long lower wick, sellers are active.
-
Signal: Potential sell signal or downtrend.
-
-
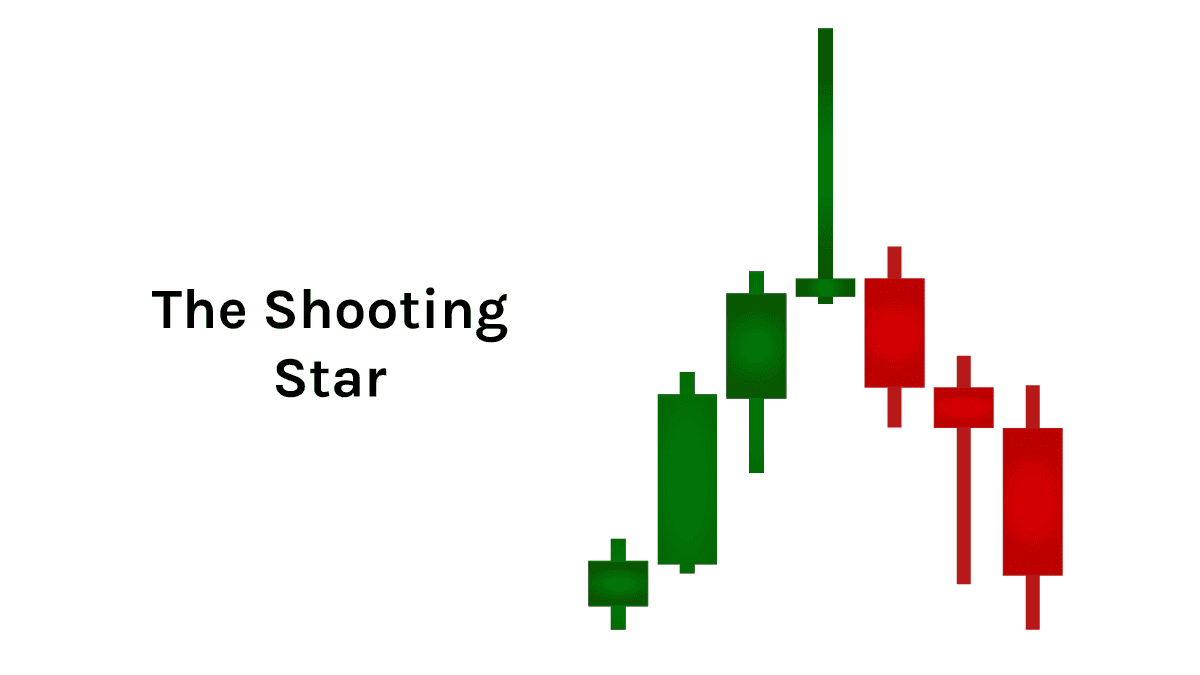
Shooting Star
-
Appearance: A small body (green or red) with a long upper wick and little to no lower wick, at an uptrend’s peak.
-
Meaning: Indicates buyers pushed the price up but faced rejection, closing near the open. This signals a potential bearish reversal.
-
Signal: Bearish reversal after a price surge.
-
-
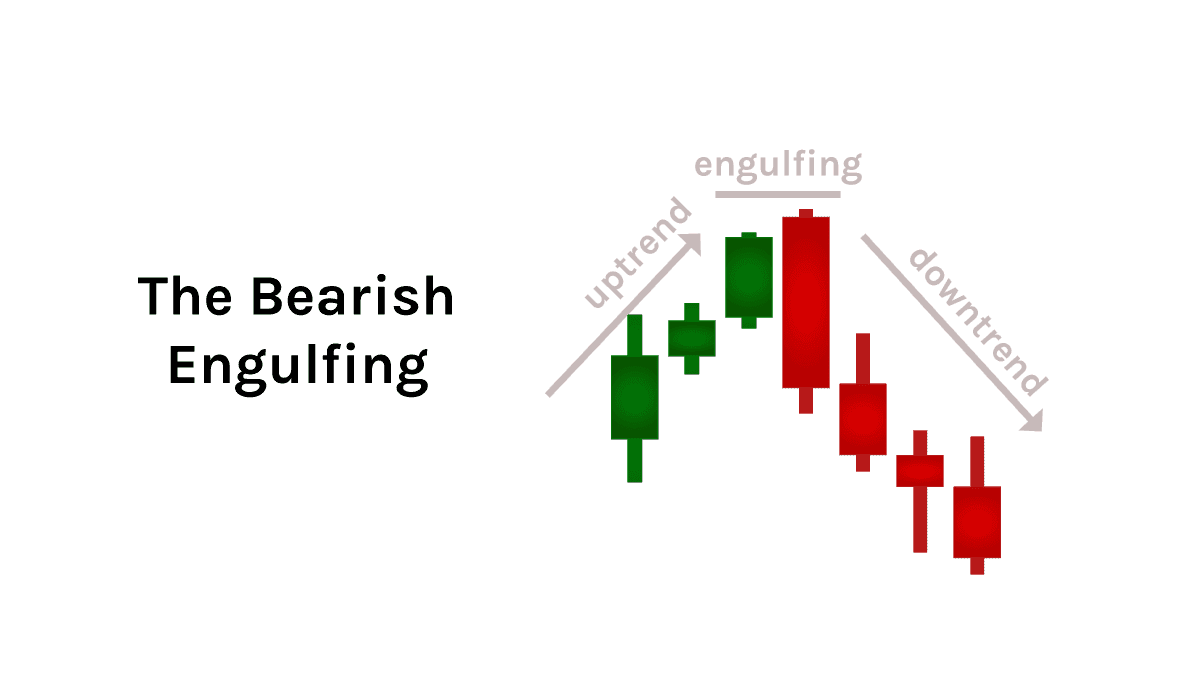
Bearish Engulfing
-
Appearance: Two candles at an uptrend’s peak: a small green candle followed by a larger red candle that engulfs the previous candle’s body. A gap may occur.
-
Meaning: Strong selling pressure overtakes buying, signaling a shift to bearish sentiment. For example, if BTC’s green candle closes at $62,000 and the next red candle opens at $62,200 and closes at $61,000, sellers dominate.
-
Signal: Start of a downtrend.
-
Combining Candlestick Patterns with Other Indicators
While candlestick patterns are powerful, they are most effective when used alongside other technical indicators like Relative Strength Index (RSI), Moving Averages, or Bollinger Bands. For example, a Bullish Engulfing pattern combined with an RSI below 30 (oversold) strengthens the signal for a potential uptrend. Experienced traders rely on multiple confirmations to reduce false signals and improve decision-making.
Conclusion
Candlestick patterns are essential tools for crypto traders, offering insights into market sentiment and potential price movements. Mastering patterns can enhance your trading strategy on Phemex, but success requires practice and caution. Combine these patterns with other technical indicators for stronger validation and always trade responsibly. Explore Phemex Academy for more trading resources.