

Most traders are familiar with the standard volume histogram found at the bottom of their charts such as the one below.

What is Volume Profile?
This histogram shows us the amount of volume transacted per candle. This will change to show us the volume of whichever candle periodicity we select. For example, If we are looking at a four-hour chart we are seeing the total volume transacted during each four-hour period.
How to use Volume Profile for Trading?
Volume is definitely one of the most important things that a trader should always be aware of, but this type of volume feedback leaves a lot to be desired. To best convey this let us take a look at a single day on the chart and the corresponding volume below it.
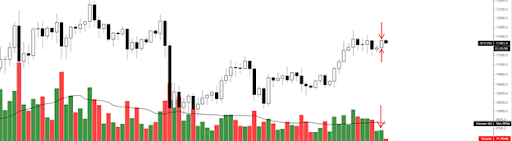
This volume bar shows us the volume in total for that daily candle, but it does not tell us anything about how that volume was distributed throughout that structure and throughout that specific period. This is where volume profile comes in.
In the image below we have the exact same day as highlighted above, yet instead, we can now see how volume was distributed throughout the day. We get a more atomized look at which prices the most amount of volume was transacted.

We can see that on this particular day, most of volume was distributed in a relatively balanced and even manner. The extended red line is the price level in which the most volume was transacted, this is known as the Volume Point of Control, or “POC”. The area that is slightly darker in the distribution is known as the Value Area, or “VA”, this is where 70% of the trading activity took place during the day.

Volume Profile for Longer Time Frames
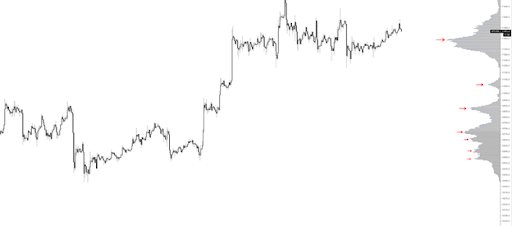
Now mind you, this does not need to be applied to a single day; it can be applied over a weekly structure, a four-hour structure, or any measure of time. In the image below we can see how volume was distributed over the course of a visible range going back to September 28th. In the profile, we can see where the high volume nodes (HVN) are located, as well as where the low volume nodes (LVN) are located. The high volume nodes are indicated by the red arrows. The low volume nodes are the depressions between those levels where there is little to no volume reading at all.
Why use The Volume Profile Structures?
Indicators for Support or Resistances
By using this chart we can see where most of the activity took place over the course of a structure. High Volume Nodes, or areas with high activity, will likely act as points of friction for any future price interactions. Areas of low volume are often areas where price will typically speed up if accepted within. More often than not, if we see price make its way into one of these lower volume areas and not get firmly rejected, we will just make our way to the next area of liquidity or HVN.
In a way, this can be used to identify supports or resistances that might not otherwise be obvious.
Moving Average
This tool can also allow us to find the areas that are most important to consider when moving within a range. At any given time it is not a specific price level that may be important, but rather where price was accepted the most over time, or more importantly where buyers and sellers were in most agreement and willing to do business. This is where the value area comes in, and where you will find the point of control located.

For example in the image below we can see that most of the volume (70%) was transacted between the levels of 11478 and 11305. Theoretically speaking, this is where price was accepted the most and therefore where fair value is located. This is also where the most liquidity can be found.

The areas above and below where volume dropped off can potentially be considered as locations at which volume dried up i.e. buyers and sellers became less interested. Therefore when already within the range, those levels can be used as possible turning points to take trades off of, as well as to look to for signs of chance and a potential breakout.
These are just a few of the many ways in which price specific volume can be used to improve your analysis. In crypto trading, there is a saying that volume must confirm price. When looking at specific levels using the Volume Profile we can see at exactly which prices the market was most interested in.
By Ryan Scott (@CanteringClark)
Learn to use technical analysis to improve your crypto trading skills:
Understanding trading volume in ranges and trends
Using the funding rate as a sentiment indicator
Read More
- Understanding Trading Volume in Ranges and Trends
- What Is Crypto Trading Volume: How It Affects Price
- What Is Volume-Price Trend? Bitcoin Trading With VPT
- What Is Net Volume Index: Indicator Of Real Market Sentiment
- What Is Volume Oscillator (VO) in Crypto Trading?
- On-Balance Volume Indicator (OBV): A Crypto Trading Strategy with OBV
- How to Measure Liquidity and Use It to Make Trading Decisions?
- Open Interest vs. Volume: What Are They and How Do They Work?