

Summary
- The Klinger Oscillator is based on two important factors: The “Exponential Moving Average” (EMA) and “Volume”.
- The Moving Average is a series of average prices based on the daily closing price of Bitcoin. Exponential Moving Average places an emphasis on recent price data.
- Volume is the sum of all Bitcoin bought and sold on the market. If more people are buying and selling Bitcoin, the price goes up. The volume compared to the EMA helps identify if the price rise is justified – minimizing the risk of faux breakouts.
- The Klinger Oscillator has two lines: “Klinger” (blue) and “Signal” (green). The Keltner line is based on a 35-period and a 55-period EMA. The signal line is based on a 13-period EMA.
- The Klinger line and signal line oscillate between positive and negative territory which indicates an uptrend or a downtrend.
- The Klinger line movement is not as important as the crossover between these two lines. When the blue line crosses the green lines, we can expect a major price reversal.
- If the Klinger line (blue) crosses above the signal line (green), the price is likely to go up and this presents a longing opportunity. If the Klinger line crosses below the signal line, this presents a shorting opportunity.
- The indicator can be combined with the Relative Strength Index (RSI) or the Stochastic Oscillator (StochRSI) to increase the accuracy of the signals.
- The Klinger Oscillator is available for all Phemex spot market and futures pairs.

What is The Klinger Oscillator?
The Klinger Oscillator is a momentum oscillator that measures the relationship between volume and price. The oscillator provides two lines: Klinger and signal. If the Klinger line crosses the signal line, we can expect a bullish outbreak or a bearish divergence. Traders that wants reliable buy and sell signals can use this indicator to trade Bitcoin (BTC) and altcoins.
Oscillator indicators appear below the Bitcoin chart and cross between positive and negative territory. The Klinger line is based on two moving averages: The 35-period EMA and the 55-period EMA. If the 35-period assumes a greater value, Bitcoin is in an uptrend. The Klinger EMAs compared to the volume in the formula dictate the movement, and once those two lines cross they signify buy/sell signals. The indicator detects the current trend and has historically proven accurate on the long-term charts for predicting price trends.
The high sensitivity to volume force and the EMA-derived data make it reliable for predicting both short-term and long-term trends. The oscillator can be used on long-term (1M, 1W, 1D) and short-term (4H, 1H, 15M) charts to predict price movement. The indicator can also predict price reversals with the volume measurements. If the price increase of Bitcoin is not backed by volume, this can lead to a false breakout and the Klinger oscillator would identify that.

What Makes The Klinger Oscillator Unique?
The Klinger Oscillator is unique because it combines both moving averages and volume. The Exponential Moving Average (EMA) places weight on recent prices, which provides signals in real-time and helps traders predict if the price will move up or down.
The oscillator is based on two EMAs: The 34-period EMA and the 55-period EMA. If we use it on the daily chart, it will calculate average prices for 34 days and 55 days. This gives us a better perspective on the current average compared to the historic average. Moreover, traders don’t have to manually add the volume indicator to see how volume correlates to the price because this indicator calculates it for them.

Klinger Oscillator technical analysis on the 1D (daily) chart.
The Klinger was highly reliable for predicting historic price movements. The indicator accurately predicted the rise of Bitcoin to an all-time high when the Klinger line moved above the signal line in September 2021. It was also reliable for predicting the May 2021 crypto crash. The combination of EMA and volume makes it stand out compared to indicators that rely on a single metric for predictability.
Who Invented The Klinger Oscillator?
The Klinger Oscillator was invented by Stephen J. Klinger, an American analyst. Klinger introduced the indicator in the “Stock and Commodities Magazine” in 1997. The indicator is named after him. Klinger was inspired by analysts such as Larry Williams who wrote research articles about the way volume impacts price trends.
Klinger stated that the indicator was developed to measure two separate goals: Signal tops and bottoms in asset prices, and measure the flow of money flowing in and out of an asset. The indicator can be used for stock trading and crypto trading. In historical context, it’s one of the newest indicators since it was introduced less than 30 years ago but it has proven accurate thus far.
What is Klinger Oscillator Formula?
The Klinger volume oscillator calculation is based on the Exponential Moving Average and the daily volume. The simplified formula is as follows:
(Volume * Trend) * 100
The total trading in Bitcoin and USDT determines the volume. The indicator measures if the volume is in an “accumulation” or a “distribution” stage. If the volume increased compared to the previous day, it’s considered accumulation. The “trend” is the subtracted 34-period EMA from the 55-period EMA.
The result of the Klinger Oscillator formula is multiplied times 100 to produce a result without decimal points. This formula is only used for the Klinger line. The signal line for the indicator is a 13-period EMA. The actual buy and sell signals are generated when these two lines cross.

How To Use The Klinger Volume Oscillator?
Let’s use Phemex platform for this demonstration. To get started, head to the Phemex spot or futures marketplace and select a trading pair. The indicator works on all trading pairs such as BTC/USDT or ETH/USDT. For this demonstration, we’ll use the Bitcoin pair:
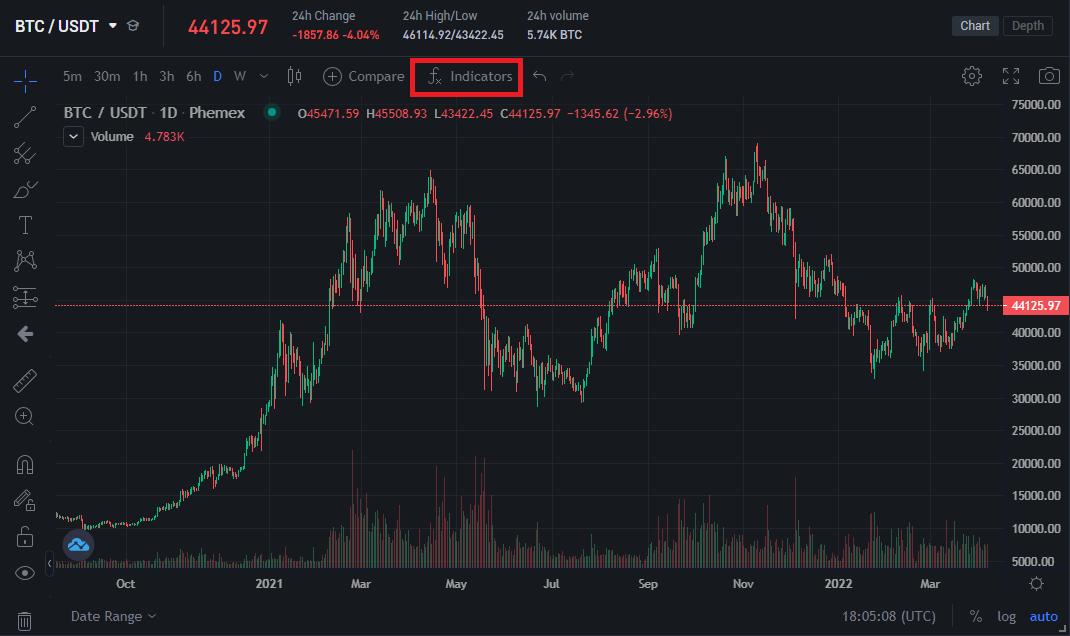
The Bitcoin daily chart with price-performance for the last two years.
Press on “Indicators” at the top (highlighted above) and search for “Klinger Oscillator”:

Locate the Klinger Oscillator by using our built-in search engine.
Left-click on the oscillator name and it will automatically load beneath the Bitcoin chart:

Klinger (blue) and Signal (green) on the positive/negative oscillator line.
The best settings for Klinger oscillator are the default settings, but adjustments to the color scheme can be made by hovering over the “Klinger Oscillator” in the bottom-left and pressing on “Settings”:

Adjust the Klinger oscillator settings and the precision details easily.
Select any color scheme to align it with other indicators. The “Precision” setting can add or remove decimal points. Traders who use Bitcoin trading bots can adjust the precision for triggering buy and sell orders.
How To Trade With the Klinger Oscillator?
The best Klinger oscillator strategy is to trade based on a crossover between the Klinger line (blue) and the signal line (green). The same strategy applies for long-term and short-term trading.
- Buy Signal: If the Klinger line crosses the signal line and goes above it – this is a buy signal. Long trades are recommended.
- Sell Signal: If the Klinger line crosses the signal line and goes below it – this is a sell signal. Short trades are recommended.
To demonstrate the effectiveness of this strategy, we can analyze price movements for the past few months:

The Klinger oscilator signals vs the Bitcoin price performance.
The Klinger line went above the signal line which triggered an uptrend. It then went below the signal line and triggered a downtrend. We can see a repeated pattern of accuracy for the indicator once the two lines cross.
At the present moment, the lines are deviated which indicates there’s no clear direction for the future price. Once those two lines cross, we can open a long or short trade accordingly. Note that the indicator can send mixed signals:

To minimize the risk of mixed signals and a faux breakout, a trader should wait patiently until the Klinger line deviates from the signal line completely. The trend is strongest when the lines cross and completely deviate in the northern or southern direction.
A smart trader can combine the indicator with other indicators such as the Relative Strength Index for increased accuracy:

The RSI indicator measures if Bitcoin is overbought or oversold. Bitcoin is currently oversold and the Klinger oscillator shows it’s trading sideways. If the Klinger line crosses the signal line and goes above, we can open a long trade – especially if this matches a rising trend on the RSI indicator.
Conclusion
The Klinger indicator is excellent for beginners and advanced traders because it accounts for two moving averages and trade volume to generate signals. A trader can easily find out when they should go long or short on Bitcoin. The signal line crossovers and divergences indicate trend reversals, and the deviation from the signal line measures the strength of those trends.
Some crosses can lead to false breakouts, making it difficult to predict which crossover is worth trading. To minimize the risk of a false signal, a trader can wait until the Klinger line deviates from the signal line on a long-term chart or use supplemental indicators such as the RSI indicator. If you’re ready to get started with the Klinger oscillator, read our beginner guide for placing trades on Phemex.
Read More
- Stochastic Oscillator: Everything You Need To Know
- What is Keltner Channel: Best Alternative to Bollinger Bands for Bitcoin (BTC)
- What Is Oscillator Trading: Top 5 Indicators To Use
- What Is Volume Oscillator (VO) in Crypto Trading?
- What Is Ultimate Oscillator: Trade With Multiple Timeframes
- What is Chande Momentum Oscillator (CMO): An Alternative to the RSI Indicator
- Awesome Oscillator: An Indicator for New and Experienced Traders
- What is Chande Kroll Stop: Stop-Loss and Take-Profit Strategy