


Fibonacci retracement is a popular tool in crypto trading used to identify potential support and resistance levels based on the Fibonacci sequence. From Bitcoin to altcoins, traders apply Fibonacci retracement levels to gauge where prices might pull back or reverse during trends. This guide will explain the origins of Fibonacci retracement, how it works in the crypto markets, how to draw and use Fibonacci levels, and updated strategies (with examples from 2024–2025) to improve your trading. By the end, you’ll understand how to use Fibonacci in trading and integrate it into a broader strategy for better decision-making.
What Is Fibonacci Retracement? (Crypto Trading Explained)
Fibonacci retracement (often called “Fib retracement”) is a technical analysis tool that helps predict areas where an asset’s price might stall or reverse. It is derived from the Fibonacci sequence, a string of numbers identified by mathematician Leonardo Fibonacci in the 13th century. The key Fibonacci ratios used by traders are expressed as percentages: 23.6%, 38.2%, 50%, 61.8%, 78.6%, and 100%. These percentages represent how far a price has retraced from a previous move. For example, if Bitcoin rallies from $20,000 to $30,000, a drop back to $27,640 would be a 23.6% retracement of that $10,000 move.
Why these numbers? Fibonacci ratios stem from the mathematical relationships in the Fibonacci sequence. Notably, 61.8% (often called the “Golden Ratio”) is the ratio of one Fibonacci number to the next (after the first few in the series). The 38.2% ratio is the complement of 61.8% (100% – 61.8%), and 23.6% is roughly the ratio of a number to two places to its right in the sequence. The 50% level isn’t a true Fibonacci ratio but is included because markets often retrace about half of a major move. Together, these levels create a grid of horizontal lines when plotted on a chart, indicating potential support (during a pullback in an uptrend) or resistance (during a bounce in a downtrend) areas.
In crypto trading, Fibonacci retracement levels are valued for their ability to highlight likely zones of price reaction. Traders view them as psychological levels where many market participants anticipate a reaction, making them somewhat of a self-fulfilling prophecy. Prices in highly traded assets like Bitcoin and Ethereum often pause or reverse near these Fib levels simply because so many traders watch them. This dynamic is especially evident in the volatile crypto market, where dramatic swings are common and Fibonacci levels often align with where traders collectively step in or take profit.
Origins of the Fibonacci Sequence and Trading Use
The Fibonacci sequence consists of numbers where each is the sum of the two preceding ones: 0, 1, 1, 2, 3, 5, 8, and so on. This sequence is common in nature, seen in leaf arrangements and seashell spirals, and its ratio of successive numbers approaches 0.618 (the Golden Ratio), valued for its aesthetic properties. Traders have adopted Fibonacci ratios (like 38.2% or 23.6%) in financial markets, believing that market behavior mirrors natural patterns.
In crypto, Fibonacci retracement is a popular tool, often working because many traders use these levels. This creates self-fulfilling support or resistance zones as traders anticipate price reactions at specific Fib levels. However, it’s not a precise science; interpretations can vary, and prices might not always adhere to these levels. Still, Fibonacci tools are useful for analyzing price action in the volatile crypto market.
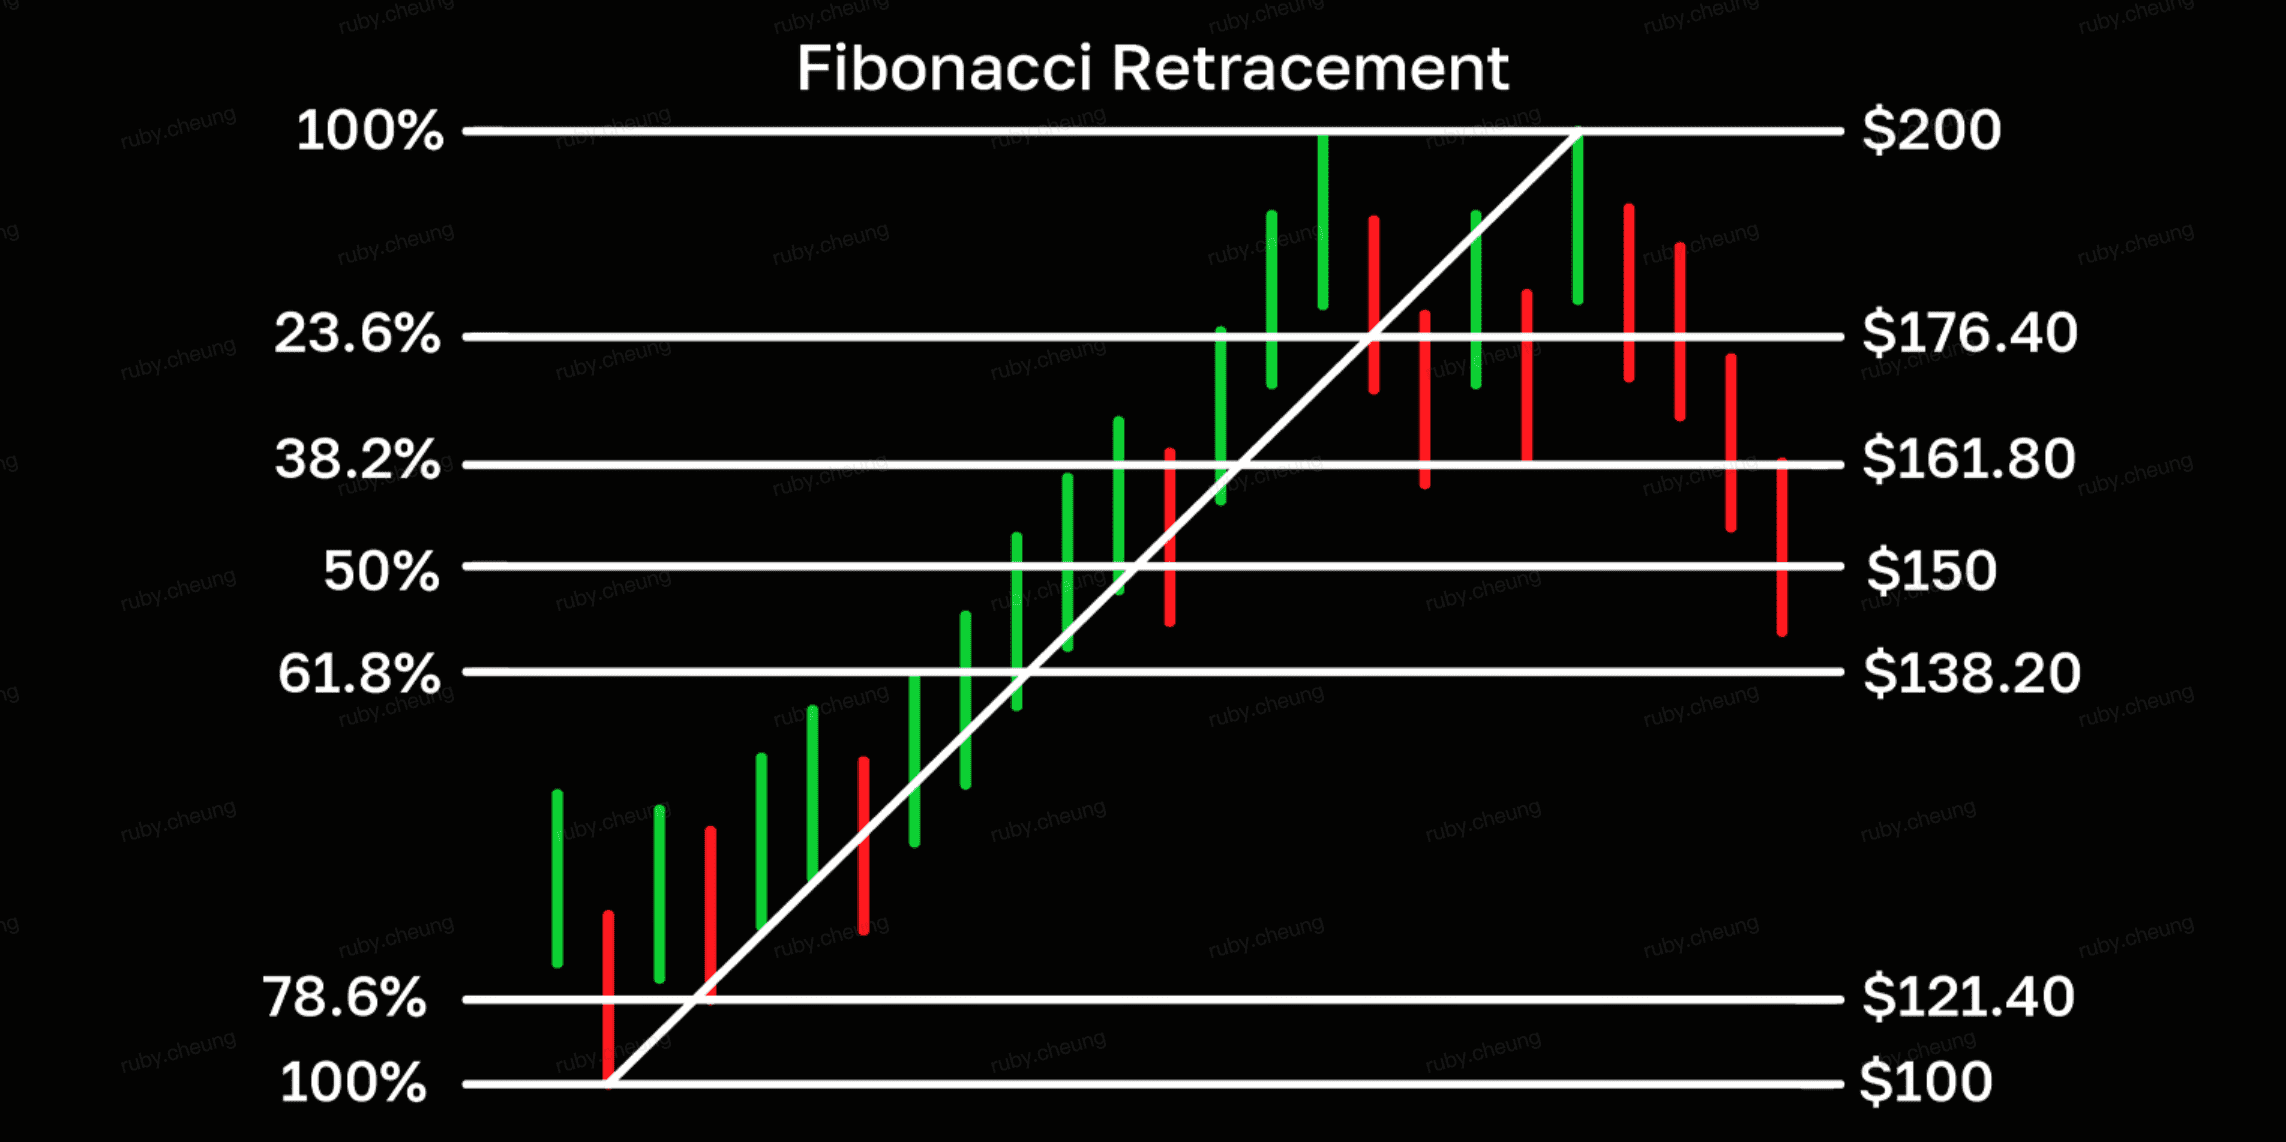
Fibonacci Retracement (source)
How to Draw Fibonacci Retracement Levels on a Chart
Drawing Fibonacci retracement levels effectively is essential for meaningful analysis. Here’s a concise guide to plotting Fibonacci retracement on crypto charts:
1. Identify the Trend and Key Swing Points: Determine the price move to analyze, such as from a recent high-to-low in a downtrend or low-to-high in an uptrend. For example, if Ether (ETH) moves from $1,000 to $1,500, this is your reference for levels.
2. Select the Fibonacci Tool: On platforms with charting like Phemex, use the “Fibonacci Retracement” tool. For an uptrend, click the swing low and drag to the swing high. In a downtrend, do the opposite to ensure correct plotting.
3. Review the Levels: The tool generates lines at 23.6%, 38.2%, 50%, 61.8%, and 78.6% of the range. These serve as potential support or resistance levels. For the ETH example, key levels include 50% at $1,250 and 61.8% at about $1,309.
4. Adjust as Needed: Ensure you select significant swing points. Minor price moves can create misleading levels, so focus on clear highs and lows.
5. Interpret the Levels: Observe price behavior around these levels. A well-drawn Fibonacci retracement shows where price may stall or reverse. In our ETH example, if it retraces to $1,309 and then rises, that shows the significance of the 61.8% level.
Tip: Many traders also use Fibonacci extensions for projecting future targets after a breakout.
Understanding Fibonacci Retracement Levels and Their Significance
Each Fibonacci level serves as a checkpoint for a trend's retracement:
-
23.6% Retracement: A shallow pullback indicating strong momentum; often marks minor dips before buyers re-enter.
-
38.2% Retracement: A moderate pullback seen as the first line of defense for a prevailing trend and a common buying opportunity in crypto rallies.
-
50% Retracement: A normal correction point suggesting equal profit-taking and buying, with many traders setting buy orders here.
-
61.8% Retracement: The Golden Ratio, a critical level where a bounce suggests trend continuation. A breakthrough could signal a deeper reversal.
-
78.6% Retracement: Near-complete retracement; often leads to double-bottom patterns. Considered the last strong Fib level before a full 100% retracement.
-
100% Retracement: Indicates a full reversal; the previous trend is completely nullified.
These levels can act as support or resistance depending on the trend's direction. Traders often look for clusters of Fibonacci levels coinciding with other technical factors for confirmation, noting that these are guidelines rather than guarantees. Additional tools like candlestick patterns and momentum indicators are often used for validation.

Fibonacci Sequence Ratios (source)
Why Do Fibonacci Retracements Matter in Crypto Trading?
-
Identifying Support and Resistance: Crypto markets can be volatile, making Fibonacci levels essential for determining predefined support and resistance zones, especially when assets reach new all-time highs. They help traders identify potential resting spots for a price correction.
-
Risk Management and Entry Planning: Traders often use Fibonacci retracements to strategically enter positions during pullbacks. For instance, rather than chasing a rising coin, they might wait for a pullback to the 38% or 50% retracement as a safer entry, with a stop-loss just below the next Fib level. This approach enhances risk/reward by buying closer to support.
-
Psychological Benchmarking: In the sentiment-driven crypto market, traders often lean towards key percentages like 50% pullbacks, creating self-reinforcing patterns. Algorithmic trading strategies also frequently incorporate Fibonacci levels.
-
Universality Across Timeframes: Fibonacci retracements can be applied across different trading timeframes. Long-term investors might identify significant retracements from previous bull markets, while short-term traders can use them for timing bounce trades. However, it's crucial to integrate Fibonacci tools into a broader strategy to avoid narrow focus.
However, one must combine Fibonacci tools with a broader strategy for the best results. Used in isolation, they might cause tunnel vision. That leads us to how to actually use Fibonacci retracement in a trading strategy, along with other tools and confirmations.
How to Use Fibonacci Retracement in Your Trading Strategy
Using Fibonacci retracements effectively involves strategic application beyond just drawing lines. Here are key methods for incorporating Fib levels into crypto trading:
-
Trading the Bounce: Entering on Fibonacci Support
Buy during pullbacks in an uptrend when price hits a Fibonacci support level. For instance, if Cardano (ADA) is in an uptrend and falls to the 50% retracement at $0.40, wait for signs of stabilization (like reversal candlesticks) before entering. A stop-loss can be placed slightly below the 61.8% level.
-
Combining Fibonacci with Other Indicators (Confluence)
For higher probability trades, combine Fibonacci retracement with other technical signals. This is called confluence. Examples of powerful confluences:
-
Fib Level + Horizontal Support/Resistance: Look for Fib levels that align with historical support/resistance.
-
Fib Level + Trend Line: Check if Fib retracements coincide with trendlines for stronger support.
-
Fib Level + Moving Average: If a moving average aligns with a Fib level, it enhances significance.
-
Fib + Relative Strength Index (RSI): Use RSI to identify overbought/oversold conditions near Fib levels to signal potential bounces.
-
Fib + Volume Spike: A volume increase at a Fib level suggests strong buying interest and validates the level.
-
Multiple Timeframe Fibonacci Analysis
Analyze Fibonacci on different timeframes to find clustered support levels. If daily and weekly charts indicate support around a certain price, it becomes more significant. This approach can also aid in planning entries relative to broader trends.
-
Using Fibonacci Extensions for Targets
While retracements focus on pullbacks, extensions project potential price targets beyond prior highs/lows. Traders often aim for extension levels such as 1.618 to identify where price might pause. Use these levels as take-profit zones when trading Fibonacci retracement bounces.
-
Stop-Loss Placement Using Fibonacci
Fibonacci levels can guide stop-loss placement. Traders often set stops just below a Fibonacci level that would invalidate their trade. For instance, if buying at a 50% retracement, the stop might go just below the 61.8% level. The idea is that if the price drops below 61.8%, it indicates a deeper pullback and potential trend weakness. Using an ATR (Average True Range) as a buffer is advisable to avoid being stopped out by minor overshoots. Some traders bracket trades around Fib levels, placing tight stops slightly below 78.6% to create favorable risk/reward scenarios.
-
Patience and Confirmation
When trading with Fibonacci, it's important to wait for confirmation that a level is respected rather than placing orders blindly at key percentages. Look for price action signals, such as a double bottom at support or bullish divergence on RSI. Many experienced traders consider Fibonacci levels as zones rather than precise lines, suggesting that one should observe price behavior around these levels. If the price fails to bounce and moves swiftly through a level, it may indicate a deeper retracement is likely.
Real-World Examples (2024–2025) of Fibonacci Retracement
To appreciate how Fibonacci retracement remains relevant in 2024–2025, let’s look at a couple of examples from recent crypto market moves:
-
Bitcoin 2024 Post-Halving Rally: Suppose after the 2024 Bitcoin halving, BTC surges from $35,000 in early 2024 to $70,000 by mid-2024. A significant correction follows, bringing BTC down to around $52,000. Traders would recognize that as roughly a 50% retracement of the move (since 50% of the $35k gain = $17.5k drop from $70k, targeting $52.5k). Indeed, if buyers step in around the halfway-back point, it validates the Fibonacci framework. In this hypothetical, Bitcoin finding a floor at ~$52K and resuming an uptrend would illustrate how a classic 50% retracement provided a buy-the-dip opportunity. If instead BTC had fallen to about $45,000, that’s near the 61.8% retracement (~$45.8k) – another spot where reversal could be expected. Such scenarios have played out historically and are anticipated by traders.
-
Dogecoin Late 2025 Pullback: A specific example: In November 2025, Dogecoin (DOGE) was trading around $0.154, which aligned with the 50% Fibonacci retracement of its rise from 2022 to 2024. The fact that DOGE pulled back halfway after a big multi-year move put it on the radar of Fib traders. Analysts observed that a weekly candle closing above that 0.5 level signaled strength, and they started targeting the next Fibonacci zones: the 38.2% (~$0.117) as a lower support target and 61.8% (~$0.202) as an upper resistance target in case of a rebound. In other words, from $0.154, if DOGE were to drop further, $0.117 might be a strong support (38.2% retracement remaining) and if it were to rally, $0.202 could be a significant resistance (61.8% retracement from the top). This demonstrates how traders map out future scenarios using Fibonacci levels, essentially creating a game plan for both the upside and downside.
-
Ethereum 2025 Market Structure: By 2025, Ethereum transitioned fully to proof-of-stake and saw a substantial bull run alongside network upgrades. Let’s say ETH went from $1,000 to $5,000 through 2024. In early 2025 it corrects to $3,000. That’s a 40% drop, which is around a 61.8% retracement of the $4k rally (since 61.8% of $4,000 ≈ $2,472; $5k – $2,472 ≈ $2,528 target; ETH falling a bit more to $3k means about 50% retrace). If we refine: the 50% level of the move is $3,000 and the 61.8% is around $2,618. Ethereum might have bounced somewhere between these (perhaps multiple attempts). Such a deep retracement after a huge rally might scare some, but seasoned traders recall that in past cycles, Ethereum has often retraced 60%+ of its gains before starting the next leg up – marking those Fib levels as areas to accumulate. Indeed, by late 2025 Ethereum had over one million validators and robust network growth, so a pullback to Fib support might have been viewed as a buying zone by those with long-term conviction.
These examples underline that Fibonacci retracement remains a go-to tool in 2025, used by traders to navigate crypto’s notorious volatility. The key is that no matter how new or different market conditions are (be it increased institutional adoption or new all-time highs), human psychology and trading behaviors often rhyme with the past – and Fibonacci levels, being anchored in collective behavior, continue to be respected.

Fibonacci Retracement Swings (source)
Common Mistakes to Avoid with Fibonacci Retracement
Fibonacci retracements can be useful, but traders should avoid common pitfalls:
1. Using the Wrong Swing Points: Select significant swing highs and lows instead of minor fluctuations. If uncertain, look at the larger market structure for clarity.
2. Forcing Fib on Every Move: Not all price movements align with Fibonacci levels. Major news or momentum can cause markets to bypass these levels. Recognize when to seek other indicators instead.
3. Trading Against the Larger Trend: Using Fib retracements against a dominant trend is risky. It’s best to trade in the direction of the trend, such as buying dips in an uptrend.
4. No Confirmation/Blind Faith: Avoid setting orders solely at Fib levels without supporting evidence. Use Fibonacci as a guide and confirm with market sentiment and volume.
5. Ignoring Extreme Market Conditions: In volatile markets, Fib levels can be overshot. Allow for some “wiggle room” and place stop-loss orders slightly beyond these levels to account for volatility.
By steering clear of these mistakes, you can enhance your success with Fibonacci trading.
Limitations of Fibonacci Retracement
No tool is perfect. Here are a few limitations of Fibonacci retracement to keep in mind:
-
Subjectivity: Traders may choose different points for drawing Fibonacci lines, leading to variations in levels. Defining swings can be especially subjective in choppy markets.
-
Not a Standalone Predictor: Fibonacci analysis reveals potential support or resistance based on past price behavior but doesn’t guarantee future results. External factors can override these levels.
-
Mid-Range Ambiguity: Price may bounce at different Fibonacci levels (e.g., 38% or 61%), making it difficult to predict which will hold. Traders might split entries but risk missing out if the price only hits one level.
-
False Signals in Ranging Markets: Fibonacci retracements can be unreliable in sideways markets. Traditional support and resistance might work better in these conditions.
-
Self-Fulfilling Risk: The widespread use of Fibonacci by traders can lead to predictable behavior that market makers exploit. Use Fibonacci with caution and consider volume and context to identify meaningful breaks.
Despite these limitations, Fibonacci retracements remain popular among traders, especially in crypto. They should be part of a broader strategy rather than used in isolation.
Conclusion and Final Tips
Fibonacci retracement is a valuable method for crypto traders to identify support and resistance levels during trends. Its appeal lies in its simplicity, offering a quick visualization of potential market pauses by using mathematical ratios. In the fast-paced crypto environment, this insight aids in planning entries, exits, and risk management.
To effectively use Fibonacci retracement, traders should:
-
Identify key highs and lows on the chart for accurate retracements.
-
Treat Fibonacci levels as areas of interest, seeking confirming signals (like bounce patterns or volume spikes) before trading.
-
Align trades with the overall trend and look for confluence with other technical indicators (like moving averages).
-
Exercise patience—let the price come to desired levels, and have a solid plan with stop-loss and profit targets.
-
Adapt continuously, redrawing Fibonacci grids as new swing highs/lows emerge.
Fibonacci retracement remains popular partly because it addresses the psychological aspects of trading, offering objective reference points. However, it’s crucial to view these levels as zones rather than hard walls, using them to enhance risk management. By combining Fibonacci with patience and adaptability, traders can improve their chances of long-term success. Happy trading!