
Key takeaways
Harmonic patterns are XABCD patterns whose validity depends on meeting specific Fibonacci ratio requirements, not just visual similarity.
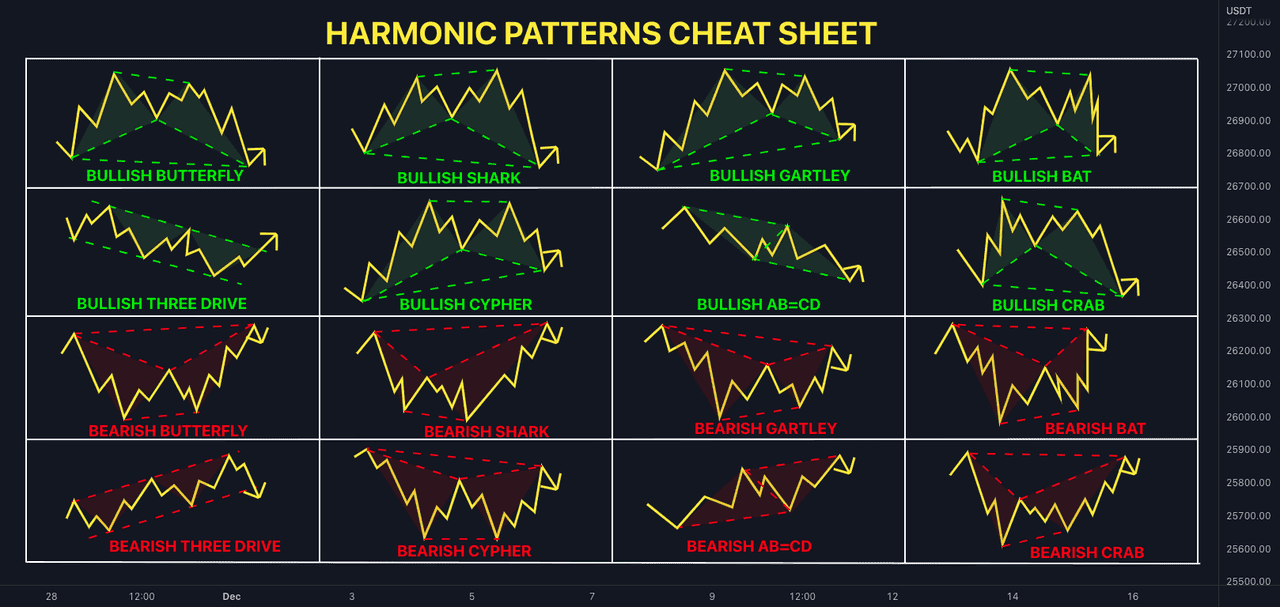
The most-used core set in crypto: Gartley, Bat, Butterfly, Crab, Shark, Cypher (bullish and bearish versions).
Harmonics are best treated as trade frameworks, not standalone signals. It’s best to add trend context, volume behavior, and momentum confirmation (RSI/MACD/OBV) plus multi-timeframe alignment.
Evidence for technical patterns is mixed: classic equity research shows patterns can contain incremental information but may not directly translate to “excess profits,” while crypto research finds technical signals can be predictive in certain regimes and can remain robust after transaction costs in some designs.
Harmonic patterns are a family of “measured” chart structures that combine geometry (XABCD swing legs) with Fibonacci retracement/extension ratios to forecast where price is statistically more likely to reverse or react. In practice, harmonic trading is less about predicting the future with certainty and more about building repeatable, rules-based trades with a clear Potential Reversal Zone (PRZ), predefined invalidation, and asymmetric risk/reward.
Harmonic patterns have deep roots in classical technical analysis, starting with the work of H. M. Gartley and later formalized with Fibonacci constraints by Scott M. Carney, who popularized the “Harmonic Trading” framework and defined several modern patterns and their PRZ logic.
Crypto markets are particularly fertile ground for harmonic setups because they are high-volatility, reflexive, and sentiment-driven, often producing sharp swing legs that can “fit” harmonic geometry. However, crypto’s volatility can also increase false completions and “wick breaks,” making confirmation and risk control non-negotiable.
Definition, History, and the Harmonic Trading Framework
What harmonic patterns are
At their core, harmonic patterns are structured swing sequences that map five pivot points (X, A, B, C, D) into four measured legs (XA, AB, BC, CD). Each leg has an expected Fibonacci retracement or extension relationship to other legs, and those relationships define both (a) the pattern’s name and (b) its completion zone (PRZ / PCZ) where traders anticipate a reversal or reaction.
Many chart patterns are “recognition first, measurement second.” Harmonic patterns flip that: they are “measurement first.” If the ratios do not match—especially the B-point and the completion (D-point)—then the trade thesis is weak, even if the shape looks right.
Where harmonic trading came from
The historical lineage typically runs:
Gartley’s framework (often called the “Gartley 222”) was outlined in Profits in the Stock Market (1935) and later became the template structure for Fibonacci-based harmonics.
Later authors such as Larry Pesavento emphasized pattern recognition with Fibonacci projections, helping popularize “measured moves” and Fibonacci clusters among discretionary traders.
Scott M. Carney formalized a more systematic methodology (PRZ/PCZ logic, pattern families, strict ratios, and trade management rules) and is broadly credited with coining and popularizing “Harmonic Trading” as a defined approach.
Some patterns also cite other contributors, e.g., Carney attributes the general extension structure of the Butterfly to Bryce Gilmore while crediting his own work for defining exact ratio alignments that became industry standards.
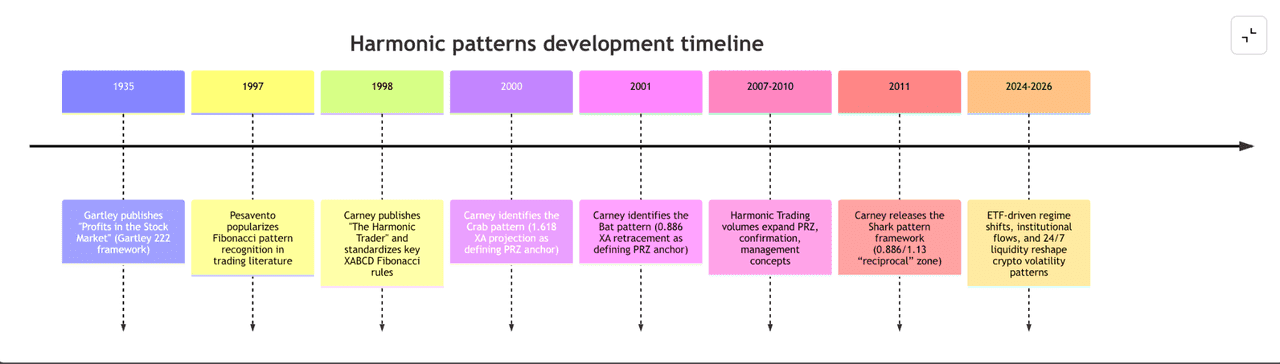
Harmonic Pattern Development Timeline
PRZ, confluence, and why harmonics are “tradeable”
The defining “edge” of harmonic trading is the Potential Reversal Zone (PRZ) / Pattern Completion Zone (PCZ). Rather than buying or selling because price “looks extended,” harmonics asks:
Where do multiple Fibonacci measurements cluster?
Does that cluster align with structure (support/resistance), trend context, and momentum exhaustion?
If price invalidates the PRZ, where is the hard stop?
This PRZ logic is explicitly described as a confluence cluster of retracements, projections, and AB=CD symmetry in both harmonic trading literature and structured harmonic pattern education sources.
Core Harmonic Patterns and Fibonacci Ratio Rules
This section provides the “rules book” for the six core patterns. Use these ratios as validation constraints, not after-the-fact explanations.
Fibonacci ratio sets used most often in harmonics
Harmonic patterns predominantly use a small set of Fibonacci-derived ratios:
Retracements: 0.382, 0.5, 0.618, 0.786, 0.886
Extensions/projections: 1.13, 1.272, 1.618, 2.0, 2.24, 2.618, 3.14, 3.618
These numbers are commonly referenced as key ratio sets in harmonic trading education and are central to PCZ construction.
Gartley pattern rules
The Gartley is the foundational XABCD harmonic. Two defining constraints dominate:
B must be a 0.618 retracement of XA.
D must be a 0.786 retracement of XA (and must not exceed X in a valid structure).
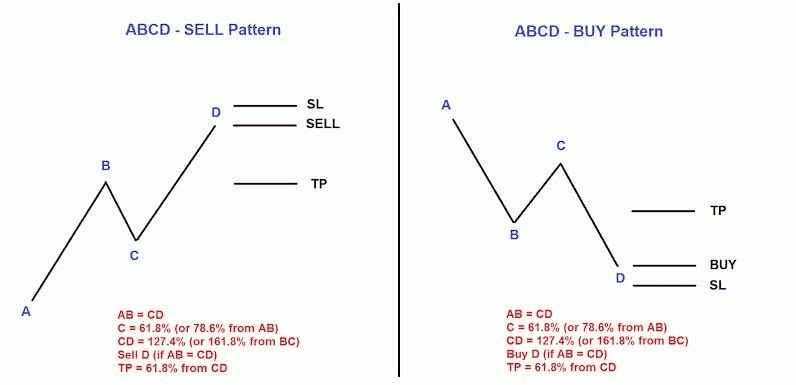
A quality Gartley also tends to show AB=CD symmetry converging near the PRZ plus a BC projection (often 1.27 or 1.618) that “clusters” with the XA retracement.
Bat pattern rules
Carney describes the Bat as a highly accurate harmonic pattern with a defining PRZ anchored on the 0.886 XA retracement:
B retracement must be less than 0.618, ideally 0.382 or 0.50 of XA.
The PRZ incorporates 0.886 of XA as the defining level.
BC projections must be at least 1.618 (often 1.618 or 2.0, up to 2.618), and the Bat typically includes an AB=CD (often extended, e.g., 1.27 AB=CD).
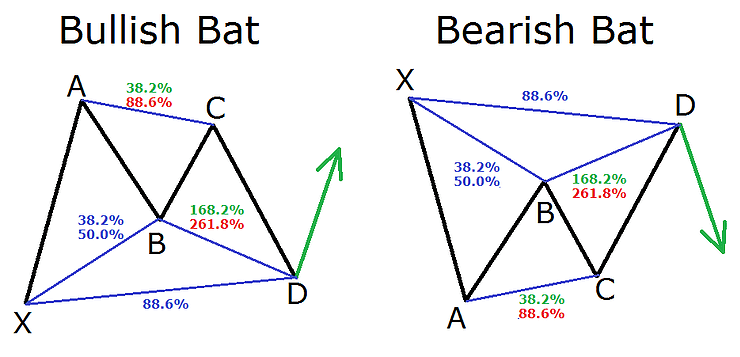
Harmonic Bat Patterns (source)
Butterfly pattern rules
The Butterfly is a classic extension pattern, distinguished by:
Mandatory B = 0.786 retracement of XA.
A 1.27 XA projection as a critical PRZ element, often paired with BC projections (commonly 1.618 and sometimes “extreme” projections like 2.0, 2.24, 2.618).
AB=CD symmetry is typically expected as a minimum requirement.
Crab pattern rules
The Crab is an extension pattern explicitly defined by the 1.618 projection of XA as the PRZ anchor:
D completion uses 1.618 XA projection (the “defining level”).
The PRZ is complemented by extreme BC projections, commonly 2.618, 3.14, 3.618.
AB=CD exists but is less important than the XA extension + BC projections in this pattern family.
Shark pattern rules
The Shark differs from classic “M/W” harmonics; Carney frames it as a structure that often precedes a 5-0 formation and relies heavily on the 0.886 retracement and 1.13 reciprocal extension zone, with an “Extreme Harmonic Impulse Wave” employing at least a 1.618 extension.
More explicit rule sets commonly cited in harmonic education describe:
AB between 1.13 and 1.618 of XA
BC around 1.13 (113%) of OX
CD often targets 0.5 retracement of BC
These conventions are consistent across major harmonic references, though you should treat Shark trades as faster, more tactical reactions than Gartley/Bat setups.
Cypher pattern rules
The Cypher pattern is widely linked with harmonic trading and uses a clean, teachable ratio set:
B = 0.382–0.618 retracement of XA
C = 1.272–1.414 extension of XA
D = 0.786 retracement of XC
It is frequently described as “advanced but structured,” and it is often traded similarly to other XABCD patterns—entry around D with strict invalidation and staged targets.
Trade Harmonic Patterns on Phemex
How to Trade Harmonic Patterns
Harmonics are fundamentally reversal-zone trades. You’re not buying because price “is cheap”; you’re buying because multiple measurements imply a defined zone where you can take a risk-defined position.
Entry logic: aggressive vs conservative
A common harmonic entry spectrum looks like this:
Aggressive entry: limit order inside PRZ (best price, highest false-positive risk).
Confirmation entry: wait for reversal evidence at/near PRZ (higher win rate, worse entry).
Many harmonic guides recommend waiting for price action confirmation—especially in high-volatility assets—because harmonic levels can be pierced briefly before a real reversal occurs.
Stop placement: PRZ invalidation, not “hope”
Harmonic stops are structured:
Place the stop just beyond the PRZ (tight but meaningful).
Or place the stop at the “hard invalidation,” often beyond X (wider).
Phemex’s harmonic-pattern guide emphasizes that one advantage of harmonic structures is that they naturally suggest stop zones “just beyond the PRZ,” while acknowledging volatility can still sweep these levels.
Targets: measured moves, structure, and staged exits
Common harmonic target frameworks include:
T1: Point C (prior swing)
T2: Point A (major swing boundary)
Alternative measured move: partials at Fibonacci retracements of CD/AD (e.g., 0.382 and 0.618), depending on your playbook and timeframe
Investopedia’s harmonic examples frequently frame targets around prior swing points (C) with invalidation near X for several classic patterns.
Confirmation tools for higher-quality harmonic trades
Because harmonic shapes can be overfit, confirmations improve selectivity:
Trend context: Is the harmonic a counter-trend reversal, or a pullback continuation?
Momentum: RSI or MACD divergence at D can support exhaustion.
Volume + OBV: A PRZ test on fading sell volume (bullish) or fading buy volume (bearish) is typically more reliable than a PRZ test with expanding volume against you. The idea that volume-conditioning can change the statistical characteristics of patterns is consistent with broader technical analysis research emphasizing joint price/volume information content.
Multi-timeframe confluence: A lower-timeframe harmonic completing into a higher-timeframe support/resistance zone is usually better than a “floating” PRZ.
Risk management and position sizing for harmonic trades
Harmonic setups can look “tight,” which tempts traders into oversizing. A safer approach:
Define risk per trade (often 0.5%–2% of account equity for active trading).
Define stop distance from entry (in $ or %).
Size the position so a stop-out equals your predefined risk.
A simple sizing formula:
Position size = (Account risk in $$) / (Stop distance in$$ per coin/contract)
If you scale into the PRZ (common in harmonics), treat each entry layer as part of one “risk unit” so total exposure doesn’t exceed your maximum loss on the idea.
BTC and ETH market examples
Crypto’s most-traded assets provide useful “regime” context for harmonic trading:
In early 2024, Bitcoin broke to new cycle highs amid spot ETF inflows, reaching records above $72k in March.
In 2025, Bitcoin made repeated new highs, including a Reuters-reported record around $109,760 (May 2025) and later above $125k (Oct 2025).
In early 2026, Bitcoin experienced sharp drawdowns, with Reuters reporting a drop to roughly $63k in early February 2026 and large liquidation spikes, highlighting the “wick risk” around PRZ levels.
To make this concrete, here are two worked PRZ-mapping examples using real reported pivot levels. These are not claims that a textbook harmonic completed perfectly on those exact timestamps—rather, they show how harmonic traders convert macro pivots into actionable Fibonacci zones.
Example mapping: BTC swing framework (2025–2026)
Macro high: ~$125,245 (early Oct 2025).
Major low: ~$63,296 (Feb 5, 2026).
If you treat this as the dominant swing, harmonic and Fibonacci traders often mark key retracement bands from the high:
0.618 retracement zone and 0.786 retracement zone (potential “B” or “D” anchors in retracement-based harmonics, depending on intermediate pivots and leg sequencing).
Then look for a secondary sequence of swings that forms AB and BC legs, creating a PRZ cluster.
This matters because modern crypto microstructure has shifted: institutional flows and ETF-driven liquidity concentrate activity in certain windows, which can change volatility rhythms and price behavior around key levels.
Example mapping: ETH volatility + regime context
Early 2024 saw ETH surge above $3,200–$3,800 zones alongside Bitcoin’s rally.
By March 2, 2026, ETH trades near ~$1,955, reinforcing why harmonic “tight stops” must be calibrated to volatility and timeframe.
A practical takeaway: in crypto, higher-timeframe harmonics (4H, 1D, 1W) often outperform 5–15 minute harmonics because microstructure noise creates frequent “near-misses.”
Harmonic Patterns (source)
Evidence, Reliability, and Backtesting in Crypto vs Equities
A rigorous view of harmonics separates three questions:
Do visual patterns contain information?
Can that information translate into tradeable edges after costs?
Does crypto behave differently than equities?
What “evidence” exists for technical patterns generally
In one of the most-cited academic studies on technical pattern recognition, National Bureau of Economic Research working paper (later Journal of Finance) authors argue technical analysis is subjective (“in the eye of the beholder”) and propose algorithmic pattern recognition to make testing feasible. They find that certain technical patterns provide incremental information, especially in Nasdaq stocks, while cautioning this does not automatically imply excess profits.
This matters directly for harmonic traders: false harmonics frequently arise from subjective swing selection, and algorithmic detection can help enforce consistent definitions.
Evidence for technical signals in crypto
Crypto market research increasingly shows that systematic signals linked to trend and technical features can be predictive:
A peer-reviewed finance paper introduces CTREND, a trend factor built from price/volume information across horizons, and reports that the signal reliably predicts cryptocurrency returns, remains robust across subperiods, and survives the impact of transaction costs in liquid coins.
Another finance study on crypto technical analysis returns (moving average rule families) finds that adjusted returns can be influenced by macro drivers (e.g., VIX) and can behave differently during bubble vs non-bubble regimes.
These studies do not test harmonic patterns specifically, but they support a more general conclusion: technical structure can carry information in crypto, especially when you account for regime shifts and costs.
How ETFs and institutional structure influence harmonic reliability
Several post-2024 findings are relevant to harmonic trading:
An open-access academic study finds a positive impact around the introduction of U.S. spot Bitcoin ETFs on spot returns for major coins and reports decreased volatility for Bitcoin and XRP in the post-event window, supporting a “stabilization” hypothesis in those cases.
Market structure research notes spot ETF liquidity improvements are concentrated on U.S. venues and U.S. trading hours, creating a risk of increased volatility outside those windows. For harmonic traders, this matters because PRZ tests during low-liquidity hours can be “wicky,” increasing stop-outs.
On-chain research argues Bitcoin’s volatility has been stabilizing in some periods and that institutional demand is reshaping cycle rhythm—yet early 2026 still demonstrates sharp drawdowns and liquidation events.
A realistic conclusion on “does harmonic trading work?”
Harmonics can work as structured trade templates (defined zones + invalidation + targets).
Their reliability depends heavily on pattern quality (ratio accuracy + confluence), market regime, and execution costs (fees + slippage).
In crypto, volatility and 24/7 liquidity can increase both (a) opportunity frequency and (b) false completions.
If you choose to backtest harmonics, you must predefine:
swing-point algorithm (e.g., ZigZag parameters),
allowed tolerance bands,
entry triggers (touch PRZ vs reversal confirmation),
stop rule,
targets,
fee/slippage model, and then run out-of-sample tests to avoid look-ahead bias.
Common Pitfalls and Practical Tools
Common pitfalls that create losing harmonic trades
Forcing patterns by moving pivots
If you shift X or A repeatedly to make ratios fit, you’re no longer trading a harmonic pattern—you’re retrofitting a story. The subjectivity problem is a well-known weakness of visual technical analysis.
Ignoring the defining anchor
Gartley: if B isn’t ~0.618 and D isn’t ~0.786, it isn’t a Gartley in the Carney-standard sense.
Bat: if D isn’t near 0.886 of XA, the pattern loses its defining edge.
Crab: if D isn’t near 1.618 extension of XA, the pattern is misclassified.
Overconfidence in tight stops Harmonics often “suggest” tight stops beyond PRZ, but crypto’s volatility can pierce levels before reversing. The solution isn’t wide stops; it’s correct timeframe selection, confirmation, and measured sizing.
Trading the PRZ without confirmation in high-vol regimes Sharp liquidation-driven moves (documented in early 2026) can slice through PRZ levels and invalidate patterns quickly.
Best-practice checklist for higher-quality harmonics
A high-quality harmonic trade tends to have:
Clean XA impulse leg on an appropriate timeframe (4H+ preferred for most traders),
Exact or near-exact B and D anchors,
A PRZ that is a cluster (XA + BC + AB=CD + structure),
Confirmation (momentum divergence and/or volume/OBV behavior),
A defined invalidation point and a realistic profit plan.
Trade Harmonic Patterns on Phemex
FAQ
Are harmonic patterns bullish or bearish? Both. Each harmonic structure has a bullish and bearish version. The defining difference is the direction of the final CD leg and the expected reversal at D.
Which harmonic pattern is most accurate? Many traders consider the Bat highly accurate based on its strict PRZ anchor (0.886 XA) and tight risk structure, and Carney explicitly describes it as one of the most accurate patterns in his framework. That said, “accuracy” varies by market regime and execution quality.
Do harmonic patterns work better in crypto or equities? There is stronger academic literature on pattern recognition and technical structure in equities, with findings that patterns can contain incremental information. Crypto research suggests technical signals can also be predictive and sometimes robust after costs, but crypto’s regime shifts and volatility can increase false signals.
What timeframe is best for harmonic patterns? Many traders prefer higher timeframes (4H/1D/1W) because small timeframes contain more noise and more false swing pivots. This is especially relevant in crypto due to 24/7 trading and liquidation-driven volatility.
What is the PRZ in harmonic trading? PRZ (Potential Reversal Zone) or PCZ (Pattern Completion Zone) is a confluence cluster of Fibonacci measurements (retracements, extensions, and AB=CD symmetry) where the pattern is expected to complete and potentially reverse.
Do I need a harmonic pattern scanner? Not required, but scanners and drawing tools can help reduce subjectivity and improve consistency—especially when learning.