
Chart patterns are a cornerstone of technical analysis, and triangle patterns are among the most important for crypto traders to understand. Triangle patterns form when price action is squeezed between converging trendlines, creating a triangle shape on the chart. They often signal a potential continuation or breakout of the prevailing trend. In the volatile world of Bitcoin and cryptocurrencies, triangle patterns appear frequently and can provide valuable clues about upcoming price movements. This guide will explain the three main types of triangle patterns – ascending, descending, and symmetrical – with updated examples from recent Bitcoin price cycles (2024–2025) and tips on how to trade them. By the end, you’ll know how to spot these patterns and use them to anticipate Bitcoin’s next move or similar trends in other crypto assets.

What Are Triangle Patterns?
Triangle patterns are a category of chart pattern that indicates a period of consolidation before the price breaks out. In a triangle, the price range narrows over time, as marked by two trendlines: one connecting the highs and one connecting the lows. These trendlines eventually converge toward an apex, giving the appearance of a triangle.
Triangles are typically classified as continuation patterns. This means they often occur in the middle of a trend and signal that, after a brief consolidation, the prior trend (uptrend or downtrend) is likely to resume. However, depending on their shape, triangles can have a bullish, bearish, or neutral bias.
The three primary types of triangle patterns in crypto trading are:
-
Ascending Triangle – Typically bullish continuation pattern.
-
Descending Triangle – Typically bearish continuation (or reversal) pattern.
-
Symmetrical Triangle – Neutral pattern (direction can be either up or down, often continuing the prior trend).
Triangles form due to the tug-of-war between buyers and sellers reaching a point of indecision. As the pattern develops:
-
Volume often contracts (drops) during the formation of a triangle, reflecting that trading activity is slowing as the range tightens.
-
Eventually, breakout happens when either buyers or sellers decisively take control, pushing the price out of the triangle’s confines. This is usually accompanied by a volume increase confirming the breakout direction.
Traders value triangles because they provide clear visual levels to watch: the converging support and resistance lines. When price finally breaks those levels, it offers a potential trading signal.
Triangles have been common on Bitcoin’s price charts historically, which is why many refer to them in context of BTC (e.g., “Bitcoin triangle pattern”). They also appear on charts of Ethereum, altcoins, stocks, and other assets – the principles are universal. Let’s dive into each type.
The 3 Types of Triangle Patterns in Crypto
-
Ascending Triangle (Bullish)
An Ascending Triangle is a bullish continuation pattern that forms during an uptrend, characterized by a flat resistance line on top and a rising support line below. This indicates that buyers are gaining strength, consistently pushing prices up from higher lows while repeatedly testing a fixed resistance level.
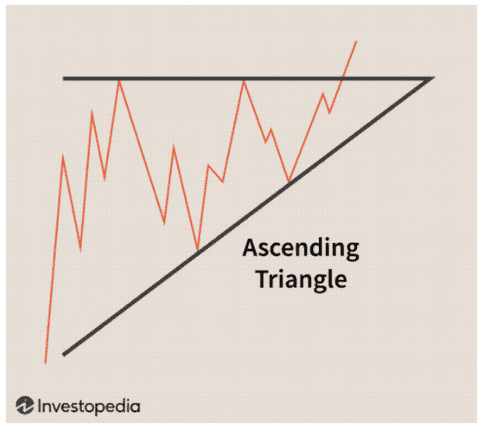
Market Psychology: Sellers dominate at the resistance level, but buyers remain optimistic, creating higher lows. This builds pressure that typically results in a breakout above the resistance.
Trading the Breakout: Wait for a clear break above the horizontal resistance, ideally accompanied by increased volume. Once the breakout occurs, the former resistance often turns into support. A common price target is to measure the triangle's height and add it to the breakout point.
Example - Bitcoin 2025: In mid-2025, Bitcoin formed an ascending triangle below $120,000, making higher lows while testing that resistance. Once it broke above with strong volume, a significant rally ensued, showcasing the bullish potential of this pattern.
Performance: Historically, ascending triangles show a 70–75% success rate in bullish conditions, making them reliable indicators. However, risk management is essential, as they can fail about 25–30% of the time.
Trading Tips:
-
Wait for a breakout before acting, unless you're using an advanced anticipation strategy.
-
If entering early, consider placing a stop-loss below the last higher low. For instance, in an ascending triangle with higher lows of $110k, $112k, and $115k, a stop could be set slightly below $115k to guard against a potential failure.
-
Descending Triangle (Bearish)
A Descending Triangle is a bearish pattern characterized by a flat support line at the bottom and a descending resistance line on top. It indicates a steady support level where buyers enter, but subsequent bounces off the support become lower as sellers push prices down with lower highs.
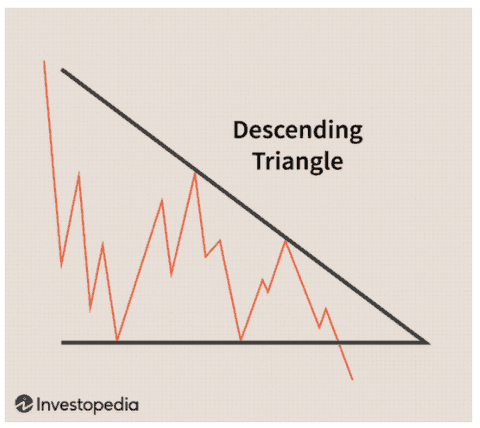
Market psychology: Buyers establish a price floor at support, demonstrated by repeated bounces. However, sellers are increasingly dominant, selling earlier and at lower prices, signaling a weakening of the bullish sentiment. If support continues to be tested, it may fail as buyer enthusiasm wanes.
Outcome: Descending triangles typically suggest a bearish continuation or breakdown, often occurring during downtrends before further declines. A break below support often leads to sharp drops as stop-losses are triggered and short sellers enter the market.
Trading the breakdown: Traders look for a clear break below the horizontal support, ideally confirmed by increased volume. The expected downward move can be estimated by measuring the triangle's height from the top to support.
Example – Bitcoin 2022: During the 2022 bear market, Bitcoin formed a descending triangle around the $30,000 mark after falling from its late 2021 highs. After multiple tests of support at $28k-$30k and a series of lower highs, Bitcoin eventually broke below support, leading to a dramatic drop to around $20,000.
In summary, descending triangles are one of the more reliable bearish patterns, with studies showing a 68% to 87% success rate in anticipating downward moves. Traders are advised to wait for confirmation of the breakdown or consider shorting at the descending trendline while using tight stops for risk management.
-
Symmetrical Triangle (Neutral)
A Symmetrical Triangle is a pattern marked by two converging trendlines—one slanting downward (lower highs) and one slanting upward (higher lows)—creating an equilateral triangle shape. It signifies a market in indecision, where buyers are creating higher lows and sellers are making lower highs, resulting in decreased volatility until a breakout occurs.
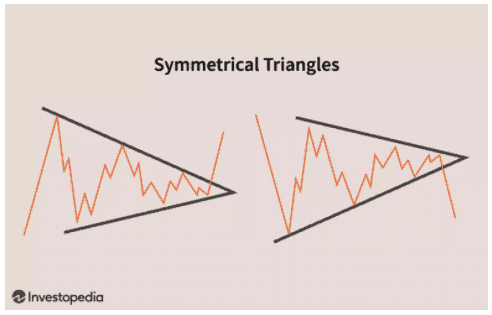
Typically, these patterns emerge after a strong trend and are seen as continuation patterns. The expectation is that the price will break in the direction of the preceding trend, though it can break either way. When trading this pattern, it's prudent to set alerts for both directions—buy above the upper trendline and sell below the lower trendline—while ensuring that volume confirms the breakout.
The measured move is calculated by taking the widest part of the triangle and projecting that distance from the breakout point. For example, Ethereum in mid-2024 formed a symmetrical triangle between $2100 and $1700, eventually breaking upward and confirming the move with increased volume.
However, be wary of false breakouts, which are common in symmetrical triangles. Waiting for a daily close beyond the trendline or a percentage move can help avoid whipsaws. Overall, symmetrical triangles have a mixed success rate for continuation, ranging from 54% to 70%, emphasizing the importance of risk management and preparation for both outcomes.
How to Trade Triangle Patterns in Crypto
Knowing the theory of triangle patterns is one thing, but trading them successfully requires rules and risk management. Here are general steps and tips for trading any triangle pattern:
-
Identify the Pattern Early: Watch for price making a series of narrowing highs and lows. Draw trendlines to confirm at least two touchpoints on each side of the triangle – this validates the pattern. Early identification helps you plan the trade, but avoid jumping in too soon. Let the pattern mature.
-
Mind the Prevailing Trend: Determine what the prior trend is (if any) before the triangle. This can bias your expectations (bullish bias for ascending, bearish for descending, trend-continuation bias for symmetrical). However, do not trade on bias alone; use it as context.
-
Volume Analysis: Typically, volume should contract during the triangle’s formation. Then a breakout should see volume expansion. If a supposed breakout occurs on low volume, be wary – it could be a false move.
-
Set Entry Triggers: Decide your trigger for entry. Common triggers:
-
For bullish breakouts (ascending or symmetrical triangles breaking up): Buy a break above the resistance trendline. Some use a specific level (e.g., a few percent above resistance or the first candle closing above it).
-
For bearish breakouts (descending or symmetrical breaking down): Sell/short when price breaks below support decisively.
-
Anticipatory entries: As discussed, advanced traders might buy at support in an ascending triangle or sell at resistance in a descending triangle, before the breakout. This can yield better entries but requires more skill in identifying that the pattern is likely to hold. If you do this, be prepared to exit quickly if the pattern shows signs of failing (e.g., price doesn’t bounce as expected).
-
-
Place Stop-Losses: Always define your risk. For any triangle trade, a logical stop is just outside the pattern on the opposite side. Example: If you go long on an ascending triangle breakout, you might place a stop just below the breakout level (or below the last higher low). If you short a descending triangle break, a stop just above the broken support or last lower high. This protects you from false breakouts that return into the triangle. As a rule of thumb, keep stops tight enough to cap risk, but not so tight that normal retests stop you out. Such as in a long trade, setting a stop below the most recent swing low that formed inside the triangle is common.
-
Profit Targets: Use the measured move technique: measure the maximum height of the triangle and project from the breakout point. That gives a rough target. Also look for nearby significant support/resistance levels – you might adjust your target to just before those, since price often reacts there. It can be prudent to take partial profits at a first target and let the rest run with a trailing stop, especially in crypto where breakouts can sometimes overextend.
-
Volume Confirmation & Follow-through: After entry, monitor volume and momentum. If the breakout is real, you should see continued movement in your favor relatively soon. If price stalls, or worse, re-enters the triangle boundaries, that’s a warning. For instance, if you went long and price pops above resistance but then falls back below it on low volume, consider tightening your stop or exiting – the pattern might be failing.
-
Risk Management: Never risk too much on one triangle setup. Not every pattern works out. As noted, success rates are around 70% for good triangles, which means 30% can fail. Use proper position sizing (e.g., risking only 1-2% of your account on the trade via your stop-loss distance). This way, a failed triangle doesn’t blow up your account. When triangles do succeed, the moves can be substantial, so even a few wins can outweigh small losses, but only if those losses are kept small.
-
Combine with Indicators: While price action is primary, some traders use indicators to bolster confidence. For example, check momentum oscillators – in an ascending triangle, you might see RSI in an uptrend too, or in a descending triangle, RSI making lower highs. Volume indicators like On-Balance Volume (OBV) or Chaikin Money Flow might show accumulation in an ascending triangle (rising OBV) or distribution in a descending one. If a bullish triangle is forming but an indicator shows bearish divergence (e.g., price making higher lows but an oscillator making lower lows), caution is warranted. Ideally, you want convergence: indicators agreeing with the pattern’s implication.
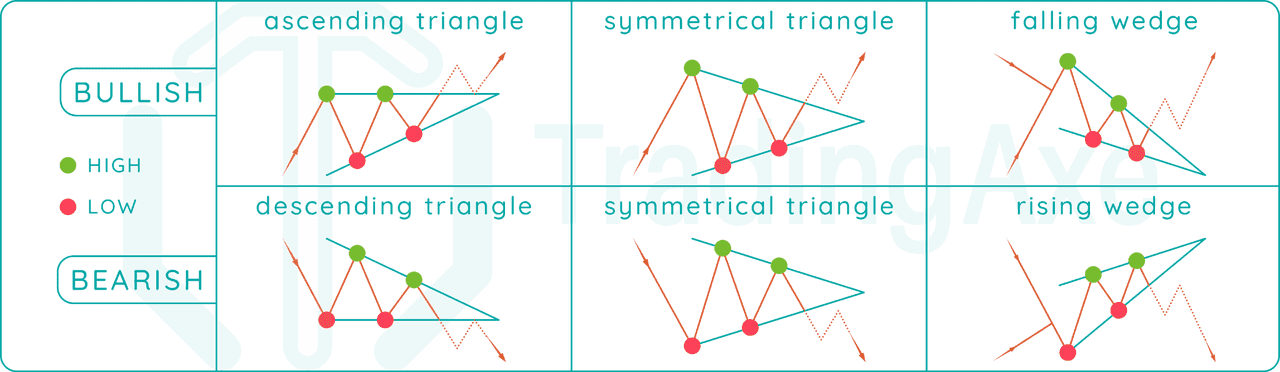
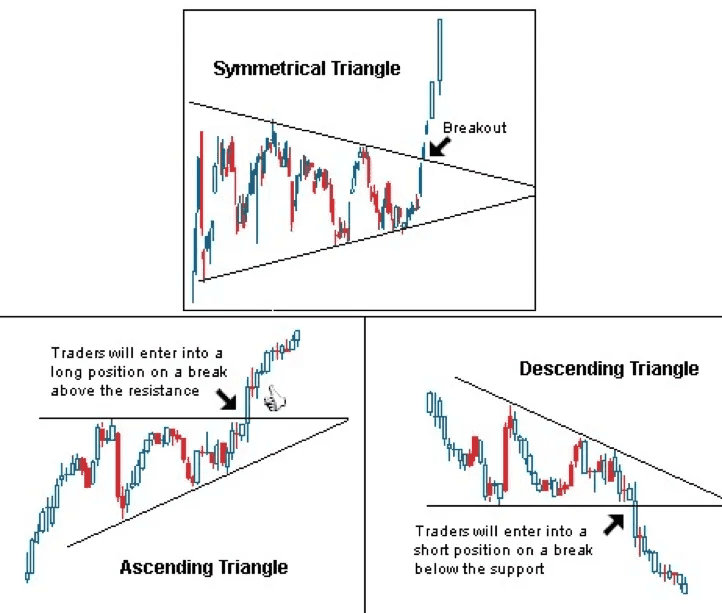
Triangle Patterns Quick Guide (source)
Risk Management and Confirmation
It’s worth emphasizing risk management and confirmation as separate points because trading patterns without them is a common pitfall:
-
False Breakout Example: Imagine Bitcoin in a symmetrical triangle. It briefly spikes above the upper trendline on a piece of news, but volume doesn’t pick up. The next day, price slips back into the triangle – a bull trap. If you had bought the moment it ticked above the line without confirmation, you’d be in a losing position. Using confirmation (like waiting for a daily close above, or a 5% move beyond the line, etc.) could save you from this trap. Also, having a stop just below the breakout level would limit the damage in such a scenario, getting you out as it falls back. Always have an exit plan for false breakouts.
-
Historical Charts Practice: One practical tip from experienced traders is to study historical charts of Bitcoin or other cryptos to see how triangles played out. This builds your intuition. For example, scroll through past BTC charts and mark every triangle you find; note how far price moved, if volume confirmed, how often a retest of the broken level occurred, etc. This will both increase your pattern recognition skill and give you realistic expectations (you’ll likely find instances of both successful breakouts and some failures).
-
Volume check: A recurring theme: volume is your friend. If you see a breakout on weak volume, be suspicious. Often, truly powerful moves in crypto are volume-backed. During the 2025 ascending triangle breakout, Bitcoin’s volume jumped over 100% day-on-day as it burst through resistance, reinforcing that the move had broad participation and was likely to sustain. Always seek that kind of confirmation in real-time when possible.
Three Major Triangles (source)
Triangle Pattern Cheat Sheet
To summarize the key points in a handy reference:
-
Ascending Triangle: Flat top, rising bottom. Bias: Bullish continuation. Trade: Wait for breakout above resistance (bullish). Key level: Horizontal resistance. Target: Height of triangle added to breakout. Stop: Below last higher low. Reliability: High in uptrends (≈70%+ success).
-
Descending Triangle: Flat bottom, falling top. Bias: Bearish continuation. Trade: Wait for breakdown below support (bearish). Key level: Horizontal support. Target: Height of triangle subtracted from breakdown. Stop: Above last lower high. Reliability: High in downtrends (≈65–70% success).
-
Symmetrical Triangle: Converging lower highs and higher lows. Bias: Neutral (continuation of prior trend slightly favored). Trade: Play the breakout either direction. Key level: Converging trendlines (both important). Target: Height of triangle projected from breakout point. Stop: Opposite side of triangle or last swing. Reliability: Moderate (≈60% success, careful of false breaks).
In trading Bitcoin and crypto, triangles are ubiquitous – on daily charts, hourly charts, you name it. Even intraday traders use triangles on 5-minute charts for scalping moves, whereas long-term traders might spot a triangle on a weekly chart spanning months. The same principles apply across timeframes.
To conclude, triangle patterns are a must-know for any crypto trader or technical analyst. They distill the battle of supply and demand into a clear geometric shape. Mastering them can improve your timing for entries and exits during consolidations. As you integrate triangle pattern analysis into your trading, remember to confirm with volume, manage your risks, and keep an eye on the broader trend and news cycle. When used properly, triangle patterns can be like signposts in the often chaotic crypto market, pointing you toward the next potential breakout or breakdown. Happy trading, and may your triangles break in the right direction!