

The Zig Zag indicator is a popular technical analysis tool used by traders to identify significant trend changes on price charts by filtering out smaller, insignificant price movements. True to its name, the indicator produces a zigzagging line on a chart that connects swing highs and swing lows, essentially drawing trend lines that only appear when price moves by more than a certain threshold. The Zig Zag indicator is a chart indicator that identifies trend lines in the price of crypto such as Bitcoin (BTC). The purpose of the Zig Zag is to simplify the visual representation of a market’s trend by cutting out “noise” – minor price fluctuations – so that the primary uptrend or downtrend becomes clearer. It does not attempt to predict future prices, but rather highlights past turning points and trend segments, which traders can use to infer things like support and resistance levels or possible chart patterns. The indicator appears as a straight line on the chart. A trader could adjust the Zig Zag indicator to see short term and long term trends. The Zig Zag indicator can be used for short-term bot trades and long-term investments. It can identify trends on the 5m, 30m, 1H, 4H, 1D, and 1W charts.
How Does the Zig Zag Indicator Work?
The Zig Zag indicator is an excellent indicator in volatile markets such as crypto, because the trend lines are shifting and a trader can know when the trend has ended and starts reversing. The downside is that this is a lagging indicator — the lines are drawn after the trend has shifted.
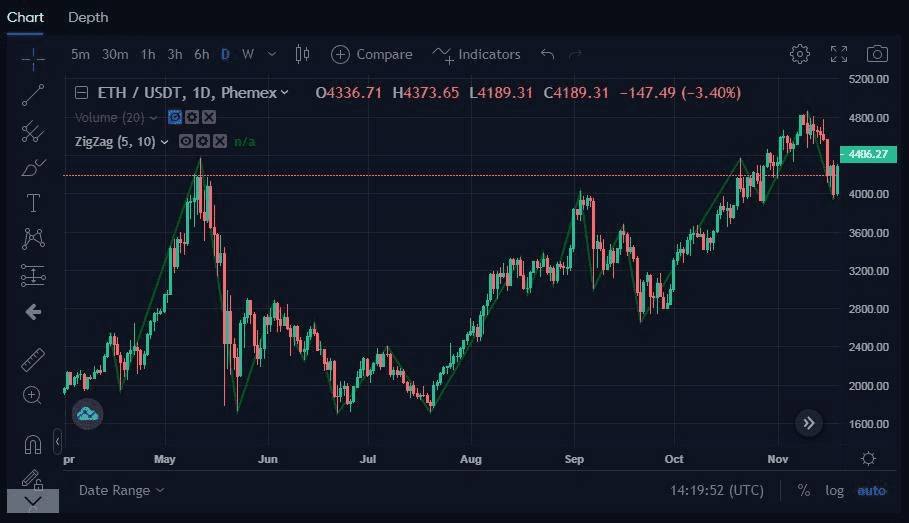
Zig Zag indicator showing green trend lines at the ETH/USDT pair.
The Zig Zag indicator operates on a simple principle: it draws lines to indicate price reversals greater than a specified percentage (commonly 5%). Analysts set this threshold, allowing the indicator to identify new swing highs or lows whenever the price retraces beyond that level. These points are connected, forming a zigzag pattern, which helps visualize major trend changes while ignoring minor fluctuations.
For example, if Bitcoin is in an uptrend and pulls back by 5% or more, the Zig Zag will mark a swing high and connect it with a downward line. It will continue until a subsequent upward move of more than 5% occurs, marking a swing low. This results in alternating segments that represent significant price movements while ignoring smaller ones.
Traders can adjust the sensitivity by changing the percentage; a lower percentage yields more frequent zigzags, while a higher percentage focuses on larger moves. Importantly, the Zig Zag is a lagging indicator, confirming trend changes only after significant price movements have occurred. It’s best used for analysis rather than precise entry or exit timing.
Where is Zig Zag indicator used?
The Zig Zag indicator is used in the crypto, stock, and forex markets. However, in non-crypto markets, the closing prices are used to draw trend lines. In crypto, the markets are always open and the trading goes on 24/7, so trend lines can only be drawn when there are price fluctuations that meet the trader’s criteria.
The indicator is often used in combination with RSI, Fibonacci, and Elliot Wave indicators to identify sudden impulse waves that form certain patterns that oppose the larger trend not shown in the long term Zig Zag indicator lines.
The indicator is not used to predict future trends in the price of crypto, but it is used to identify support and resistance levels. Traders can use this to compare historical lows and highs and draw up future projections to prepare for retracements and upward momentum. The Zig Zag indicator reveals patterns when used in conjunction with other indicators.
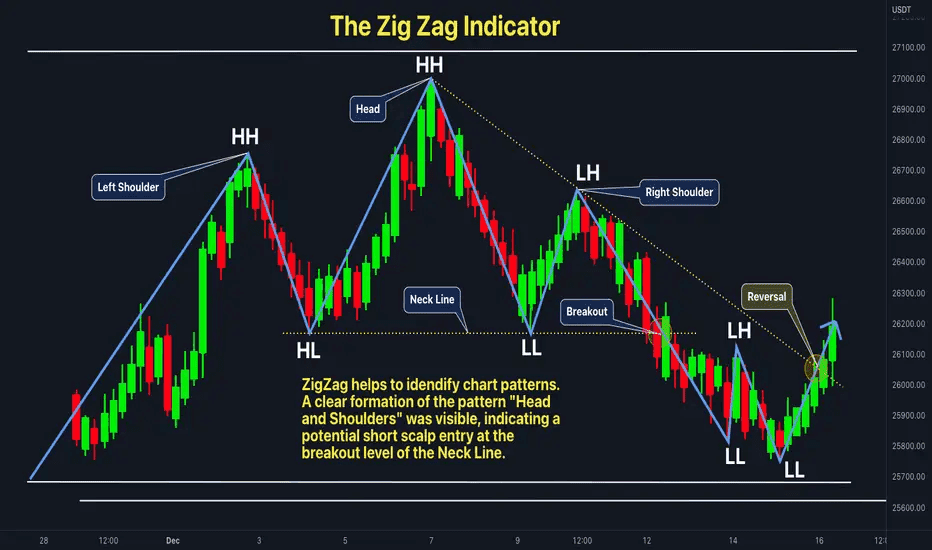
Reading the Zig Zag Indicator (source)
How to Trade the Zig Zag Indicator?
Let’s consider an example of using the Zig Zag indicator. It is a free indicator available to all Phemex users under all trade pairs.
-
Choose a trading pair, such as BTC/USDT, ETH/USDT or SOL/USDT.
-
Choose the chart you want. If you’re trading for the long term, choose 1D or 1W charts.
-
Click on “Indicators,” find “Zig Zag,” and click on it to activate it.
-
Adjust the price % movement in the settings when you click on “Zig Zag” indicator.
-
Draw a new trend line on the existing lines.
-
Plan your trading strategy according to the new trend.
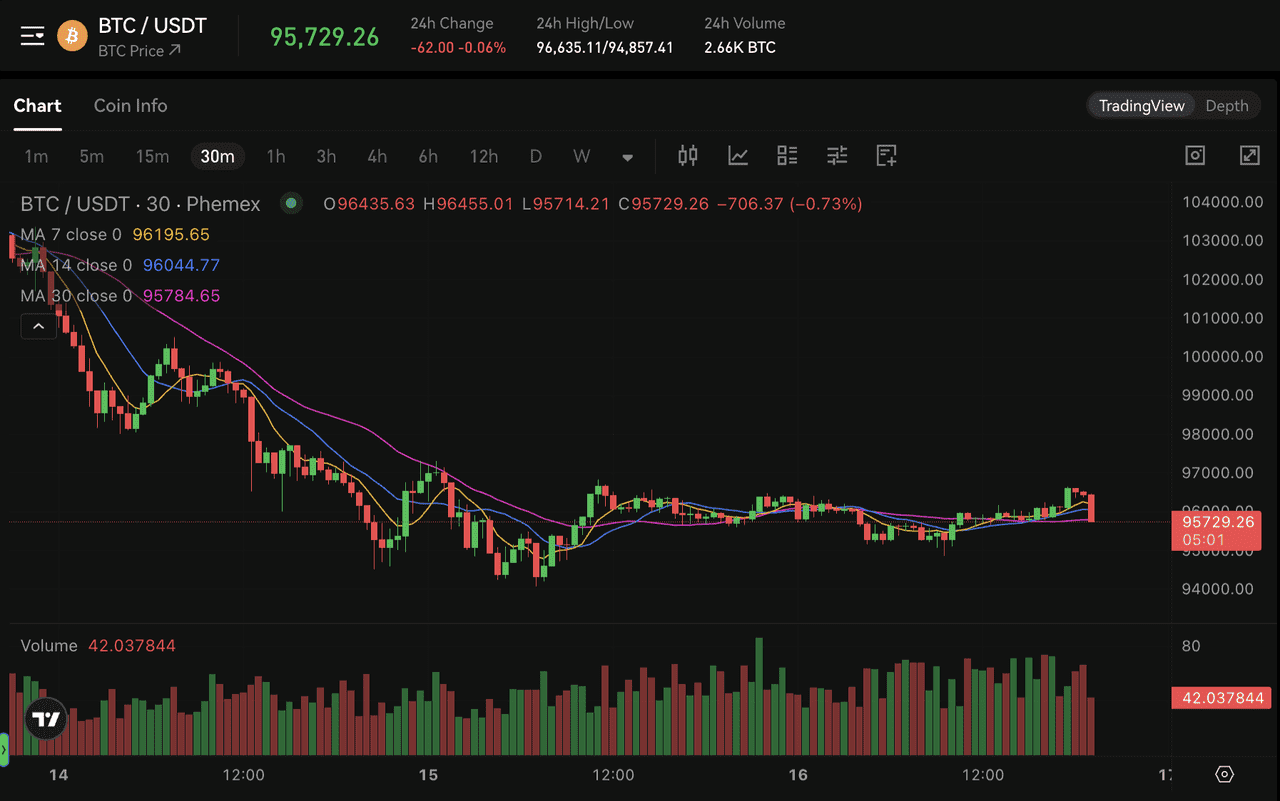
To use the Zig Zag indicator on Phemex, open your favorite trading pair. For this demonstration, we’ll use the most traded BTC/USDT pair. At the time of writing, BTC is trading at $95,750:
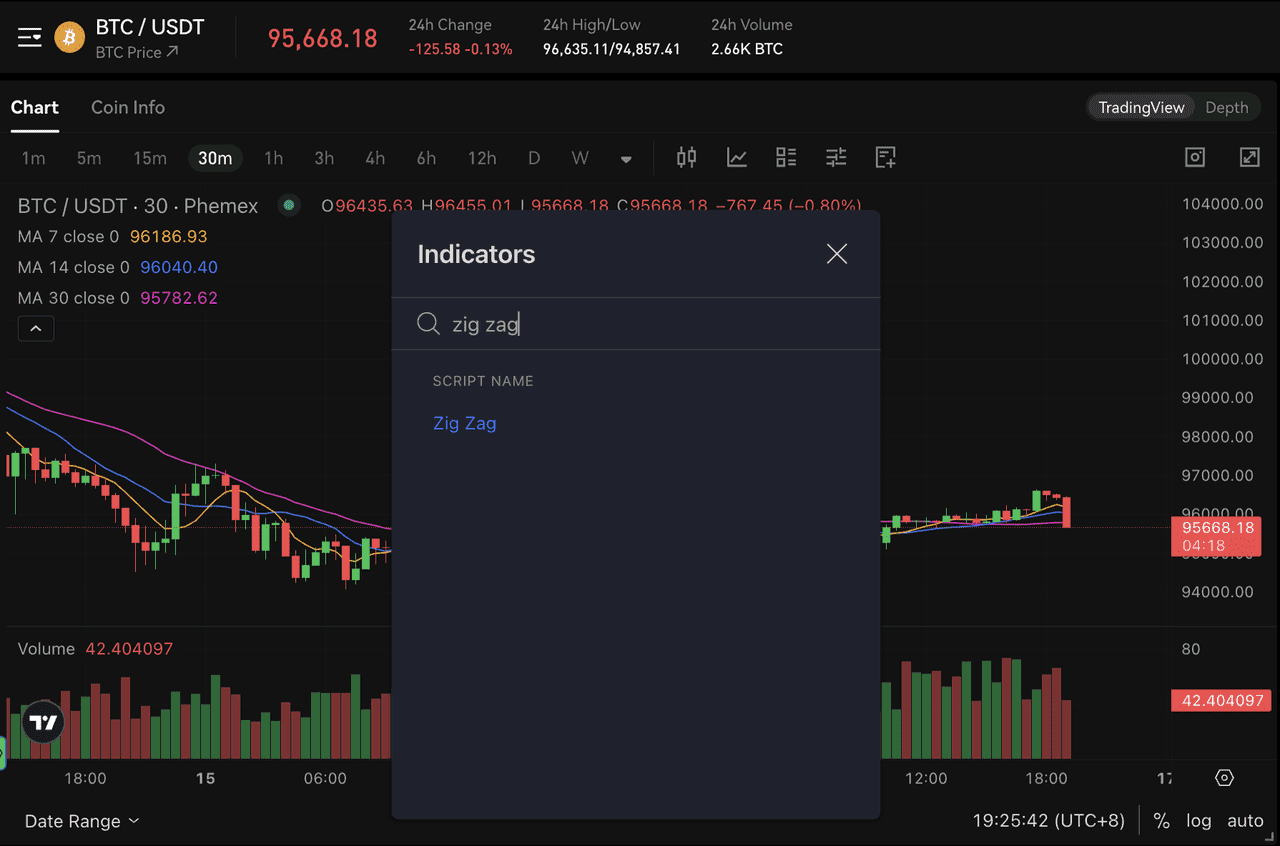
Click on “Indicators” at the top of the chart and a new window will pop up. Input “Zig Zag” in the search bar and you will find the indicator:
Click on the indicator and the chart will be filled with trend lines. In this example, we are using the daily chart for the Zig Zag indicator. If we switch to any other time on the chart, the indicator will adjust accordingly. Here is what the Zig Zag indicator trend line looks like on the daily BTC/USDT chart:
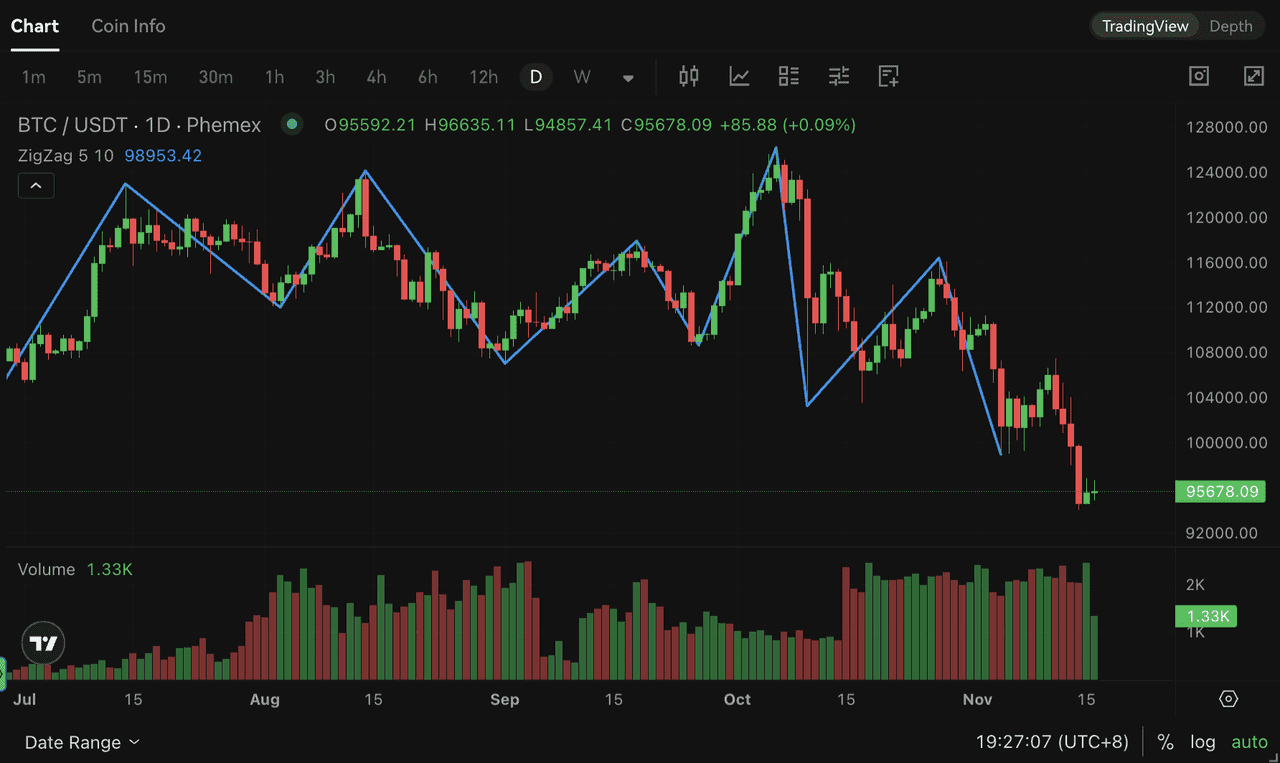
Zig Zag indicator trend on the daily BTC/USDT chart
The last several days are not charted, because the Zig Zag indicator is a lagging indicator and they will be charted after the trend pattern is confirmed. In this case, BTC seems to be heading downwards, but this pattern will not be confirmed unless it hits into the lower $50,000s.
This is how the Zig Zag indicator looks on the hourly chart:
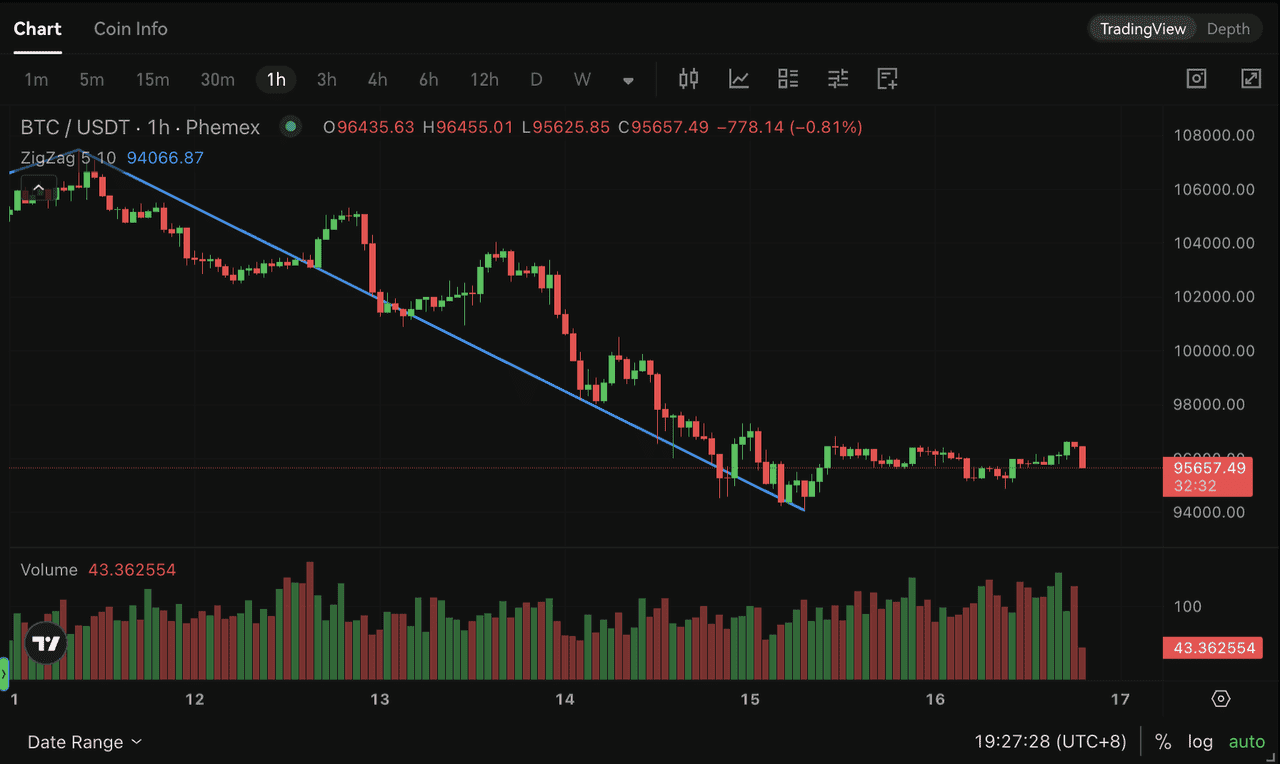
Zig Zag indicator trend on the hourly BTC/USDT chart
To adjust the price deviation, a trader can press on the “ZigZag (5, 10)” indicator bar on the top left and go to “Settings.” This will prompt a settings bar where custom price settings can be inputted.
How to Use the Zig Zag Indicator?
The reason the Zig Zag indicator exists is to help traders discover trends in the price movement and ride those trends out. The main thing a trader should be focused on when using Zig Zag indicators is the trend.
If the trader notices that the price of Bitcoin is on an upward trend, they should adjust their strategy accordingly. There will always be minor price movements that occur within the trend, but a good trader has to know how to not focus on the noise and follow the trend.
The main issue with trading using Zig Zag patterns is that it can be difficult to determine if you are in an upward trend or a downward trend. If Bitcoin or other crypto tokens are going sideways, a trader must use other indicators to find out if Bitcoin is going to go up or down.
The flexibility of the indicator means traders can adjust it to their trading style. For example, a trader who only places long term trades can adjust the indicator for 15% moves to reassure themselves that their long or short trade is following the trend.
Likewise, a trader using a bot to place short-term trades can adjust their bot according to short term trend lines on the indicator for price movements in the 1–3% area.
The most commonly used deviations for Zig Zag indicators are 5% and 10%. This is a solid price basis that sets a precedent for a bigger price move, while weeding out small 2-3% price fluctuations that might indicate the crypto is going sideways. As long as the trader has a general idea about the current trend of the price movement, they can adjust their strategy accordingly.
Advantages of the Zig Zag Indicator
-
Clarity: The Zig Zag indicator makes charts less cluttered by drawing clean lines only at important junctures. This helps remove emotions or overreactions to every small price wiggle. It’s particularly helpful for beginners to visualize price waves and experienced traders to quickly communicate trend structure.
-
Customization: Traders appreciate that they can fine-tune the sensitivity. This means the indicator can be adapted to any asset or volatility regime. If an asset suddenly becomes more volatile, you might widen the Zig Zag threshold to continue filtering noise. If volatility drops, you can tighten it to capture the now relatively “bigger” small moves.
-
Trend Confidence: Zig Zag offers confidence in identifying that “Yes, a trend change has occurred.” Since it only signals after a sizable reversal, by the time it appears, you can be fairly sure that was a real swing high/low and not just a tiny blip. This can instill discipline – for instance, keeping you in a trade until the Zig Zag turns can prevent exiting too early on minor pullbacks. For trend followers, it can be a simple rule to enforce: don’t exit until Zig Zag says so (with the understanding that it will sacrifice some profit at the end).
-
Visual Backtesting: By looking at historical zigzag swings, traders can study how often certain percentages cause reversals, or how the market behaves after X% moves. It’s a bit like automatically marking significant pivots, which can be useful for backtesting pattern recognition or simply observing market rhythm.
Limitations and Disadvantages of the Zig Zag Indicator
No indicator is perfect, and Zig Zag has notable limitations:
-
Lagging Nature: Zig Zag confirms trends after they occur, meaning you may miss the initial movement. If you set a 10% threshold, it signals a reversal only after prices have already moved this percentage, making it more of an analytical tool than a predictive one.
-
Repainting: The most recent Zig Zag line can adjust or "repaint." If the price reverses before hitting the set threshold, the line may disappear, leading to confusion since these provisional lines aren’t permanent until confirmed by sufficient price movement.
-
Flat or Low-Volatility Markets: In choppy or sideways markets, the Zig Zag might produce little to no signals or too many if the threshold is too low. It's best used when clear price waves are present.
-
Subjectivity in Setting: The choice of percentage for swings is subjective. Different traders may set different values, impacting swing point identification. While common values like 5% are used, personal preference plays a role.
-
Not a Stand-alone System: Zig Zag doesn’t dictate buy or sell actions alone. Blindly trading on Zig Zag signals can lead to poor decisions in trending markets. It’s best used alongside other indicators or patterns to guide trades.
In summary, Zig Zag is more effective when integrated into a broader trading strategy rather than used in isolation.
Combining Zig Zag with Other Indicators
The Zig Zag indicator can be combined with other indicators to help you plan out your trades. The best indicators to combine with Zig Zag are popular indicators like RSI (Relative Strength Index) that will show you when a crypto has been overbought or oversold.
If a crypto is overbought, it’s a good indicator that it might go down after a parabolic rise. If a crypto is oversold, it’s a good indicator that it might go up. For this demonstration, we combined RSI with Zig Zag trends:
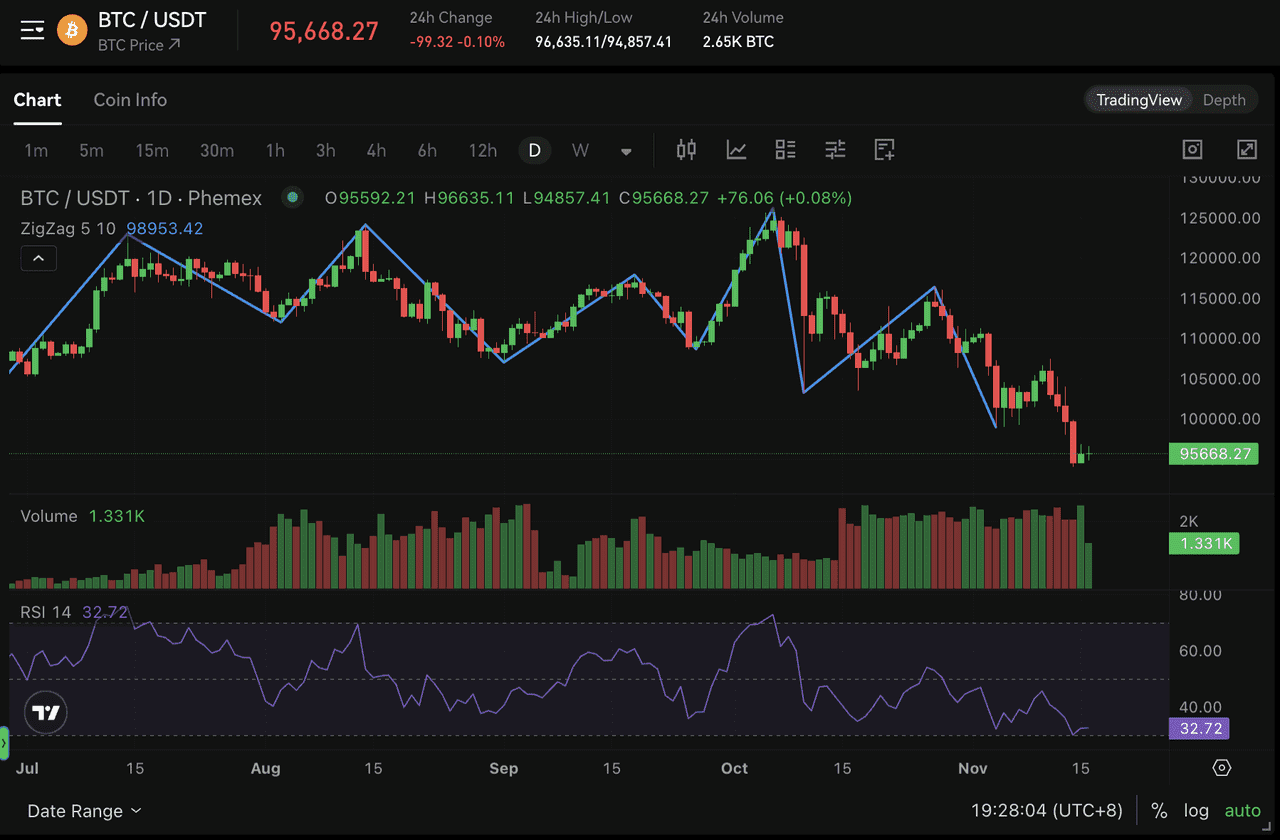
Using Zig Zag and RSI Indicators on Phemex (source)
Notice how the RSI indicator below was implemented underneath the candles on the BTC/USDT pair while the Zig Zag trend lines remain above. While the latest Zig Zag trend line is not shown for the current trend, the RSI indicates that Bitcoin is oversold. A quick analysis like this could help a trader make a trade.
What is the Elliot Wave Zig Zag Indicator?
The Zig Zag indicator is used for Elliott Wave trading. The Elliott Wave theory states that the market forms certain psychological sentiment. This is either optimistic or pessimistic sentiment. The sequences are repeated over a certain time period, in different intensities.
This form of trading relies on studying the psychology of traders in a certain time scale. There are usually five waves in a large Elliott Wave: A, B, C, D, and E. The Zig Zag is used to confirm sentiment for the price action, letting a trader make an educated guess for future price movement.
Elliott Wave trading can be used both in bull markets and bear markets:
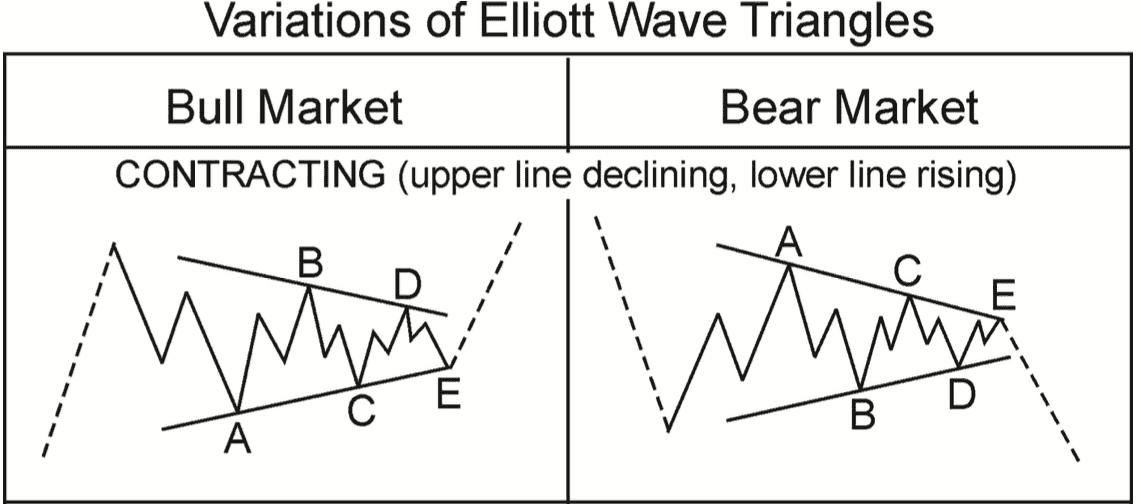
Identifying Elliott Wave patterns using the Zig Zag indicator.
During a bull market, if a trader identifies a similar Elliott Wave triangle leading from A to E, they can identify the next breakout and long crypto. In a bear market, a similar pattern could identify short potential on cryptos.
How is the Zig Zag used in Harmonic Pattern Trading?
The Zig Zag indicator is one of the most-used for identifying Harmonic trading patterns. Harmonic patterns are similar to Elliott Wave patterns in the sense that they identify harmonic movements in the markets that can be divided in smaller and larger waves.
For reference, this custom Multi Level Zig Zag indicator on TradingView allows traders to see harmonic patterns using the Zig Zag indicator and help them identify when cryptos are about to break out or go down. This is an example of a complex indicator that can be added to an account for free. Traders can use it to plan their next trades on Phemex.
Conclusion
The Zig Zag indicator is popular among crypto traders for technical analysis, especially over longer time frames. It helps filter out market noise, allowing traders to identify major swing highs and lows on charts of assets like Bitcoin and Ethereum. This enables better trendline and channel drawing, as well as cycle analysis of bullish and bearish swings throughout the year.
Due to crypto's volatility, it's important to choose the right Zig Zag settings. Common values like 5%, 7%, or 10% are used to capture significant moves, while ignoring minor fluctuations. Setting a lower percentage can lead to tracking too many minor pumps and dumps.
In automated trading strategies, Zig Zag can signal trend reversals. For example, a bot might sell if prices drop more than 8% from a peak, reflecting a Zig Zag approach, though it's often enhanced with additional triggers.
In summary, the Zig Zag indicator highlights key price turning points, simplifying decision-making in volatile crypto markets. While it can provide valuable insights, it should be used alongside other analysis tools and confirmed with additional evidence. Remember, it’s a practical tool for understanding past price movements, not a foolproof prediction device.