Summary:
- The Williams Alligator is a trend indicator designed to identify the formation of a trend; it is built on the premise that trending markets occur only 15-30% of the time in a year (it is easier for beginner traders to make a profit in these markets.)
- There are three lines in the Williams Alligator: Jaw (blue), teeth (red), and lips (green); if these three lines are close together, this signifies that the alligator is “asleep” and there is no clear market trend; if they expand i.e. move apart from each other, this means the alligator is “awoken” and the market is either trending up or down.
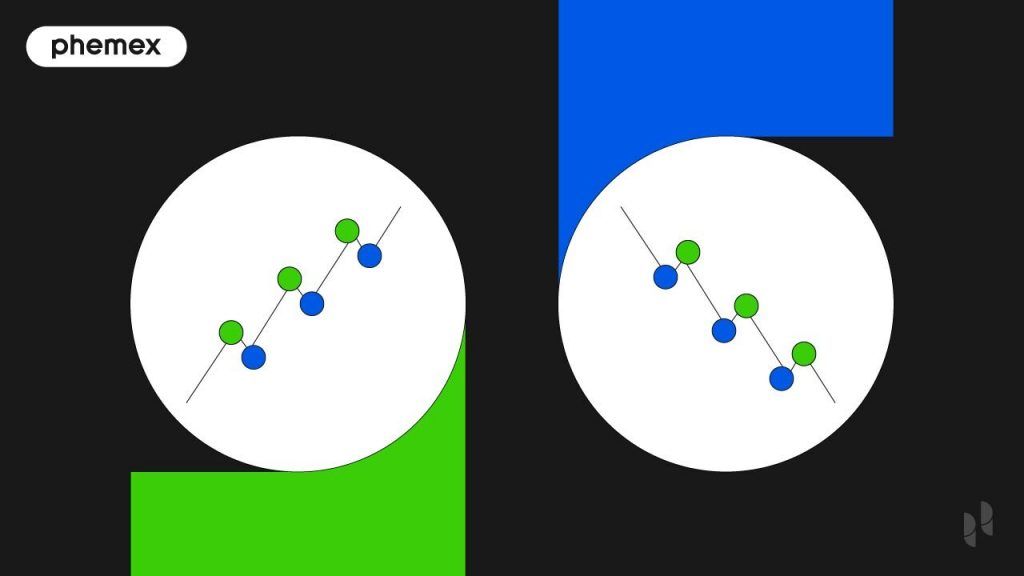
- A perfect uptrend (bullish) is when the green line trades above the red and blue lines. A perfect downtrend (bearish) is when the blue line trades above the red and green lines.

What Is The Williams Alligator Indicator?
The Williams Alligator indicator is a trend indicator consisting of three lines: jaw, lips, and teeth, each representing part of an alligator’s mouth on the chart, and is used to identify the formation of a trend. This can be a useful indicator to traders as trending markets tend to move in one direction–this makes price action easy to predict and even beginner traders can make a profit. Meanwhile, sideways markets are volatile without a predictive direction and can go up or down; typically, only professional traders can trade successfully in sideways markets.
The indicator was invented by legendary forex trader Bill Williams and bears his last name. Williams famously said that retail investors only make money on trending markets which occur 15 to 30% of the time, while the market is trading sideways 70-85% of the time.
The indicator lines use three moving averages. The jaw (blue), teeth (red), and lips (green) are based on Simple Moving Averages (SMAs). If these three lines are close together, this signifies that the alligator is “asleep” and there is no clear market trend; if they expand i.e. move apart from each other, this means the alligator is “awoken” and the market is either trending up or down.
Trending markets are less common than sideways markets. Williams advised traders to avoid trading while the alligator is asleep and trade only when it’s awoken, to enhance their chances of making a profitable trade.
The teeth (red) moving average can also indicate dynamic support and resistance levels in the price of crypto. This makes the indicator useful not only as a trend predicting tool, but as a day trading indicator. Below we’ve laid out illustrations to help you get started with the indicator.
What Inspired The “Alligator” Name?
The Alligator indicator has a unique shape that expands and contracts based on trend patterns. In a trending market, the alligator mouth expands and starts “eating” the candles. This occurs during upturns and downturns. The mouth contracts when the market is going sideways.

We can see how the three lines expand at the start of a trend, and contracts when the trend ends. This is a symbolic representation of an alligator’s mouth opening and closing. The buy signal is generated when the green line (lips) trends above the red and blue line. The sell signal is generated when the blue line (jaw) trends above the red and green line.
Who Invented The Williams Alligator?
The Williams Alligator was invented by Bill Williams, an American trader with over 50 years of experience in the forex markets. He is the originator of the Williams Alligator, Awesome Oscillator, Williams Fractal, and Accelerator/Decelerator Oscillator indicators.
His indicators are mostly trend-based and utilize human psychology, chaos theory, and fractal geometry. When introducing the Williams Alligator, he prefaced it with the following quote:
Most of the time the market remains stationary. Only 15 – 30% of the time the market generates trends, and traders who are not located in the exchange itself derive most of their profits from the trends. My grandfather used to repeat: “Even a blind chicken will find its corns, if it is always fed at the same time”. We call the trade on the trend “a blind chicken market”. It took us years, but we have produced an indicator that lets us always keep our powder dry until we reach the “blind chicken market.
The Williams Alligator indicator bears his last name. We can conclude that his intention was to improve trader’s awareness about the state of the markets and help them with market timing by signaling trading markets as they start forming.

What Is The Williams Alligator Formula?
The Williams Alligator formula is based on three Simple Moving Averages (SMAs). These are distributed over n-periods and use smoothening to move them 3-8 bars into the future. The formula for the Simple Moving Average is:

The “A” stands for average price and the n is the period selected. The Williams Alligator has separate n-periods and smoothening for all bars:
- Blue Line (Jaw): 13-period Simple Moving Average. The SMA is moved into the future by 8 bars.
- Red Line (Teeth): 8-period Simple Moving Average. The SMA is moved into the future by 5 bars.
- Green Line (Lips): 5-period Simple Moving Average. The SMA is moved into the future by 3 bars.
The subsequent smoothening for future predictions is based on this formula:
SMA = SMAA (i – 1) x N
SMAA (i) = (Previous sum – SMAA (i-1) + Closing Average (i) ) / n.
The lip line (green) is the shortest and is the fastest to react. The buy and sell signals are generated when the mouth starts opening and these lines diverge from each other.
How to Use The Alligator Indicator?
We will implement the Alligator using the Phemex platform. Head to the “Markets” and pick any of the trading pairs such as BTC/USDT to get started. Click on “Indicators” to search for ““Williams Alligator.”

Left-click on the Williams Alligator indicator and you will activate it (the three colored lines running closely to the Bitcoin price lines):

The three parts of the Alligator mouth i.e. the jaw (blue), teeth (red), and lips (green) are now active. The Williams Alligator settings are accessible at the top-left and traders can adjust n-periods for the SMAs on the indicator:

The default settings are solid for short to mid-term trading. If you want it to oscillate less for long-term trading, enhance the length to a longer period. For example, the jaw length can be changed to 50 periods instead of 21.
How to Read Williams Alligator?
The Williams Alligator is easy to read when a trader focuses on the expansion and contraction of the bands. Imagine a real-life alligator that is asleep and could awaken when a market trend starts.
- Sleeping: If the three lines are close together, this means it’s a sleeping alligator and we’re in a sideways/choppy market.
- Awake: If the three lines are expanding and diverging from each other, it’s an awoken alligator and we’re entering a trending market.
Here’s how to recognize sleeping and awake patterns on the chart:

Zoom out of the chart using the mouse wheel to recognize these patterns. If you are zoomed in, you won’t be able to see the contraction and expansion. Once you know how to recognize a sideways market from a trending market, you can use the indicator for your William Alligator strategy.
How to Trade With the Williams Alligator?
Using the 1D (daily) chart we can analyze the historic price movements of Bitcoin. A trader only has to focus on the green and blue lines to read bullish and bearish signals. The red line can be safely ignored for trade signals. Here’s how the lines diverged at one period:

An effective Williams Alligator strategy is to go long when the green line (lips) moves above the red and blue line. We can see the alligator awakened and Bitcoin entering into a trending market, rising from $40,000 up to $69,000. When the blue line (jaw) moved above the red and green lines, it gave a sell signal and the price went down.
For swing trading or any form of short-term trading, we can identify temporary trends using the indicator and open long or short orders. The 4H (hourly) chart is the most commonly used chart. We can review how the contraction and expansion signaled trending markets and what the deviation told us:

Our analysis for the price action of Bitcoin in the chart above:
- First box: Sideways action. Use caution when trading or avoid trading altogether.
- Second box: Trending market. The green line is above the red/blue lines indicating a bullish trend. Open a long trade.
- Third box: Sideways action. Use caution when trading or avoid trading altogether.
- Fourth box: Trending market. The blue line is above the red/green lines indicating a bearish trend. Open a short trade.
Having said all that, it is important to remember that the dynamics of the market are always changing and a trader should use stop-losses and take-profit orders to avoid losing capital. There is no guarantee that the price will go up indefinitely if the green line is above the red and blue line and vice versa.

Conclusion
The Williams Alligator is a unique indicator that tells us two important things: the presence, and absence of a trend. The chance of a trader making a substantial profit increases with the presence of a trend. During a trending market, we can open long or short trades with a degree of certainty that they’re going to proceed in that direction. If there’s no trend direction, a trader is practically gambling on the outcome of future price action.
The inventor of the indicator, Bill Williams, is a highly renowned trader with decades of experience and developed some of the most reliable indicators. Traders are advised to use it in combination with other indicators such as the Exponential Moving Average as the WA is based on the Simple Moving Average. The SMA relies on long-term data, while EMAs and other weighted indicators place weight on recent data that could be relevant.
To learn more about indicators you could combine with the Williams Alligator, read our Technical Analysis section.
Read More
- What is Williams Fractal (WF): When To Buy & When to Sell Bitcoin
- How to Use Williams % R Indicator: Identify Overbought/Oversold
- Non-Lagging Indicators: Top 5 Non-Lagging Indicators for Crypto Trading
- What Is Trend Trading: Following the Market When It Pays
- What Is A Trend Line? How to Draw & Use For Crypto Trading
- What is Zig Zag Indicator: Discover Trend Lines in Crypto
- How to use Leading, Lagging, and Coincident Indicators?
- How to use The Trend Reversal Trading Strategy: All you Need to know


