
Summary
- Williams Fractal is a technical indicator that uses triangle “fractals” to signal trend reversals, and is based on three Simple Moving Averages (SMAs): 5-SMA, 8-SMA, and 13-SMA.
- Red fractals indicate bullish trends and act as a buy signal; orange fractals indicate bearish trends and act as a sell signal.
- However, the Williams Fractal can send false signals; to enhance the accuracy of the indicator, it should be used with the Williams Alligator to identify trending markets.

What Is Williams Fractal?
Williams Fractal (WF) is an indicator designed to signal reversals. The WF indicator is based on “fractals” or small triangles that appear above or beneath the candlesticks. Red fractals identify a bullish uptrend, and orange fractals identify a bearish downtrend.
Fractal trading is sometimes considered outdated because there are too many fractals that can send false signals. However, used in the right context they can be extremely effective for crypto trading.
The indicator uses a triple Simple Moving Average (SMA) as the basis for high and low n-value calculations. The price averages are used to generate buy and sell signals based on trend reversals. Fractals only appear if the indicator discovers a new trend. For example, if Bitcoin’s price is going up over 10 days, the indicator will not show a new triangle unless it detects a price reversal to the downside. It’s recommended to use the WF indicator on long-term charts such as 1D (daily) or 1W (weekly) to avoid false signals.

The inventor of the indicator, Bill Williams, warned traders against using the indicator in non-trending markets. He suggested that traders only make money 15 to 30% of the year when an asset is trending. The fractals are much more accurate if we trade in trending markets. A trader should only scalp Bitcoin on short-term charts with this indicator if they’re using other indicators such as the Williams Alligator (WA). This indicator can identify when a trend has formed based on the shape of the lines (further explanation below).
Who Invented Williams Fractal?
Williams Fractal (WA) was invented by Bill Williams, considered one of the fathers of modern technical analysis due to his contributions such as the Awesome Oscillator (AO), Williams Alligator, and other indicators.
The indicator was first introduced in the book “Trading Chaos,” originally published in 2004. The fractal indicator is one of his least-known contributions, compared to indicators such as Williams Alligator (WA) that are used for the Bill Williams fractal breakout strategy. The indicator is now mostly used for support/resistance levels and reversal trading.
What is Williams Fractal Formula?
The Williams Fractal formula is based on fractals geography and chaos theory. Market dynamics are based on the principle of opposing energies and these effects are described in the chaos theory.
For example, if an object falls from a building, it will not stop falling until it reaches the floor and an opposing force stops it from falling. A balloon flying to space will not stop ascending until it leaves the Earth’s atmosphere and is destroyed by opposing forces. The markets act similarly with uptrends and downtrends.

The Williams Fractal calculation is based on a triple Simple Moving Average: 5-SMA, 8-SMA, and 13-SMA. The SMA indicator measures average prices of Bitcoin for those periods and the Williams Fractal isolates the highest and lowest values marked as “N-1” and “N-2” for high and low averages:
- High (N) > High (N-2)
- High (N) > High (N-1)
- High (N) > High (N+1)
- High (N) > High (N+2)
The formula uses a five-bar pattern to calculate potential reversals to the upside or downside. In the five bars, if there are two highs or two lows, this indicates a reversal could come between them. However, the indicator can send signals between five bars depending on the trend. For example, we can have a buy signal below one daily bar and then a sell signal above a daily bar the next day.
How to Use Williams Fractals?
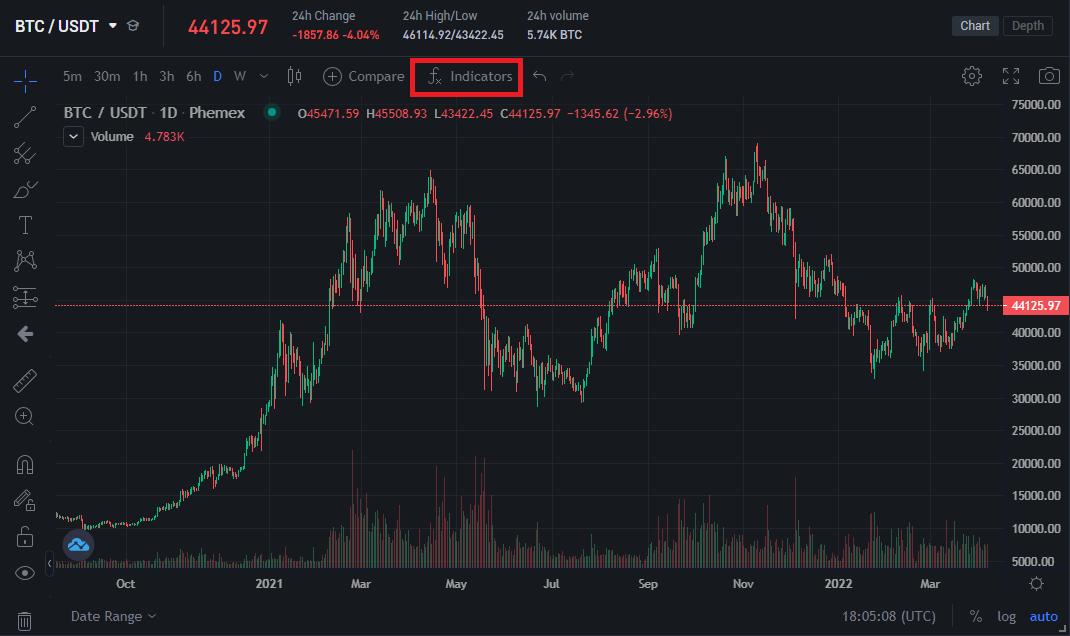
Let’s use the Phemex platform to get started. Pick among hundreds of trading pairs on the “Markets” tab. For this demonstration, we’re going to use the BTC/USDT chart. Click on the “Indicators” dropdown at the top and zoom in on the Bitcoin chart so you can see the fractals once they’re active:
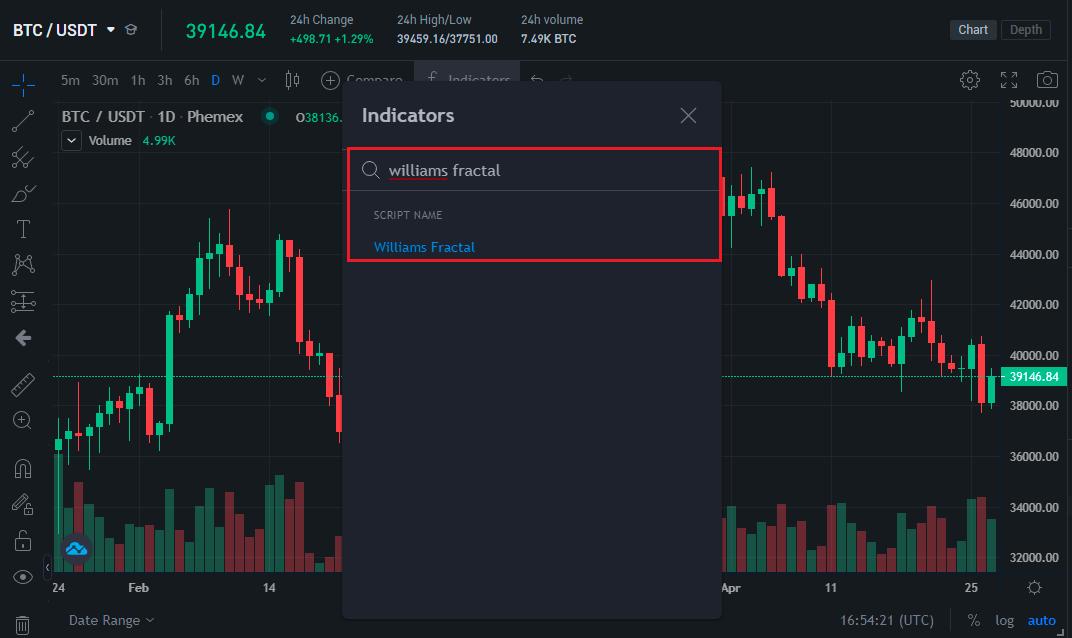
A search bar will appear where you can search for “Williams Fractal” to locate the indicator:
Left click on the indicator and you will see the triangle/arrow-like signals on the Bitcoin chart:

The orange fractals show bearish or “sell” signals. The red fractals show bullish or “buy” signals. This can be confusing because red colors are typically associated with downturns, but here they imply bullish reversals.
The best way to set up Williams Fractal is to switch to the 1D (daily) since long-term SMA data filters out false buy/sell signals. If you use it on short-term charts such as 1H (hourly) or 30M (minute) you risk trading based potentially-false signals. This risk decreases significantly with long chart values.
How to Trade With Williams Fractal?
Williams Fractal trading is based on trend reversals. The WF indicator can send “Buy” or “Sell” signals based on the fractals displayed on the chart. To get the best perspective on long-term price movement, switch to the 1W (weekly) chart for the current trend:

Red fractal: Buy signal. Orange fractal: Sell signal.
If a red fractal appears on the chart, this is a buy signal and you should open a long trade. If an orange fractal appears, this is a sell signal and you should open a short trade. We can see the latest signal was a sell signal four weeks ago and Bitcoin has depreciated since without any sign of reversal. A new fractal will not appear unless the Bitcoin price reverses to the upside and starts a new bullish trend.
What Is The Bill Williams Fractal Breakout Strategy?
Bill William’s fractal breakout strategy is based on confirmation at the second bar. If the fractal sends a buy signal (red triangle), and the price goes up on the second bar, we should long Bitcoin expecting a breakout. We can use the 1H (hourly) chart to demonstrate this in action:

Wait for one bar after the signal to confirm accuracy before trading.
After the first buy signal, the next bar was green and this is when it’s ideal to open a long trade, according to Williams. This is a safety mechanism to ensure that traders don’t place a bet on a false signal; the green candle confirms that the trend is headed upward.
What Is The Fractal and Alligator Strategy?
The “Fractal and Alligator” strategy is based on combining the Williams Fractal with the Williams Alligator (WA) indicator. The WA indicator was also invented by Bill Williams; it is an iconic trend indicator that tells traders when they’re in a trending market. Williams claimed that trending markets occur only 15 to 30% of the time in a year. A trader should only trade in trending markets if they want to make a profit with relative ease.
The Williams Alligator has three symbolic lines that symbolize the opening of an alligator mouth: Jaw (blue), Teeth (red), and Lips (green). These three lines appear around the Bitcoin candles and signal sideways/choppy movement if they are close to each other and trending movement if they diverge from each other.
The two indicators can be combined to filter false signals by trading only during trending markets:

Left: Sideways. Middle-left: Bullish. Middle-right: Bearish. Right: Sideways.
We can see how the lines of the Alligator are close to each other on the left–this indicates a sideways or “choppy” market and traders should avoid trading. Once the lines start expanding away from each other, we’re in a trending market where we have a predictable trend.
The Williams Fractal sent a buy signal at $38,000 and the green line moved above the red and blue which confirms a bullish trend. A trader could open a long trade and ride it out until the alligator lines reverses. The trend reversed on the right when the blue line traded above the red and green lines which indicated bearish momentum.
However, the indicator also sent two false signals above–both could have misled traders with a sell signal. The alligator indicator showed we’re still in a bullish trend without a reversal. Once the blue line on the alligator moved above the red/green lines, the trend reversed to bearish; this was followed by an accurate sell signal, as the price promptly declined from $41,000 to $38,000.

Conclusion
Bill Williams is considered the father of modern technical analysis and his indicators are used by millions of traders worldwide. The Williams Fractal is a unique indicator that differs visually from most other indicators, but once a trader understands what the fractals do and how they send signals, they’ll have an easy time integrating it with other indicators. However, like with all other leading indicators it carries a risk of false signals.
The two best ways to eliminate false signals are to: A) Use a long term chart such as a weekly chart B) Combine the indicator with trend indicators such as the Williams Alligator. The historic patterns for previous buy and sell signals can be used as stop-loss and take-profit limits for traders.
To learn more about which other technical indicators can be combined with the Williams Fractal, visit our technical analysis section.
Read More
- Williams Alligator: When Will The Bitcoin Alligator Awaken?
- How to Use Williams % R Indicator: Identify Overbought/Oversold
- Elliott Wave Theory: How to Use The Elliott Wave Indicator
- What are Harmonic Patterns: Predicting Future Price Actions
- What Is Trend Trading: Following the Market When It Pays
- The 8 Most Important Crypto Candlestick Patterns
- Wedge Patterns: How to trade Falling Wedge and Rising Wedge Patterns?
- Swing Trading Crypto: What are the Best Indicators for Swing Trading?