Bitcoin Dominance (BTCD) refers to Bitcoin’s share of the total cryptocurrency market capitalization. In simple terms, it’s a measure of how much of the crypto market’s value is held in Bitcoin (BTC) versus all other coins, known as altcoins. This metric is a key indicator for crypto traders, as it reflects market sentiment and helps guide portfolio allocation. A rising BTCD often signals Bitcoin leading the market, while a falling BTCD can indicate money flowing into altcoins like Ethereum or Ripple. By understanding Bitcoin Dominance, traders can make informed decisions to capitalize on market trends. This guide explores what BTCD is, how to calculate it, its psychology, and how to use it in trading strategies.

What is Bitcoin Dominance?
Bitcoin Dominance (BTCD), also called the Bitcoin Dominance Index, represents Bitcoin’s market capitalization relative to the total market cap of all cryptocurrencies. In other words, it shows Bitcoin’s market share in the crypto ecosystem.
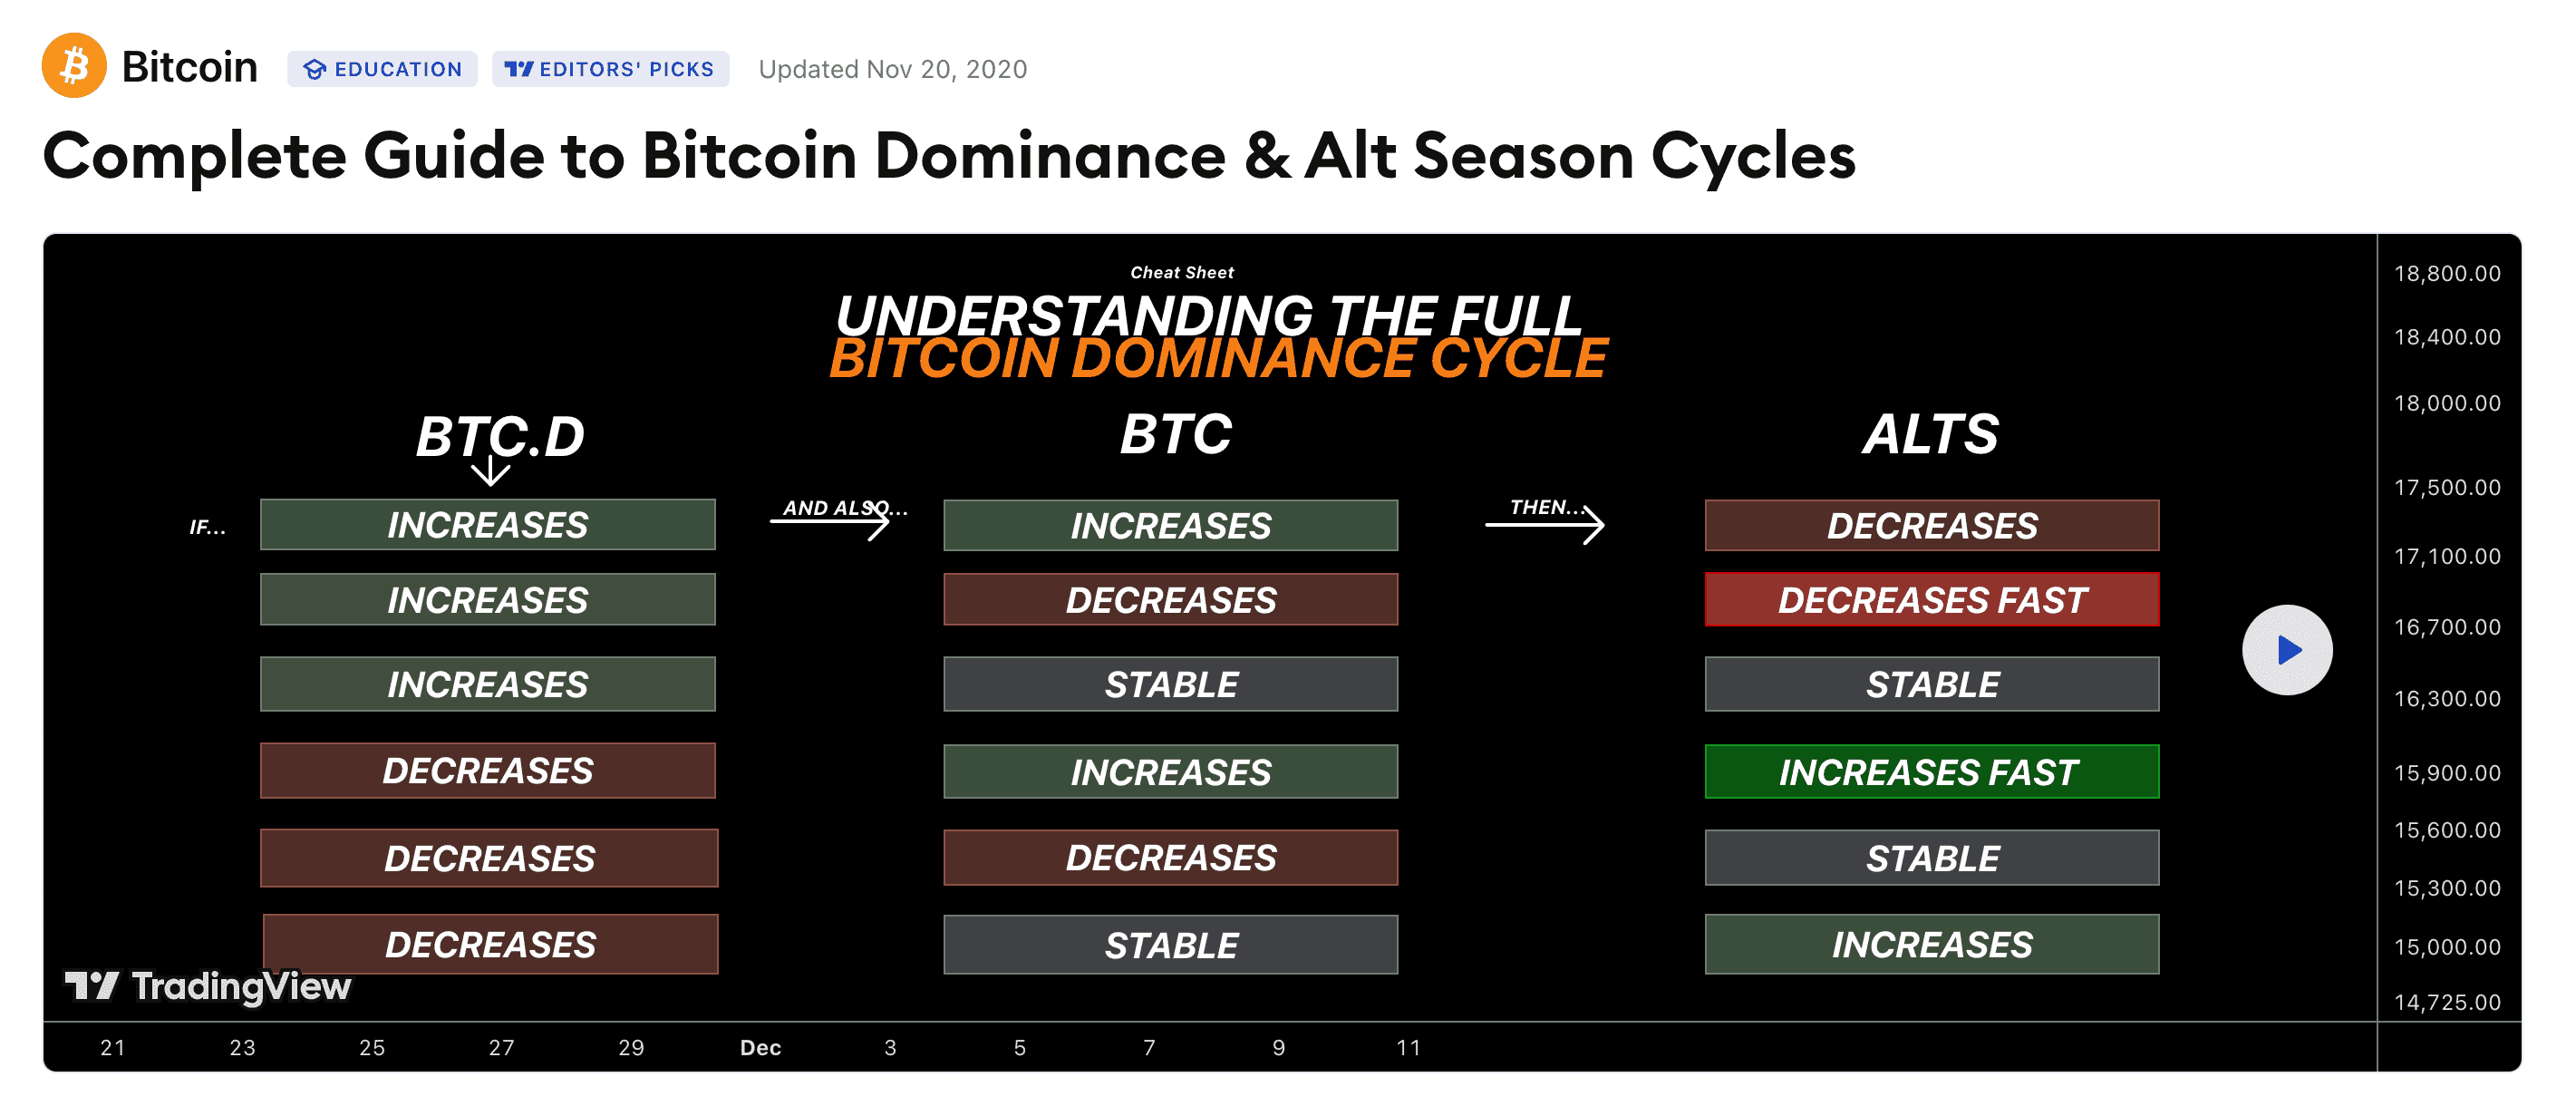
The basic principle is straightforward: if BTCD increases, the value of altcoins (all other cryptocurrencies, including Ethereum, Ripple, and Cardano) tends to decrease relative to Bitcoin. Conversely, if BTCD decreases, altcoins typically gain value faster than Bitcoin, signaling an “altseason.” For beginners, think of BTCD as a gauge of whether Bitcoin or altcoins are driving the crypto market’s momentum.
Bitcoin, created by Satoshi Nakamoto in 2008 and first mined in 2009, was the first cryptocurrency and initially held 100% market dominance. As altcoins emerged, Bitcoin’s dominance began to decline. In 2013, BTCD was still at 94%, but by 2017, it dropped to 40% as initial coin offerings (ICOs) and altcoins gained popularity. In February 2017, BTCD was 85.4%, with Ethereum (ETH) at 5.7% and Ripple (XRP) at 1.1%. By June 2017, BTCD fell to 40% as liquidity shifted to altcoins.
Today, Bitcoin’s dominance fluctuates around 58 (as of October 15 2025). A growing altcoin market share is often seen as a sign of a maturing crypto ecosystem, as new projects and participants create a more robust market.
How To Calculate Bitcoin Dominance
Bitcoin dominance (%) = BTC market cap ($)/ Total cryptocurrency market cap ($)For example:
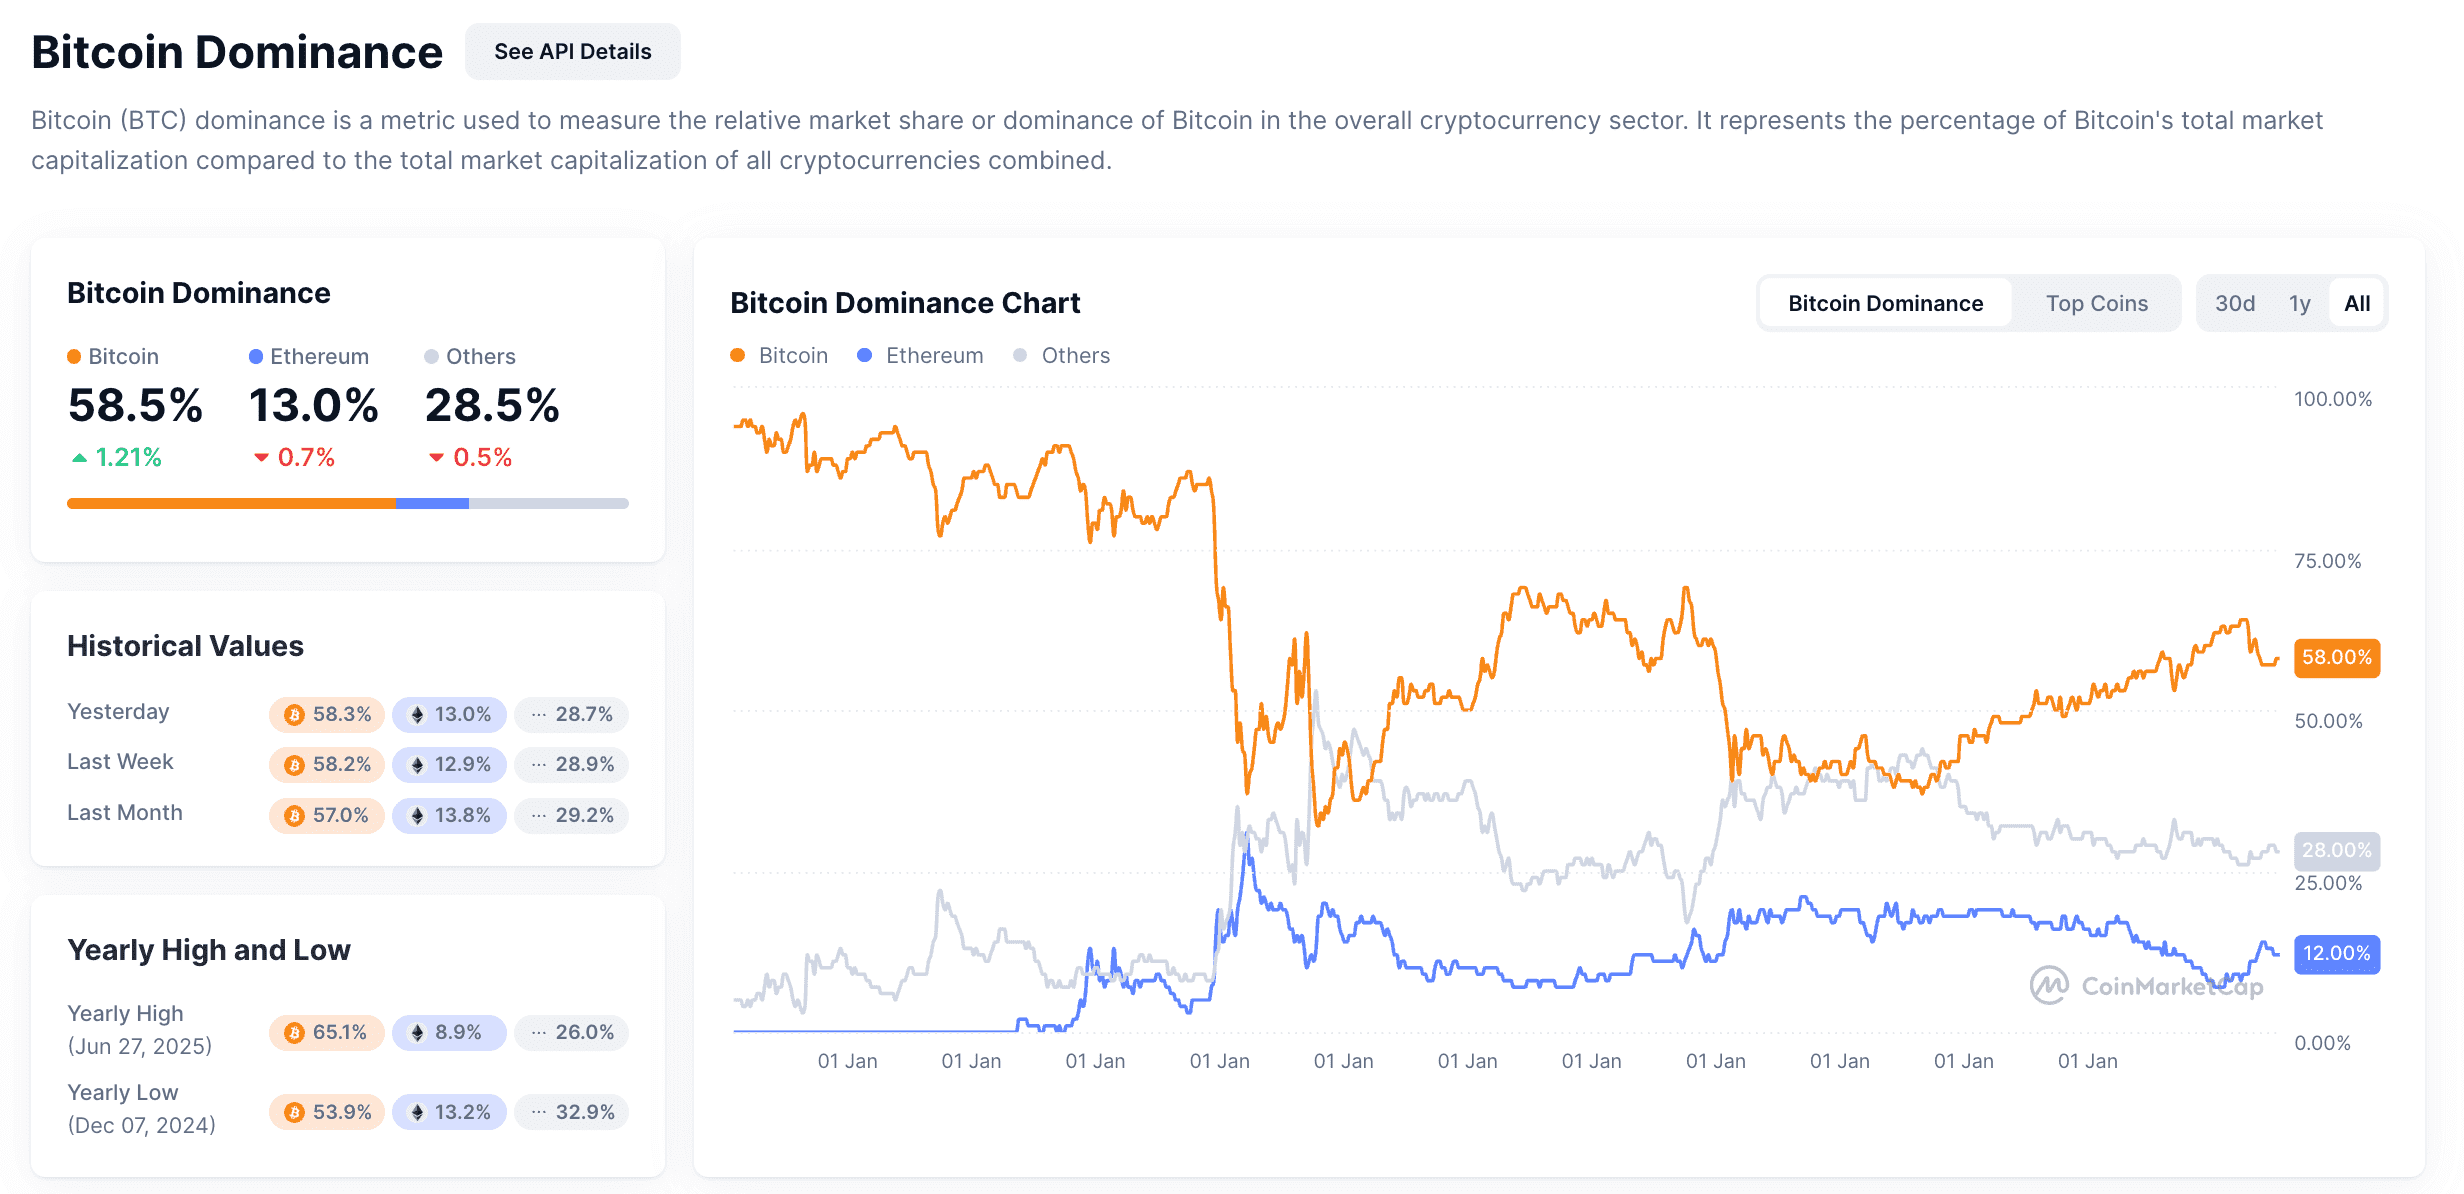
Bitcoin Dominance Chart
The Bitcoin Dominance chart, available on sites like CoinMarketCap, shows how much of the cryptocurrency market Bitcoin controls over time. This chart helps you see changes in Bitcoin’s share compared to other coins, like Ethereum and altcoins. For example, Bitcoin’s dominance can drop to around 50% or rise to about 65% over a year, depending on market trends. In the past, such as in 2018, Bitcoin’s share reached as high as 70% when other coins lost value. The chart provides a simple way to track these shifts, making it useful for understanding market patterns over time.

Psychology Behind Bitcoin Dominance
How To Use Bitcoin Dominance To Trade
-
Scenario 1: BTC Dominance Rising + Bitcoin Price Rising – Bitcoin Bull Market.
If you observe that BTC’s dominance is climbing while Bitcoin’s own price is also climbing, this typically indicates a Bitcoin-led bull run. Money is flowing primarily into BTC.
In this scenario, a trader might focus on accumulating Bitcoin itself, since it’s leading the market. Altcoins may still be rising, but usually not as fast as BTC.
The strategy here: Consider buying Bitcoin or maintaining an overweight BTC position, because Bitcoin is likely to continue outperforming the broader market as long as this trend holds. -
Scenario 2: BTC Dominance Rising + Bitcoin Price Falling – Altcoin Bear Trend.
If Bitcoin’s dominance is increasing even though BTC’s price is declining, it suggests altcoins are bleeding out more severely (relative to Bitcoin).
This often occurs in early bear markets or during market panics, where investors flee to Bitcoin or to cash, abandoning smaller coins.
In this scenario, it might be wise to scale back altcoin positions or even hold more stable assets, since altcoins are likely to be in a harsher downtrend. One who holds mostly Bitcoin will see their portfolio drop less than someone heavy in alts during these phases. -
Scenario 3: BTC Dominance Falling + Bitcoin Price Rising – Altcoin Bull Market (Altseason).
This is an interesting case that usually signals an altcoin-driven rally. Bitcoin’s price might be going up, but its dominance is slipping, meaning altcoins (perhaps led by Ethereum or others) are rising even faster than Bitcoin. This is the classic “altseason” signal.
In such times, traders might allocate more into high-quality altcoins, as these could yield larger percentage gains. Bitcoin is still doing well (so the overall market sentiment is bullish), but the bigger opportunities short-term might lie in major altcoins, DeFi tokens, or other trending sectors. It’s during these periods that you see many lower-cap coins skyrocketing – but also remember that they can be volatile, so risk management is key. -
Scenario 4: BTC Dominance Falling + Bitcoin Price Falling – Market-Wide Bearishness.
If both Bitcoin’s price and its dominance are dropping together, that’s often a sign of a broad market downturn where investors are exiting crypto in general (possibly moving to fiat or stablecoins). Altcoins might be falling hard (reducing BTC’s share somewhat), and even Bitcoin is declining significantly.
In this case, trading strategy tends to become defensive. Consider taking profits into stablecoins or fiat, or hedging positions. It might be time to reduce exposure across the board because the entire market is in a bear phase. At minimum, it’s a signal to not rely on any crypto asset doing well – even Bitcoin – until conditions improve.

Limitations of Bitcoin Dominance as Trading Indicator
What Is The Flippening? Will Ethereum Merge Finally Trigger It?
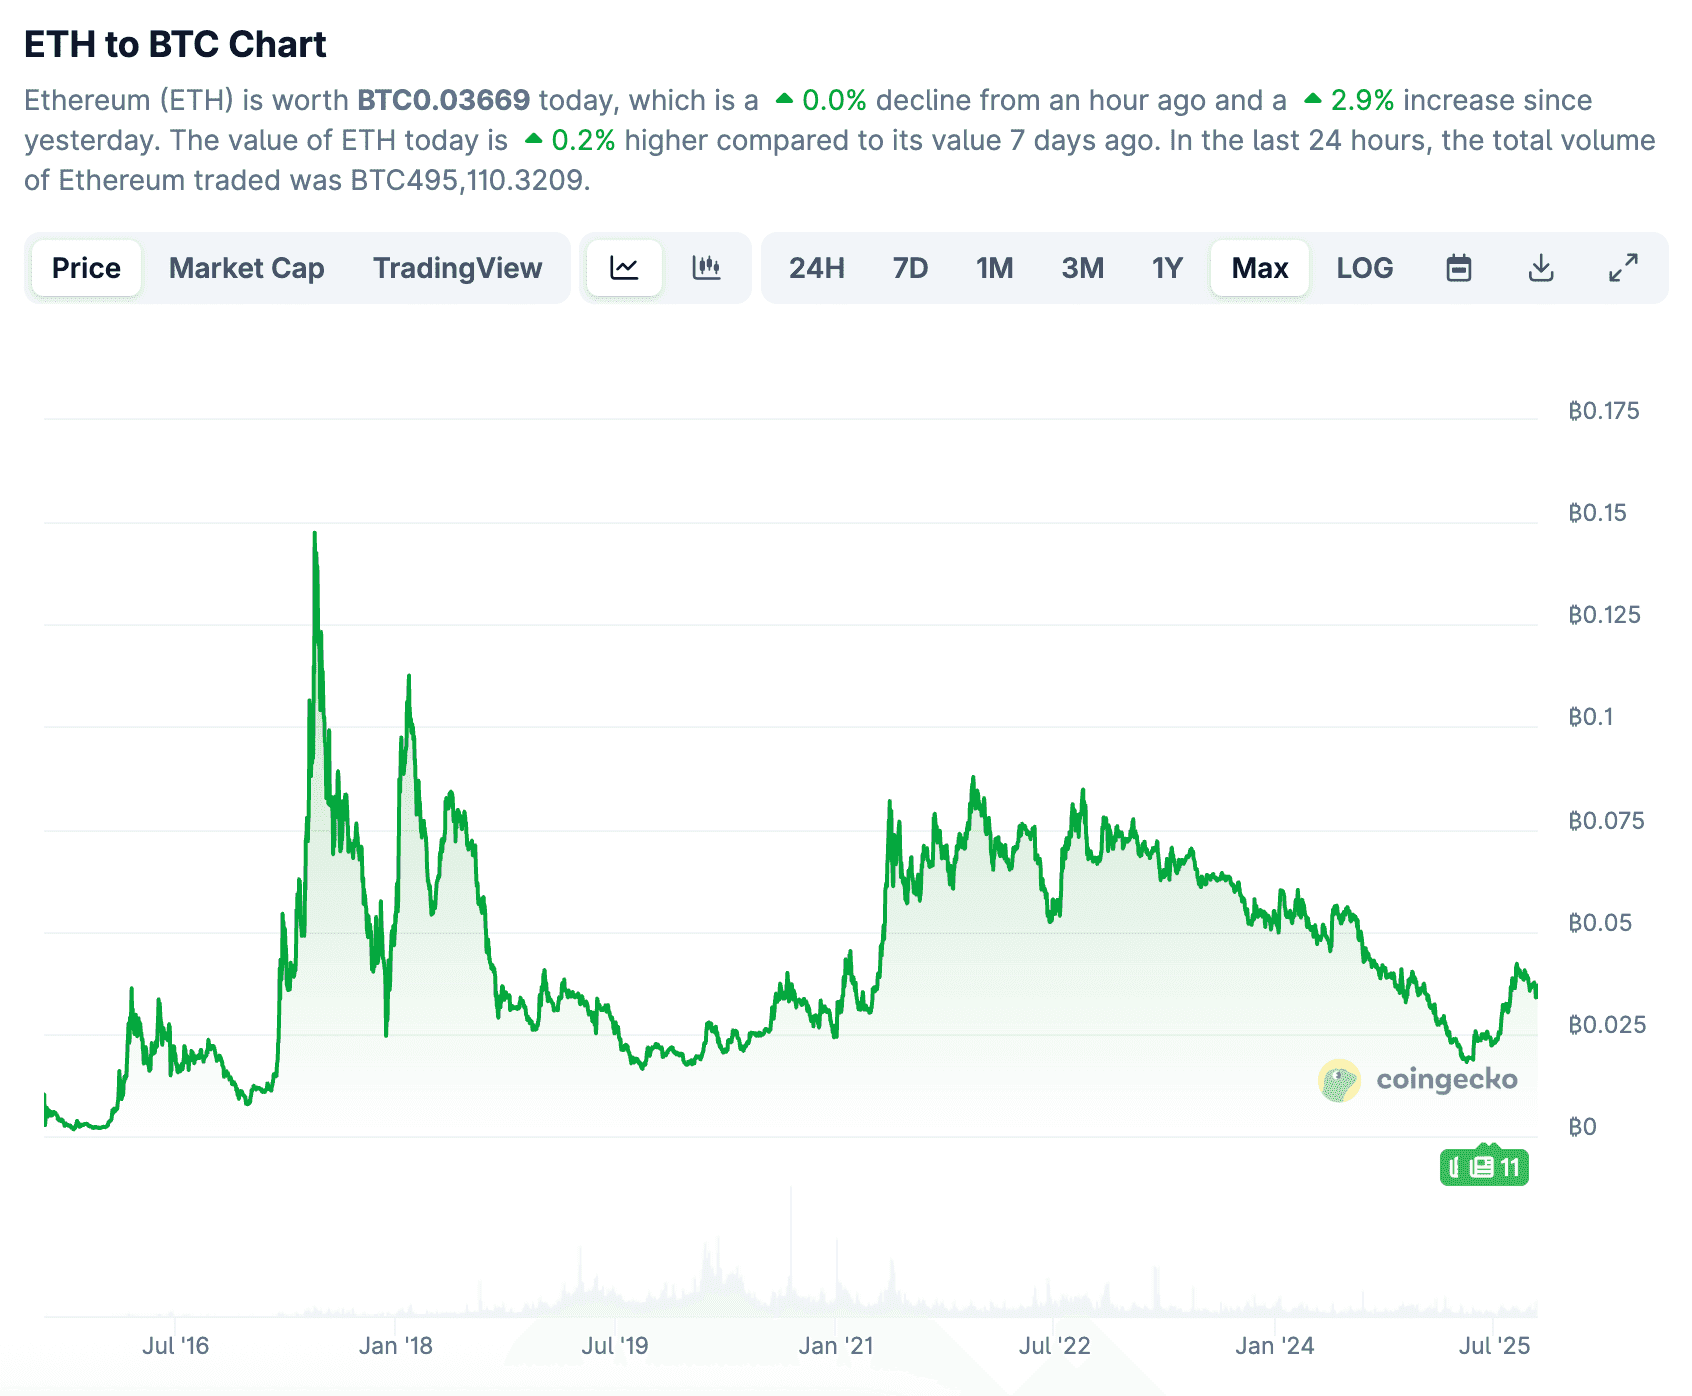
ETH to BTC ratio

What Is the Flappening?
Is Bitcoin Dominance A Good Indicator for the Crypto Market?
Conclusion
If you’re ready to put your Bitcoin Dominance insights into action, having a suitable trading platform can be helpful. Phemex offer options to trade spot and futures markets for Bitcoin and various altcoins, with advanced trading tools and even automated trading bots that may assist in navigating market shifts. Mastering Bitcoin Dominance can provide valuable perspective, and staying informed while monitoring market trends can support your trading decisions. Stay educated, stay vigilant, and may your trading decisions be ever in tune with the market’s rhythm!
FAQ: Bitcoin Dominance Explained
1. Why does Bitcoin Dominance matter?
BTCD reflects market sentiment, showing whether Bitcoin or altcoins are leading. It helps traders allocate funds based on market trends.
2. How often should I check Bitcoin Dominance?
Check BTCD weekly for long-term trends or daily for short-term trading. Use tools like CoinMarketCap for real-time updates.
3. Can Bitcoin Dominance predict market crashes?
While not a crystal ball, rising BTCD during a Bitcoin price drop often signals an altcoin bear market, indicating broader market weakness.
4. What tools can I use to track Bitcoin Dominance?
Use CoinMarketCap, CoinGecko, or TradingView for BTCD charts and data.


