

Summary
-
The Mass Index is an indicator that was developed by Donald Dorsey, an American trader and mathematician who specialized in the reversal trading strategy.
-
The indicator is an oscillator-type indicator that resembles the Stochastic RSI (StochRSI) indicator due to its volatility and high sensitivity. The main difference is that it’s not used for overbought/oversold levels.
-
The “Bulge” in the index is when the oscillator goes up and quickly collapses – this is how traders know that a reversal is coming. According to Dorsey, the golden rule of the Mass Index is to wait until the line goes to 27 or above, and then breaks down to 26 or 26.5. This strategy only works on a 25-period Mass Index.
-
Mass Index is based on multiple Exponential Moving Averages (EMAs) that place weight on recent data, making it suitable for value investing and short-term day trading.
-
The MI indicator will not measure the direction of the trend. The consensus amongst traders is to go long when the EMA points up after the bulge and go short when the EMA points down.
-
The Mass Index indicator is available on all Phemex spot trading and futures trading charts.
Technical traders have long used indicators to help anticipate market trend reversals. One lesser-known but intriguing indicator designed specifically for spotting reversals is the Mass Index (MI). First introduced in the 1990s, the Mass Index has gained a following among experienced analysts for its unique ability to signal potential turning points in price trends. In this article, we’ll explore what the Mass Index indicator is, how it works, and how traders can use it in the crypto markets of 2025.
What Is The Mass Index Indicator?
The Mass Index (MI) indicator is an oscillator indicator used for reversal trading. The indicator is an advanced indicator designed for traders who understand the principles of reversals and how to trade against the market. The “mass” in the indicator stands for the widening gap between the average highs and lows which the indicator measures. The indicator is purely designed to identify reversals and does not identify patterns such as overbought/oversold.
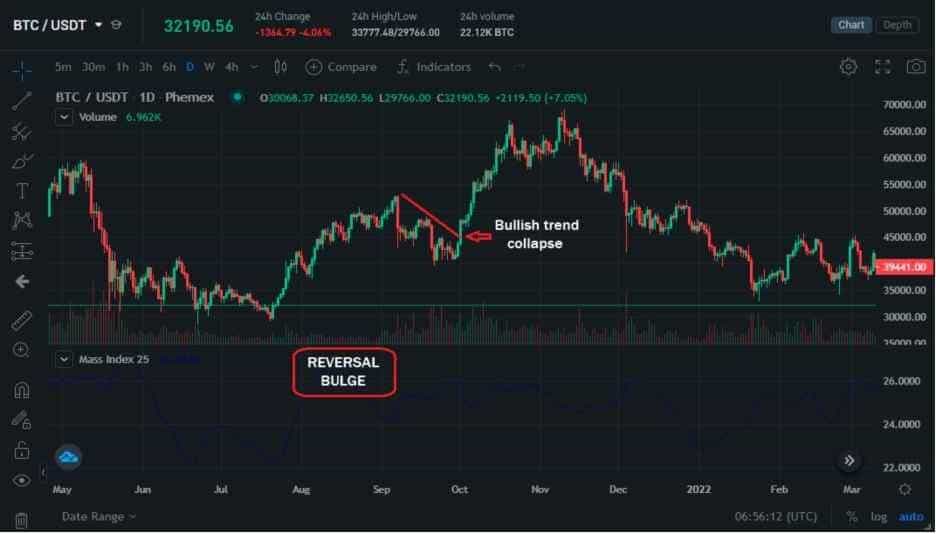
Mass Index can give traders context about the strength of the current trend, and when we can expect it to break down. This example was described in Donald Dorsey’s original introduction of the indicator in the 80s: “Think of the Mass Index as a speedometer on a vehicle. If we’re driving 100 MPH on the road, we can check the speed but we still won’t know if we’re heading North or South.” The same way we’re looking at Bitcoin (BTC) or any other crypto chart, we can clearly see the current trend based on the price but we lack context about how likely the trend is going to hold before it reverses.
Using a mix of multiple Exponential Moving Averages (EMAs) that place weight on recent data, the Mass Index predicts reversals. If the price of Bitcoin is going up fast, eventually it’s going to reverse and this indicator identifies the exact moment. According to Mr. Dorsey (the founder of the indicator), a readout above 27 on the 25-period MI indicates that a reversal is on the way. We will check the validity of this claim using historic Bitcoin averages in the examples below.
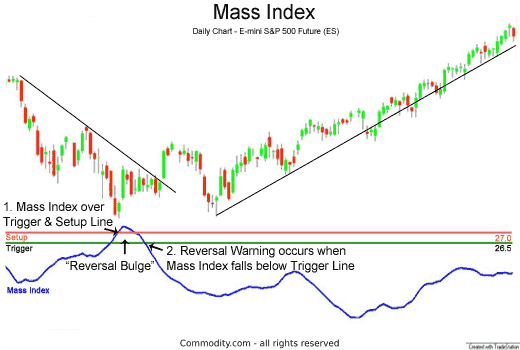
Mass Index Indicator in Traditional Finance (source)
Who Invented the Mass Index Indicator?
The Mass Index was invented by American commodities trader and analyst Donald Dorsey. Dorsey first introduced the indicator in the “Stocks and Commodities” magazine in 1992, but he first discussed the idea of a mass index in the 80s. The rationale behind mass was that if we have a trending market, and a reversal is on the way, the price would effectively “widen”.
The index analyzes market patterns based on volatility. Dorsey warned traders that the indicator will not predict the future trend direction and that it’s up to them to decide if the price is going to go up or down. If we notice a rising trend line, this only indicates the volatility is going up. However, there’s no guarantee the trend will reverse in the direction the trader is suspecting. This makes the indicator effective mostly during trending markets.
How Is Mass Index Calculated?
The Mass Index indicator formula is based on two Exponential Moving Averages (EMAs) and highs/lows. The EMA is one of the most reliable moving averages that place weight on recent data. EMA crossover strategies often predict the future trend effectively. The exact Mass Index formula is the following:
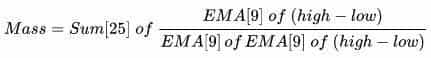
The indicator takes a 9-period EMA as a basis of the calculation and the difference between the recent highs and lows. A 9-period EMA would only account for the average price of Bitcoin (BTC) or any crypto over the last nine days. The second EMA calculates 9-day EMA of the previous EMA and divides them.
The “Mass” of the price takes a sum of 25 while the ratio of the EMAs is 1. The reversal “bulges” Dorsey talked about appear once we hit 27 on the Mass Index, which is why we need to have a basis of 25-periods for maximum accuracy.
On Phemex, the default period length for the Mass Index is 10-periods, but we need to adjust it to 25-periods to make it effective for trading on the daily chart. This is demonstrated in the next paragraph.
How To Use The Mass Index Indicator for Trading?
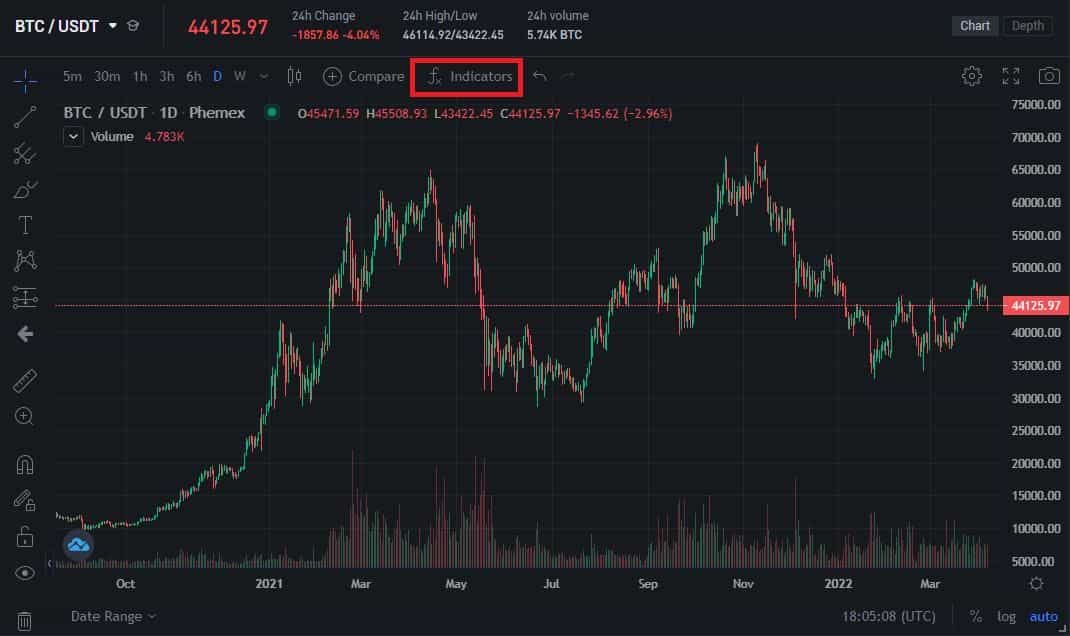
We will now use the Phemex platform to activate the Mass Index technical indicator and change the period length to 25 to account for bulges and reversals. First, head to “Markets” and pick any trading pair. For this demonstration, we’ll use the BTC/USDT pair and press on “Indicators” at the top:
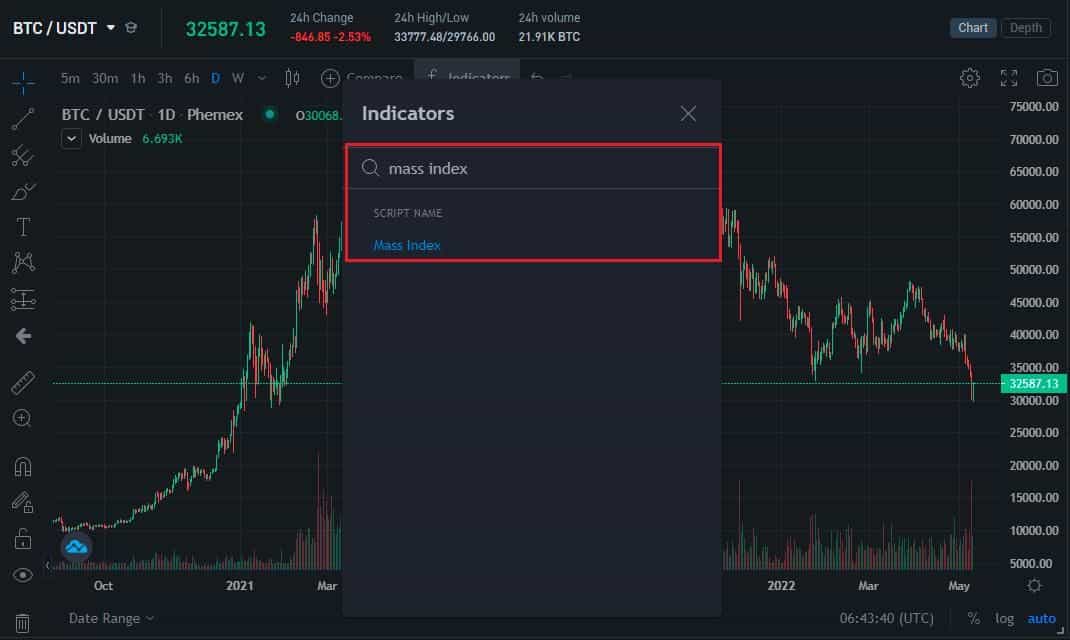
Once we press on the indicators drop-down, you can search for “Mass Index” and the engine will locate it for you:
Left-click on the indicator and it will activate underneath the Bitcoin chart as an oscillator:
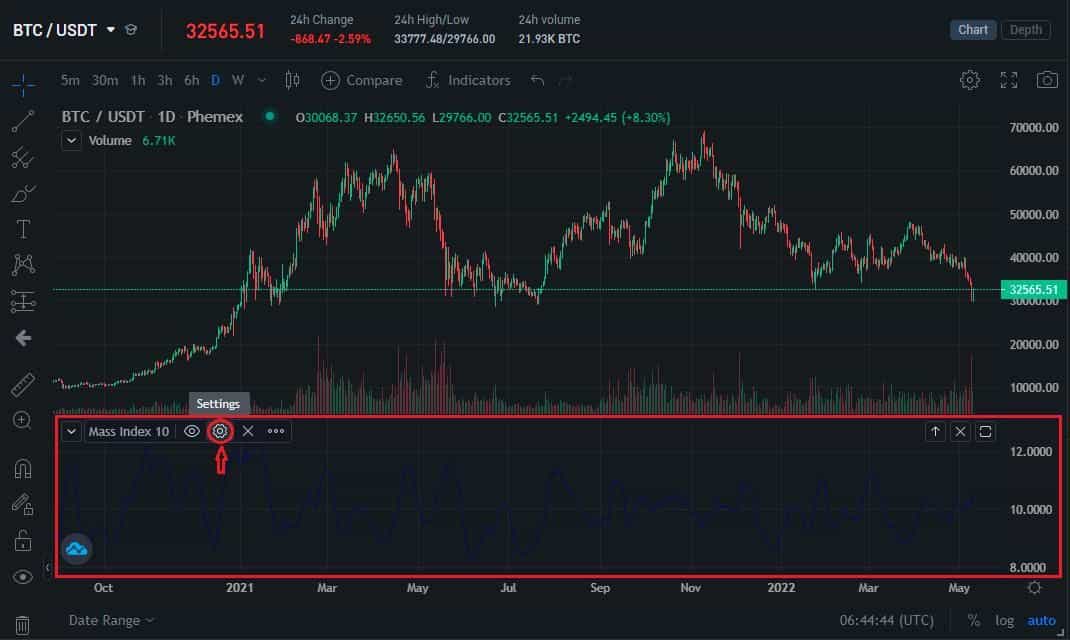
This part is very important. The “Mass Index 10” value indicates we’re trading on a 10-period index, and we need to have 25 periods. If you notice on the right the maximum value is 12 but we need the indicator to hit 27 before we know a bulge is forming. To change this, press on “Settings” as highlighted above and change the length to 25 periods:
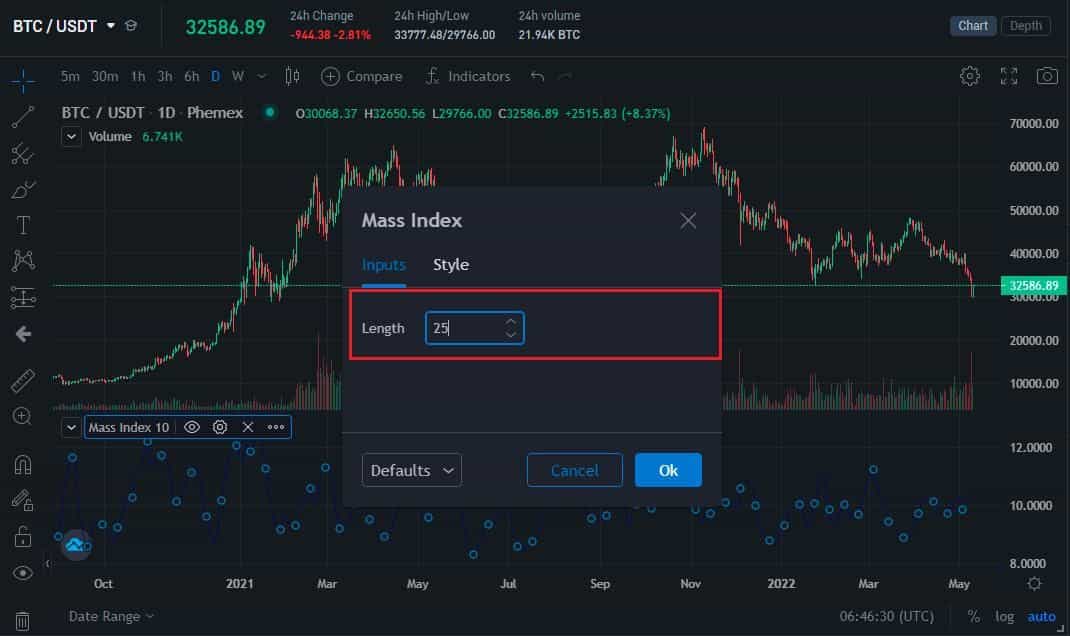
Press “OK” to confirm the change and you will see the upper line now reaches 27 and more:
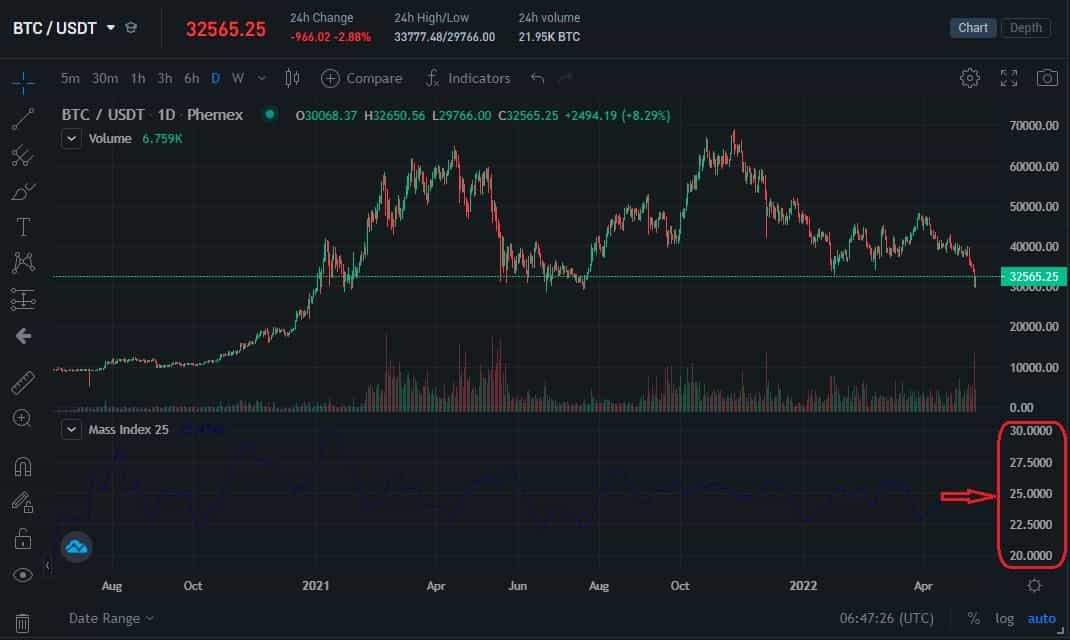
We are now ready to start learning about a reliable Mass Index indicator strategy!
What is The Mass Index Indicator Strategy?
The original instructions laid out for trading by Donald Dorsey came up with two arbitrary numbers that identify “bulges”: 27 and 26.5. This reversal bulge states that once the rating on the 25-period Mass Index reaches “27” and reverses down to “26.5”, we can expect a reversal of the current trend. Let’s verify the validity of this claim using the Bitcoin chart:
There are few instances where the Mass Index reached 27 on the chart – and it accurately predicted a bearish divergence on the daily chart. However, the maximum it seems to reach is 26. This could be a turning point for most reversal strategies in crypto as the indicator was initially developed for the less-volatile stock markets.
While this indicator resembles the RSI and StochRSI indicators due to its oscillator shape, it should not be used for trend predictions because it was only designed for the reversal strategy. Traders are advised to use it on the 1D (daily) chart. However, if we use it on short-term charts such as 4H (hourly) in combination with the EMA cross indicator that uses a 9-period and 25-period EMA, we can get unique insights:
The indicator reached 27 and crashed back down to 26.5 in this case – a textbook Dorsey example. We could expect a reversal in either direction at this point. The EMA Cross indicated that the long (25-period) line crossed the short (9-period) line which is a sell signal. The price of Bitcoin quickly collapsed and went from an uptrend to a downtrend.
The Mass Index rarely goes over the 27 mark on a 25-period chart as we can see above. This makes it useful only for patient traders who can wait until the price widens and the reversal is confirmed on the indicator.
Mass Index Strategy and Tips
Dorsey identified two numbers somewhat arbitrarily (27 and 26.5) for the bulge criteria, but those have stood the test of time in many markets. Here are some strategy tips when using the Mass Index:
-
Use 25-period Mass Index: The classic signal works on a 25-period calculation. Using a shorter summation (say 10 or 15) might produce more frequent bulges but many will be false alarms. Using longer (like 30+) could miss timely signals. 25 has been a sweet spot historically.
-
Trending Markets Only: The Mass Index is most useful when the market is in a pronounced trend. In a sideways, range-bound market, you might see the Mass Index wiggle around without clear bulges, or bulges that don’t lead to big moves. It shines when volatility is expanding due to a strong trend that is about to break.
-
Combine with Trend Indicators: As noted, combine MI with a trend-following tool. One common approach is after a bulge, look at a moving average crossover or an oscillator like MACD histogram flip to confirm the new trend direction. The Mass Index says “reversal likely soon,” then you wait for evidence of that reversal.
-
Don’t Trade Every Bulge Blindly: Not every bulge leads to a huge reversal; sometimes it might just precede a brief pause or small correction. It’s wise to use risk management (stop losses) and not assume any single indicator is 100% accurate. Consider the broader context – e.g., are there fundamental news or other market factors at play that could override a technical signal?
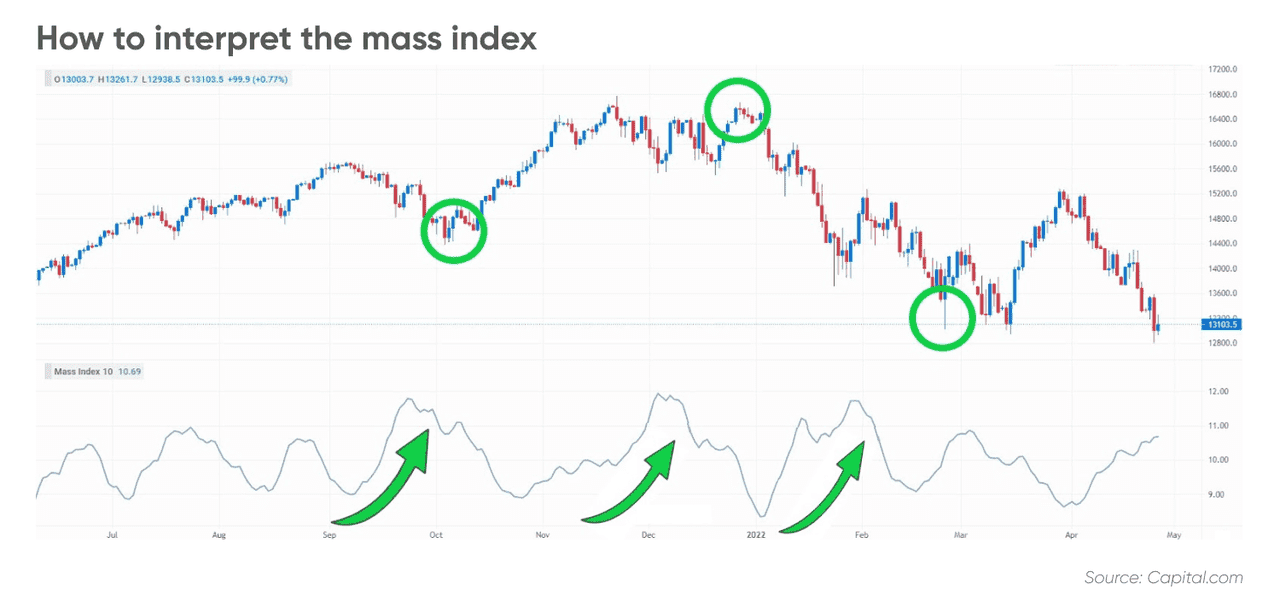
Interpreting Mass Index (source)
Analyzing Mass Index in Crypto Markets
Cryptocurrencies often experience bursts of volatility, which in theory makes the Mass Index quite relevant. For example, during a crypto bull run, daily ranges can widen dramatically (prices making large high-to-low swings each day). The Mass Index would rise in that scenario. When volatility then suddenly subsides – for instance, the range tightens even as price is still climbing – it could signal that the trend is exhausting. Conversely, in a deep bear market, big range days might start appearing more frequently as selling climaxes, pushing the Mass Index up; once the panic selling calms (range narrows), a bottom could be near.
It’s interesting to note that backtests on some assets have shown the Mass Index alone isn’t a surefire money-maker. One quantitative analysis found that a basic strategy using the Mass Index had mixed results and required additional filters to be profitable. This reinforces that the MI is best used as one component in a trader’s toolkit, not a stand-alone system.
As of 2025, most trading platforms (including crypto exchanges like Phemex and charting tools like TradingView) offer the Mass Index indicator in their suite. Setting it up usually involves:
-
Adding the Mass Index to your chart (it will default to the typical 9/25 settings).
-
Drawing horizontal lines at 27 and 26.5 for reference.
-
Observing when the MI line crosses above and below these thresholds.
Some traders also keep an eye on extreme values. For instance, an unusually high Mass Index value could indicate an exceptionally volatile period that’s unsustainable. But generally, it’s the cross back below that matters for the signal.
Conclusion
The Mass Index is difficult to grasp which is why it’s not a popular indicator. It might look identical to strength oscillators, but unless a trader is in tune with what it’s designed for and how to adjust the period length for effective use, they will have a hard time with the indicator. We recommend starting by adjusting the indicator to a 25-period length as it was intended and then developing your own Mass Index trading strategy for the reversals.
Traders often use the indicator with the EMA Cross which sends buy and sell signals when there’s a cross between two EMAs. In this case the Mass Index could be used as a verification tool that the price widened and that a reversal is on the way. Others prefer to use it with the Simple Moving Average (SMA). Develop a strategy based on your trading style and how long you can stay in the trade, because it’s effective on both long-term and short-term charts.
To learn more about technical indicators you could combine with the Mass Index indicator, visit our technical analysis (TA) section.