

The world of trading strategies is full of terminology. Terms like highs, lows, higher highs, and lower lows get thrown around constantly, especially in discussions of market trends. But what do these terms really mean, and how can understanding trading highs and lows help you become a better crypto trader? In simple terms, market highs and lows refer to the highest and lowest prices an asset reaches in a given timeframe. Traders pay close attention to how these highs and lows evolve over time, because the pattern they form defines the market’s trend. Recognizing these patterns is extremely useful in crypto trading. It can tell you if a coin is in a bullish uptrend, a bearish downtrend, or just moving sideways. In this article, we’ll break down what “trading highs and lows” means, why it matters, and how to apply it in your crypto trading strategy.

What Are Highs and Lows in Trading?
Highs and lows in trading simply refer to the highest and lowest price a security or asset has been traded at, respectively. This will usually be expressed in a time-based format, to show how much the price has moved within a certain time period. Thus, for example, a 20-day high/low would show the highest and lowest price a security has achieved in the last 20 days, a 52-week high/low would show a price’s peaks and troughs during the last year, and so on. Importantly, these highs and lows are based on the value of the security at the end of each trading day, which is called the closing price. This means that the value of an asset can breach the high or low mark during a trading day, but this will go unrecorded unless it ends the day (or closes) with that price.
While this is easy to understand in itself, complication begins to arise when traders analyze the patterns left by high/low marks in order to identify when to apply different forms of trading strategy. These patterns (and strategies) involve many variations on the high/low format, as we will begin to see in the following sections.
What Are Higher Highs and Lower Lows?
When a trader refers to higher highs and lower lows, or lower highs and higher lows, they are expressing their confidence in the future performance of an asset or security. When used in combination with one another, these values can help determine trends in the market and allow traders to develop strategies based on these trends. To identify upwards trends in asset value they use this extremely simple technique involving lower highs and higher lows:
-
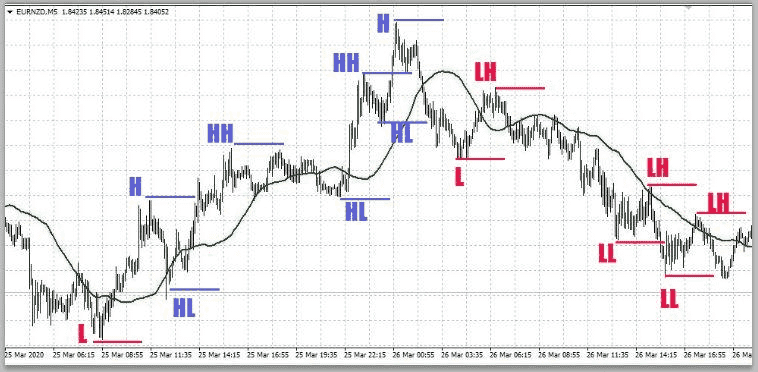
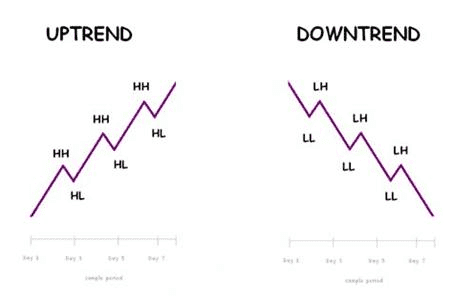
Higher high: If the price of a security closes at a higher price than it did at the close of the previous day, which was also a high, then it is referred to as a higher high. This is a reasonable indication of a rising trend (especially when combined with higher lows), giving a trader confidence that the value of the asset is likely to continue rising in the near future.
-
Higher low: If the price of a security closes at a low price, but that low is higher than the low at the close of the previous day, then it is referred to as a higher low. This is a reasonable indication of a rising trend (especially in combination with a higher high), giving a trader confidence that the value of the asset is likely to continue rising in the near future.
When identifying downwards asset value trends they use a very similar technique:
-
Lower low: If the price of a security closes at a lower price than it did at the close of the previous day, which was also a low, then it is referred to as a lower low. This is a reasonable indication that a trend is dipping (especially when combined with lower highs) and gives a trader confidence that the value of the asset is likely to continue to descend in the near future.
-
Lower high:If the price of a security closes at a high price, but that high is lower than the high at the close of the previous day, then it is referred to as a lower high. This is a reasonable indication that a trend is dipping (especially when combined with a lower low), giving a trader confidence that the value of the asset is likely to continue descending in the near future.
-
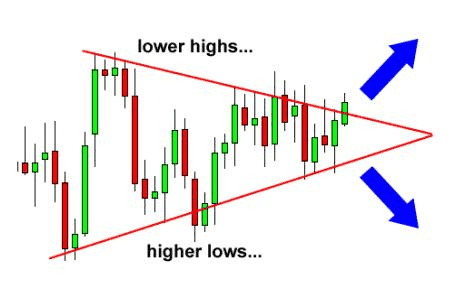
Mixed pattern: Sometimes you might hear about a mix like higher highs combined with lower lows. This means the market is extremely volatile or indecisive: hitting a higher peak on one day, then plunging to a lower trough soon after. Such a higher high + lower low pattern is relatively rare and usually indicates an unstable situation that’s hard to predict. Traders generally don’t base a whole system on this odd combination, but its occurrence can be a clue that the market is choppy or transitioning.
Thus, a higher high plus a higher low is an indicator of the expected and continued rise in value of a security or asset, while a lower low plus a lower high is an indicator of just the opposite. This allows a trader or investor to temper their expectations when it comes to the performance of the security/asset in question. In turn, this allows the trader to develop certain strategies based on this knowledge.
What Is Higher High/Lower Low Strategy?
While these concepts are used to add weight to trading decision making, it is generally quite rare that trading systems or strategies will be based from a higher high/lower low conjunction. This is because a higher high/lower low pattern is usually indicative of a fairly unstable security, making its future movements hard to predict (at least, based on this indicator in isolation). However, this in itself can be useful information, although it takes a skilled/lucky market analyst to accurately predict the outcome of such a situation. Many traders study the movements of markets for years before they start to gauge what such signals mean, if they ever achieve such knowledge, and it usually takes many more years of study, trial, and error before they start to develop strategies of their own.
How to Identify Lower Highs and Higher Lows Pattern
Identifying lower highs and higher lows in a pattern by which to base trading strategy is again fairly rare, though certainly not unheard of. Experienced traders have learnt various methods to exploit lower high/higher low patterns during downtrends, allowing them to capitalize on changes in the market. In fact, one such way would be to use a spread trading tactic in an inverted way for a more standard lower high/lower low model. However, it is important to note that many different professional investors, analysts, and brokers have also developed their own strategies — since there is no one correct way to tackle the market. Generally, those seeking to capitalize from higher high/lower low or lower high/higher low patterns use what are known as “countertrend” strategies.
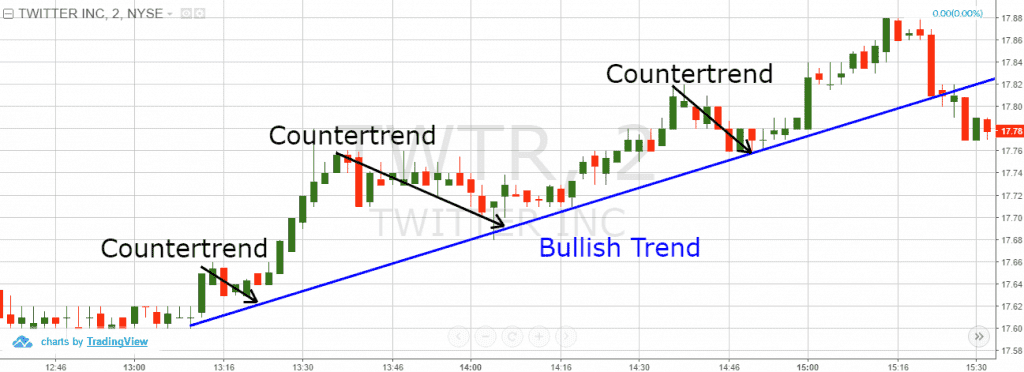
Higher High/Lower Low and Lower High/Higher Low Patterns in Countertrend Strategies
When an investor or trader employs a countertrend strategy they will attempt to make small profits (or gains) by trading against a current, wider trend. This is also known as contrarian investing, or sometimes just countertrend trading. Normally, a trader will only attempt some form of countertrend strategy if they are under the assumption that an established trend will see a small market pullback during its upward ascent. In this case, they will try to profit from these small periods of reversal. This is why countertrend trading is usually a medium-term strategy at most, meaning positions are generally only held for a few days, or weeks at the absolute maximum.
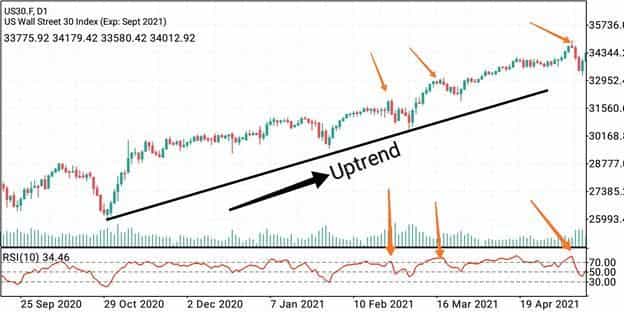
It is extremely important that investors wishing to engage in countertrend activity are very aware of the market and well-versed in investment strategy in general, as this can be a risky way to attempt to gain from a market trend. This is why countertrend traders are often adept at using and studying momentum indicators, such as those discussed earlier. Traders that succeed in maximizing gains using countertrend strategies often do so by correctly predicting and thereby profiting from corrections in the price movements of trending securities (such as cryptocurrencies, for example).
What Are the Pros and Cons of Using Countertrend Trade Strategies?
There are a number of advantages and disadvantages to using countertrend strategies, which is another reason why it is important to understand the market in which one operates before attempting such a trading activity.
-
Shallower high/low periods: Countertrend strategies exhibit less high/low oscillation than more trend-friendly models, even if only because they generally take less time to execute. Traders make smaller profits using trend averse strategies, but make those profits more frequently, thus balancing out their positions. Although trend-following strategies are far more likely to produce substantial gains, they are usually a far slower process than using a countertrend strategy.
-
Increased opportunity for trades:When the price of a security fluctuates between consistent high/low prices, it gives investors many opportunities to both buy and sell short. Again, this can only be done to any kind of meaningful effect if the trader has a good understanding of the market in which they operate. However, an investor may experience relatively long periods of inactivity if only trading against trends by capitalizing on small market corrections.
Just as equal and opposite reaction is an instrumental concept in physics, it is important to remember that with any beneficial trading strategy there will be drawbacks, which can prove disastrous if misunderstood or ignored:
-
Higher and more frequent commissions: More trading opportunity means paying more commission. Traders who frequently engage in countertrend activity will often make a significantly higher number of (less lucrative) transactions than a trend-following trader. This is why countertrend traders often use a per-share commission model, meaning their broker will only charge per-share traded, rather than per-trade (which is the standard). This can allow a trader much needed flexibility, which is crucial when dealing with shorter term investments.
-
Increased monitoring:The market corrections a trader follows when executing a countertrend strategy are much shorter and smaller than the actual trends themselves. It therefore follows that they must monitor these positions more intently than with other, more typical investments. Of course, just as with almost all aspects of financial strategy, an investor can automate their buy/sell (put/call) options to overcome this hurdle.
Psychology of Trading Highs and Lows
Understanding the patterns of highs and lows in trading is crucial as they reflect market psychology. Higher highs and higher lows indicate that buyers are in control, showing bullish sentiment. For example, if Bitcoin reaches a new peak and doesn't drop as low as before, it signals confidence among buyers. This collective optimism pushes prices higher.
Conversely, lower highs and lower lows suggest growing pessimism. If Ethereum falls to a low but rebounds below the previous high, it reflects active sellers anticipating further declines. This pattern indicates bearish psychology, where traders are quick to sell, causing prices to drop.
An interesting scenario occurs when there's a higher high and a lower low simultaneously, indicating market confusion. This mixed signal might suggest indecision among traders, resulting in significant price volatility.
In summary:
-
Bullish Trend (Higher Highs/Lows): Traders are confident, driving prices upward.
-
Bearish Trend (Lower Highs/Lows): Traders fear further drops, leading to falling prices.
-
Transitional/Indecisive Patterns: A sign of market volatility and caution.
These patterns visually represent crowd behavior and can guide trading decisions based on prevailing sentiment.
How to Trade Using Highs and Lows
Using highs and lows in a trading strategy typically means aligning your trades with the trend or, in some cases, betting on a trend reversal. Here are a few approaches to consider:
-
Trend-Following Strategy: This strategy involves trading in the direction of the trend. In an uptrend, traders seek buying opportunities on pullbacks, entering near higher low support zones while placing stop-losses just below those levels. Conversely, in a downtrend, traders short sell when a lower high forms, using stop-losses above it. This strategy capitalizes on market momentum.
-
Countertrend (Reversal) Strategy: More advanced traders look for signs of trend reversals, which is riskier as it goes against the current trend. For instance, in an uptrend, a lower high may indicate exhaustion, prompting traders to short. In downtrends, a higher low might signal a potential bullish reversal. Confirmation signals like momentum indicators can help validate these trades, but caution is essential, as many reversals fail.
-
Breakout Trading: This strategy focuses on key high/low levels as breakout points. Traders buy when an asset breaks above resistance (e.g., a higher high) or short when it breaks below support (a new lower low). Confirmation of the breakout, such as holding the new level, is crucial to avoid false breakouts.
-
Using Highs/Lows for Targets and Stops: Even if using other indicators, understanding highs and lows can refine execution. Take-profit targets can be set at previous highs/lows, enhancing overall strategy effectiveness.
In all cases, it’s wise to combine high/low analysis with other tools. Price highs and lows alone are powerful, but they don’t account for everything. Volume, momentum oscillators, and other indicators can provide confirmation.
Conclusion
Mastering the art of trading highs and lows can significantly boost your crypto trading game. By clearly identifying whether an asset is trending up, down, or sideways based on its peaks and troughs, you gain a strategic edge in decision-making. You’ll know when to ride the trend, when to step aside, and when a reversal might be brewing. Always remember that while the terminology may seem technical, the underlying idea is straightforward: higher highs and higher lows signal bullish strength, lower highs and lower lows signal bearish weakness. Use this knowledge in conjunction with risk management and other analysis tools for the best results.
Finally, to truly trade like a pro, you need the right platform. Phemex is a professional crypto exchange that provides an ideal environment to put these strategies into practice. Phemex offers a full range of features for traders: you can trade both spot and futures markets (so you can profit from uptrends or downtrends) and even set up automated trading bots to execute your trend-following strategies around the clock. If you’re sitting on crypto waiting for the perfect trade setup, Phemex’s Earn Crypto accounts let you earn interest on your holdings in the meantime, turning idle funds into an additional source of yield.