

Summary
-
Diamond patterns are chart patterns that are used for detecting reversals in an asset’s trending value, which when traded with properly can lead to great returns.
-
The diamond pattern looks similar to a head and shoulders pattern but with a V-shape neckline. It has four trendlines, consisting of two support lines and two resistance lines。
-
There are various factors to consider when looking at the diamond pattern in trading, including the level of volatility, whether it is bearish or bullish diamond pattern trading, and stop loss orders.
、
When analyzing a price chart, a trader must be aware of what they are looking for — otherwise they will simply be staring at candle sticks. What they are looking for are patterns that will indicate a breakout of a trend, a continuation, a reversal, or something else, as recognizing these early can mean great returns. These patterns are the starting point for any good technical analysis, showing the shifting supply and demand of an asset and indicating what might come next. Thus, as with supply and demand, these patterns can vary enormously. One pattern that is considered rare but able to yield great returns when spotted, is the diamond chart pattern.
What Is The Diamond Pattern?
Diamond patterns are chart patterns that are used for detecting reversals in an asset’s trending value, which when traded with properly can lead to great returns. These diamond reversal patterns can take long periods to complete, even years, but when correctly assessed, the trend reversals they indicate can be drastic and take less time to complete than the pattern itself. This means that if a trader locates a strong diamond pattern and knows how to trade with it, they can expect some great returns on their trade.
In technical analysis, a diamond chart pattern is a rare reversal formation that suggests a potential trend change. It usually appears after a prolonged trend and features price action that first broadens and then contracts, forming a diamond or rhombus shape. This pattern signifies a struggle between buyers and sellers, with initial volatility expanding before stabilizing as one side gains control.
There are two types of diamond patterns:
-
Diamond Top (Bearish Diamond): Forms after an uptrend, signaling a potential downtrend.
-
Diamond Bottom (Bullish Diamond): Forms after a downtrend, indicating a possible uptrend.
Both share a similar structure, differing only in the preceding trend and expected breakout direction. While considered relatively reliable compared to other patterns, diamond patterns are uncommon, especially on lower time frames.

A typical diamond pattern (Source: investmentu.com)
Diamond Patterns In Long Trades and Short Trades
Diamond patterns can indicate reversals going in either direction, so a trader must familiarize themselves with how to trade in both directions:
-
Long trades: These will be used when the reversal is in a bullish direction. Simply buying at its low breakout point and selling at the end of the trend.
-
Short trades: These will be used when the reversal is in a bearish direction. Simply borrowing an asset and selling it for X value at the breakout point, and then buying it back to return it at the now reduced Y value at the end of the bear run — this will result in a profit of the difference between X and Y.
However, spotting the diamond pattern can be difficult due to its rarity, which can mean that a trader will not be expecting it or will not be familiar with how it looks. Thus, when diamond pattern trading, the most important thing is to locate the pattern and not become confused and falsely identify one.
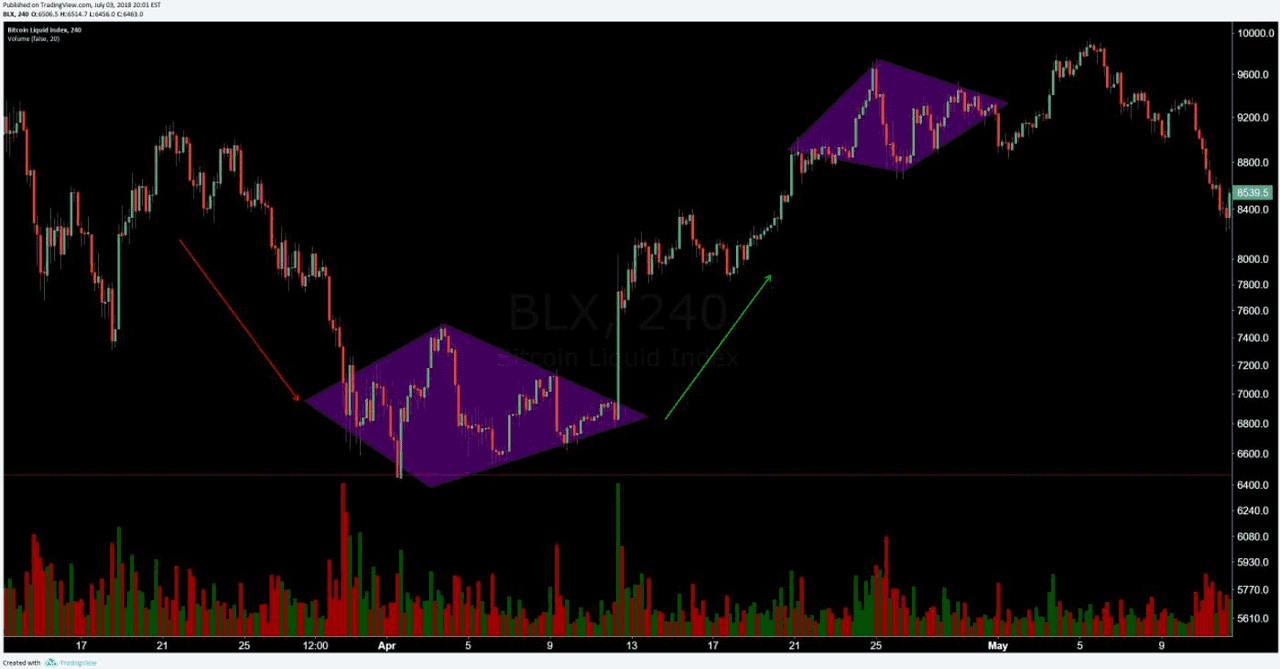
Two diamond patterns in a Bitcoin (BTC) chart: first, a diamond bottom pattern; second, a diamond top pattern. (Source: tradingview.com)
What Does The Diamond Pattern Look Like?
The diamond pattern looks similar to a head and shoulders pattern but with a V-shape neckline. It has four trend lines, consisting of two support lines and two resistance lines, which connect the highs and lows of the asset during the pattern’s period. These are important to note as they help establish when to enter a trade.
To create the diamond formation, the asset’s value waves on the chart must first widen/broaden between highs and lows (broadening triangle), and then become tighter/converge (symmetrical triangle). For the formation to be complete, it must also have a minimum of two touch points on each of the trend lines.
Key Characteristics of the Diamond Pattern
To identify a diamond pattern in price charts, look for these key characteristics:
-
Broadening Then Narrowing Range: The pattern starts with wider price swings (higher highs and lower lows) followed by narrowing swings (lower highs and higher lows), forming a diamond shape with trendlines.
-
Symmetry: A well-formed diamond features symmetry between the expanding left side and the contracting right side, resembling an expanding triangle on one side and a symmetrical triangle on the other.
-
Distinct High and Low Points: The pattern has a clear highest high and lowest low that mark its extremes, which are connected by the widest part of the diamond.
-
Volume Pattern: Volume typically starts high during the broadening phase, diminishes in the middle, and spikes during the breakout. For instance, in a diamond top, volume may surge at the peak, decrease during consolidation, then rise again on the breakout.
-
Duration: Diamonds take time to form, often spanning weeks or months on higher timeframes (daily or weekly charts). Quick, intraday shapes may not be true diamond patterns.
These features can sometimes cause confusion with other formations, like Head and Shoulders. However, spotting the unique broadening-to-narrowing structure confirms it's a diamond pattern.
Diamond Chart Pattern Explainer (source)
What Types of Diamond Patterns Exist?
As with most patterns that can be bearish or bullish, the diamond pattern also has two types — with both requiring familiarization if one is to go into diamond trading. These two types are the diamond top pattern and diamond bottom pattern:
-
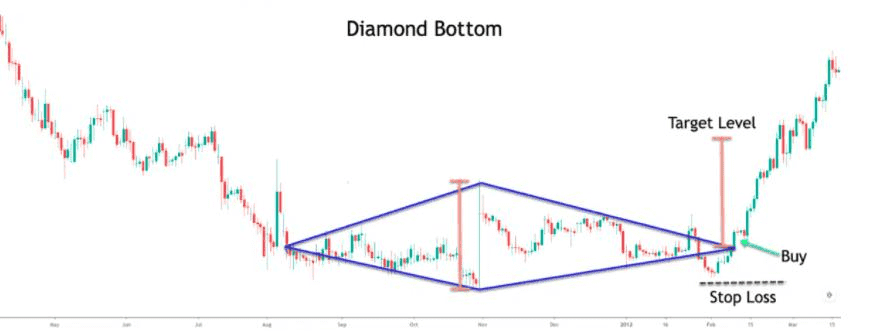
Diamond bottom pattern: Considered a bullish pattern, the diamond bottom pattern will show a reversal of a trend that breaks out from a downward (bearish) momentum into an upward (bullish) momentum.
-
Diamond top pattern: Considered a bearish pattern, the diamond top pattern will show a reversal of a trend that breaks out from an upward (bullish) momentum into a downward (bearish) momentum.
Diamond bottom pattern, which shows a bullish breakout. (Source: investcrown.com)
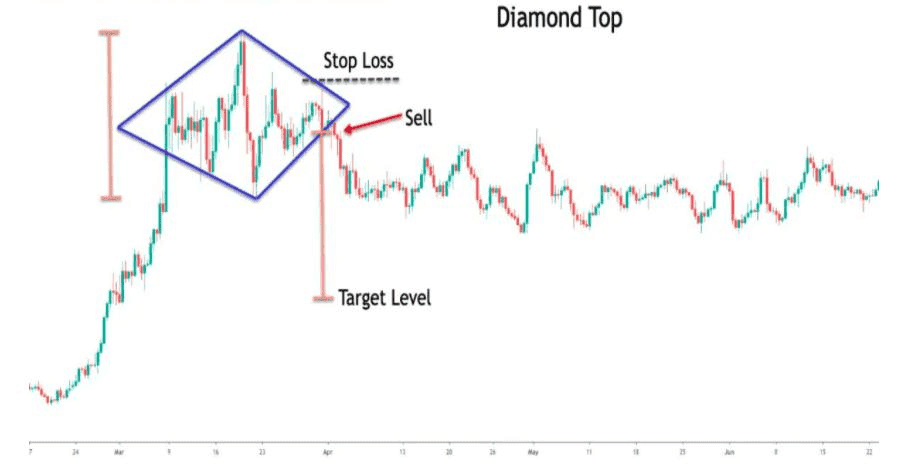
Diamond top pattern, which shows a bearish breakout. (Source: investcrown.com)
How To Trade With The Diamond Pattern
When looking at the diamond pattern in trading there are various factors that one should consider, including the level of volatility seen within the diamond shape, whether it is bearish or bullish diamond pattern trading, and stop loss orders. The simplest way to analyze this effectively is by separating the diamond pattern into its two trading types:
-
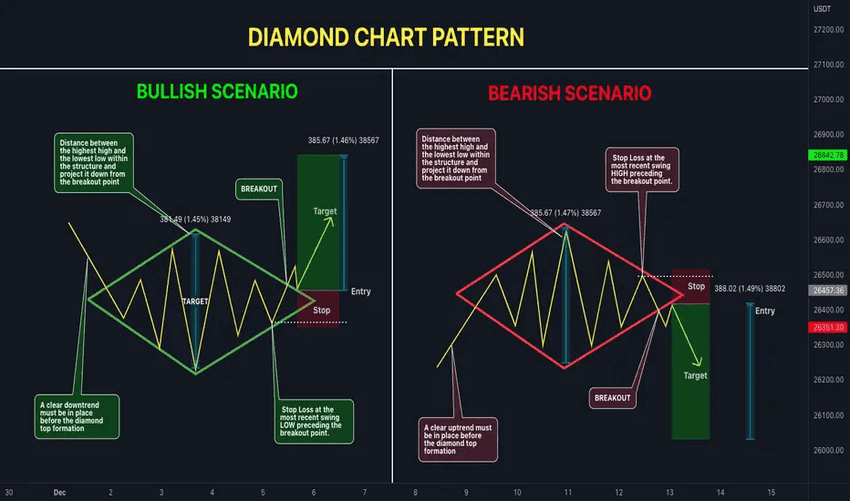
Diamond bottom pattern trading: As a bullish pattern, traders will understand this pattern as an indicator to go long on their trade. They will first identify the bullish trend followed by the diamond pattern, and then identify the following points:
-
Point of entry: The trader should buy into the trade after the pattern breaks out from the upper resistance level in a bullish trend. Remember that this must be after the pattern has had a minimum of two touch points on each of the trendlines, otherwise it is not a diamond pattern.
-
Target profit point: To calculate the length that the breakout trend will be, and so find their sell point, a trader will measure the distance at the widest part of the pattern. This is the point straight down from the highest high and lowest low of the pattern, which is also the meeting point between the broadening and symmetrical triangles that form the diamond pattern. They will then take this measure and project it from the breakout point upward, following the bull trend breakout, to identify their profit taking point. The bull trend may also fall short or go on for longer, so it is important to check on the trend’s progress. This can also be helped through the use of additional trading tools and indicators during the technical analysis stage, which can help to verify predictions.
-
Stop loss: When looking to trigger an automatic buy if the trend turns bullish after a diamond pattern, a trader will place a stop loss order above the upper resistance level around the point of the pattern’s last high, but not its highest high. This will mean that the trader will not lose much if this happens, but it will avoid triggering a buy order if the pattern simply has a little more volatility before beginning its descent into the bearish trend. If the stop loss is placed too close to the breakout point, that triggered buy due to volatility could mean missing out on the trend and thus the returns.
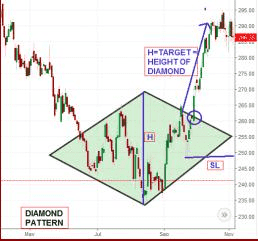
A graphic of where to place a stop loss (SL) order and how to calculate the target height of the breakout trend in a diamond bottom pattern. (Source: moneycontrol.com)
Diamond Pattern in Crypto Markets: Examples
Diamond patterns have appeared in crypto, though infrequently. One recent example occurred on Bitcoin’s chart in mid-2025. In June 2025, Bitcoin’s price in the ~$100K range formed a Diamond Top pattern on the daily chart, signaling a potential bearish reversal. The price had run up above $100,000 with high enthusiasm, but then the pattern began to take shape as volatility increased and then tightened. Traders noticed the characteristic broadening of highs and lows followed by convergence. When Bitcoin failed to break above about $110K and started slipping, the diamond’s support gave way. Following the downward breakout, analysts warned of a possible drop toward the next major support around $80,000. Indeed, Bitcoin’s price fell sharply in the weeks after the break, validating the diamond top pattern as a precursor to a trend change.
Earlier instances of diamond patterns in crypto are relatively rare. Back in late 2020, some traders spotted a diamond bottom on smaller altcoin charts as the market was recovering from the 2020 crash, but those were debatable. More famously, technical analysts have pointed out that the 2017 Bitcoin top had a structure resembling a diamond (with the blow-off peak to $20K), though it wasn’t a textbook-perfect formation.
Given crypto markets’ tendency for volatility, when diamond patterns do occur, they can precede significant price swings. It’s also worth noting that high volatility in crypto can sometimes produce near-diamond patterns that don’t fully meet all criteria – for example, an expanding then contracting range that is not symmetric or lacks a clear volume signature. Traders should use caution and possibly corroborate with other indicators (like momentum oscillators or support/resistance levels) before acting solely on a presumed diamond pattern.
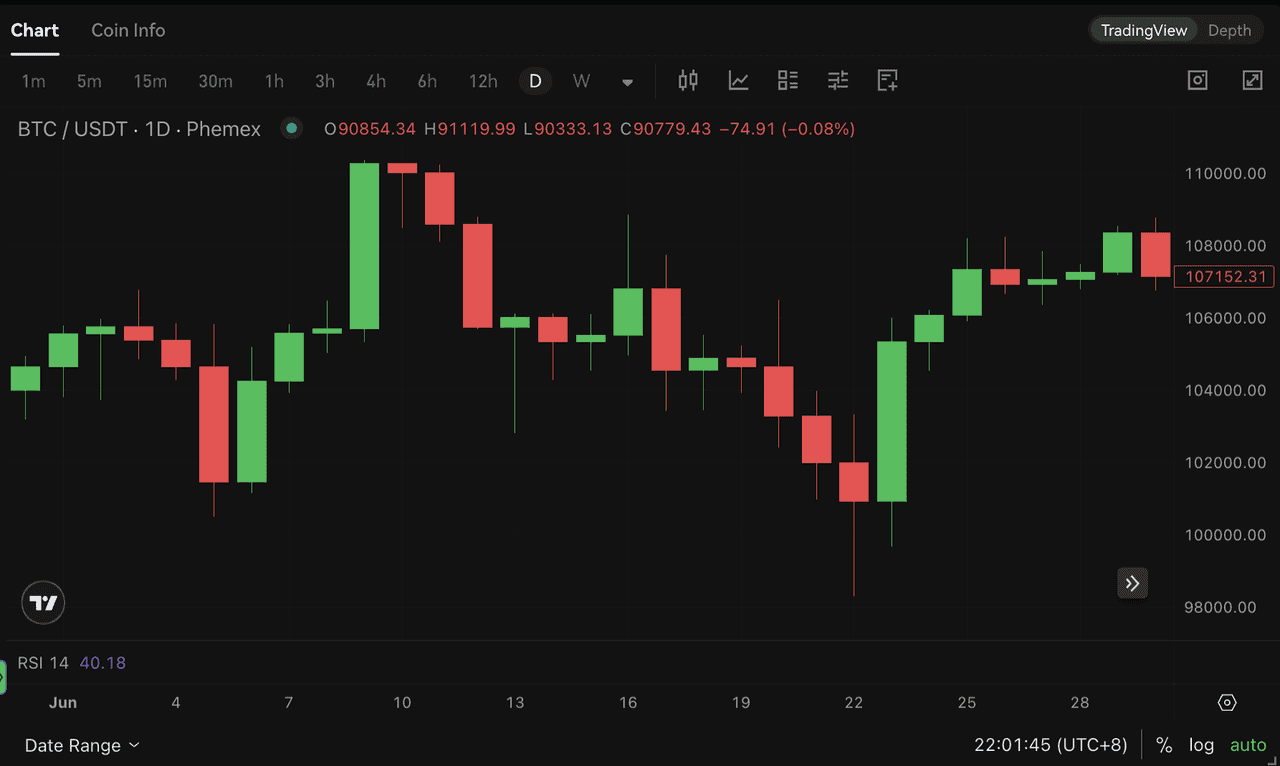
BTC/USDT Daily Chart for June 2025 on Phemex displaying diamond pattern (source)
Conclusion
Diamond patterns are some of the best patterns to use in trading because of their good reliability for high returns. However, they are quite rare and should not be confused with the similarly shaped inverse head and shoulders or triple bottom patterns if a trader is looking to get the best out of them. Thus, it is important that a trader fully understand this pattern and its variants, as well as how to trade with them, before looking for them in the charts.
Diamond patterns offer better returns when used for long-term trading, meaning they are particularly good for crypto traders. Additionally, they are considered low risk trading patterns. This is because if a trader misses the breakout point, instead of entering at a point equal or similar in value to the diamond’s highest high or lowest low, then it is not problematic since it is after this point that the trend should truly gain momentum.
The combination of low risk and high reward make the diamond pattern a favorite among long-term traders, and despite its rarity, when it does appear its slightly uneven shape can make it easy to spot.