


Summary
- There are two key concepts behind the Ease of Movement indicator: volume and resistance.
- Volume is a calculation that represents the total amount of Bitcoin bought and sold on the market.
- Resistance is when Bitcoin moves up and there’s an inclination to sell at a certain price point.
- Ease of Movement is an indicator that measures when Bitcoin is moving up or down without resistance – effectively tracking the “easiness” of the price movement.
- The indicator oscillates through positive and negative territory with a baseline of zero.
- Bitcoin could move up with relative ease, however, it needs volume to sustain the price surge. The price of Bitcoin could go up without a lot of volume, but eventually it will stagnate and diverge from its trajectory.
- If the volume is increasing with the price, the ease of movement reaches the upper threshold and this signals a bull run. Conversely, if Bitcoin goes down with ease, this signals a bear market.
- The EOM indicator can help filter market noise. If the indicator is not moving as fast as the price, this means the rally can be grinded to a halt early.
- The indicator is available on all Phemex spot market and futures trading pairs.

What is Ease of Movement Indicator?
Ease of Movement (EMV) is a quantitative indicator that measures the relation between price and volume. The EMV indicator measures the “ease” of price movement and indicates if the price is trending upwards or downwards with ease, or meeting resistance. It can be used on long-term (1M, 1W, 1D) or short-term (4H, 1H, 15M) charts.
If the price of Bitcoin (BTC) is trending upwards with ease, it signals an extended rally. If it’s met with resistance, it’s likely to see a divergence. The indicator measures volume and compares it to historic values to measure the ease. It’s useful as a complimentary indicator to confirm trend patterns prior to opening long or short trades.
The indicator has a baseline value of zero and oscillates into positive and negative territory. If the indicator is in positive territory, it means the price is trending upwards. If the oscillator reaches thresholds limits to the upside, this signifies an ease of movement in one direction. The EMV indicator has historically trended on the upper thresholds when Bitcoin was in a bull run.

What Is Volume In Crypto?
Volume is a measurement unit that represents the total value of Bitcoin bought and sold on the market. If there’s more volume, that means more people are trading Bitcoin. The volume indicator below the candles can help us determine if the market is active. The following is a preview of volume for the Bitcoin chart on Phemex:

Volume can increase when the price of Bitcoin is appreciating and traders are buying. Volume can also spike if people are panic-selling Bitcoin and the price is going down. The volume is often correlated with price.
If we can track how the market is behaving, we can place trades accordingly. In some cases, the price can go up without the volume to match. The Ease of Movement indicator tells if the trade volume is backing up the price surge.
When the volume matches the price increase, we can expect a longer rally. Historically, Bitcoin has rallied for months at a time and made new all-time highs. This is when the price was moving with ease. If the price is moving with resistance, it’s riskier to invest money because it could reverse to the downside.
Ease of Movement Definition
The Ease of Movement indicator (or EMV indicator) is an oscillating trend indicator that measures the relation between price and volume. The oscillator moves in positive and negative territory based on the volume-to-price ratio. If the EMV is in positive territory, this indicates that Bitcoin is in an upward trend. Conversely, if it’s in negative territory this means that Bitcoin is in a bearish trend.
If the oscillator on the indicator is moving towards the upper thresholds, this indicates a powerful trend that could last for weeks or months at a time. This presents the best opportunity for traders using leverage for futures. Bitcoin can also be in a downtrend during a bear market, presenting a short opportunity for traders that could last multiple months.
If the oscillator is trending near the zero mean value, this means we’re in a sideways/choppy market and there’s no clear direction. Traders are advised to avoid risky trades during sideways markets because the price could go in either direction.

Who Invented The EMV Technical Indicator?
The Ease of Movement technical indicator was invented by Richard W. Arms, an American mathematician and best-selling author. He invented the EMV indicator and released it in Barron’s Magazine in the 1960s. The indicator was first used in the stock market and was later adopted for the crypto markets.
Richard W. Arms is also the inventor behind the ARMS Index (TRIN) indicator. He based his trading strategies on market psychology and trends. According to him, the way to determine if a trend is going to continue is to match it to the volume which accounts for the market behavior.
Ease of Movement Formula
The Ease of Movement indicator formula is a quantitative formula based on three main data points:
- high/low price range,
- volume, and
- distance.
The distance and the price range measure the trend momentum and the volume measures the market psychology. The following is the official EMV formula:

The Ease of Movement formula takes the daily average price of Bitcoin, subtracts it from the previous average, and then divides the result by the daily volume. This outputs an accurate representation of the ease of movement of Bitcoin or any crypto over a certain period.
Simply put, if the price moves easily, we can effectively trade in one direction for the duration of trend. The price can also diverge to the downside, making it safer to short Bitcoin for a certain period.
How To Use The Ease of Movement Indicator?
Let’s use Phemex platform for this demonstration. The Ease of Movement indicator is available on Phemex for more than 100+ spot market and futures trading pairs. To get started, select your favorite trading pair such as BTC/USDT:
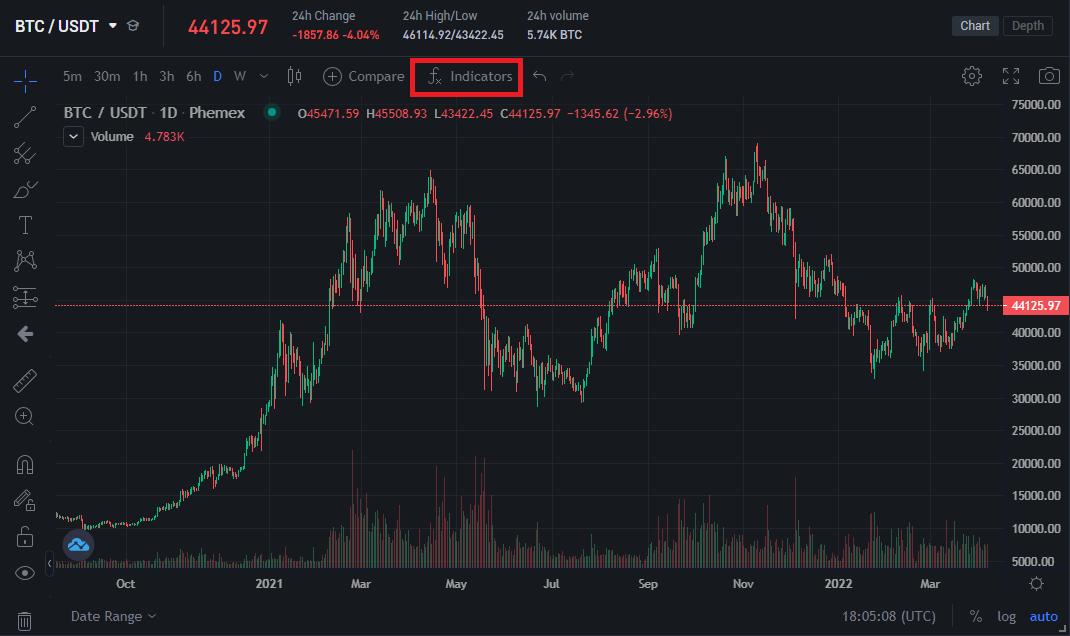
Press on “Indicators” (highlighted above) and search for “Ease of Movement”:

The indicator will now be loaded below the Bitcoin chart and we can get a better understanding of how it works for signaling trend strength:

We are using the daily (D) chart to compare Bitcoin’s price movement over the past two years. We can see that the indicator peaked on the upper threshold at the start of 2021 when Bitcoin was on a bull run and went up from $10,000 to $60,000. This is when the price was moving easily without resistance.
For context, it’s recommended to use the EMV indicator with the Volume indicator. Search for “Volume” using the same search bar above and the two indicators will load simultaneously:

We can see that the volume peaked during the May 2021 crypto crash when the EMV indicator went into negative territory. Bitcoin was moving relatively with ease to the downside for nearly a month. The oscillator has moved above and below the mean value, indicating new trading opportunities over the last two years.
If we open a long trade when the EMV indicator is trending near the zero line, we don’t have any guarantees the price will go up – it could go in any direction. Conversely, if the EMV indicator is trending above the zero line towards the upper thresholds, we can feel safer opening a long trade and making a profit.
How To Trade With The EMV Indicator?
A proven Ease of Movement indicator strategy is to use it as a confirmation tool for market timing. There are times when a trader can struggle to make profits because the price is moving sideways without a clear trend direction. A trader can wait for a time when the price is moving with ease – in both the upper and lower direction.
The EMV indicator can also be used to filter out market noise. For example, Bitcoin broke out of a sideways trend in April 2022 and the price rose from $37,000 to $48,000. However, the line on the EMV indicator did not start trending towards the upper thresholds, indicating that the rally is losing steam:

Despite the 30% price surge, the indicator did not signal an ease of movement. This is because the price was meeting resistance and the volume didn’t increase significantly. The EMV indicator tells us when we should avoid trading as much as it tells us when we should trade.
What Are Downsides To The EMV Indicator?
The main downside is that the EMV indicator is not suitable for short-term trading. The indicator derives data from daily highs and lows, making it difficult to predict trends on short-term charts such as hourly or minute charts. For example, if we switch to the hourly chart we can analyze how it could send false signals:

On the hourly chart, we can see that the indicator peaked on the upper threshold multiple times but the trend did not continue and lost steam. The formula for the indicator requires long-term data to provide accurate signals for strong trends.

Conclusion
The EMV indicator measures the relationship between the price action and volume of Bitcoin. The price moves with ease when the market is strongly bullish or bearish. The indicator can be used for confirming trade bias when the crypto market starts trending.
The EMV indicator is also a useful tool for market timing. If a trader wants to confirm whether Bitcoin is in a bull run/strong upward trend, they can apply the indicator and derive data for the present moment based on historic values. They could also use it as a confirmation tool for bear market conditions and short orders.
It’s recommended to use the EMV indicator with other indicators as it was not designed to be used in isolation. The volume indicator is a go-to complimentary indicator because it gives us context about volume peaks that set off a trend. To learn more about combing EMV with other indicators, read our technical analysis (TA) section.
Read More
- What Is Crypto Trading Volume: How It Affects Price
- On-Balance Volume Indicator (OBV): A Crypto Trading Strategy with OBV
- How to Trade Bitcoin with Volume Profile
- What Is Net Volume Index: Indicator Of Real Market Sentiment
- Understanding Trading Volume in Ranges and Trends
- What Is Volume Oscillator (VO) in Crypto Trading?
- What Is Momentum Trading? Profiting from Market Volatility
- Exponential Moving Average (EMA): The Most Important Moving Average Indicator