
In the world of trading, great money movements are usually caused by the actions of large enterprises, or whales, as opposed to small traders and investors. If a trader can identify where the whales are going to direct the money to next, then they can make huge returns. This is why market indicators are so valuable for a trader’s technical analysis. These indicators can show the momentum behind a trend, whether the trend will be bullish or bearish, and whether there is likely to be a reversal, among other things. There are many indicators that a trader can choose from but one man who has contributed some of the most important is Marc Chaikin, the creator of the Chaikin indicators such as Chaikin Money Flow, Chaikin Oscillator and Chaikin Volatility. This article will update and expand on these indicators. By understanding CMF and CV, you can add volume-weighted insight and volatility analysis to your trading toolkit, gaining a better read on when “smart money” might be accumulating coins or when volatility is about to surge.
What Is the Chaikin Money Flow?
How to Calculate the Chaikin Money Flow Indicator?
To calculate the Chaikin Money Flow Indicator, Chaikin compared two key components of an asset’s value (price and volume) over a period of 20-21 days (a month’s worth of trading days). It should be noted that for day traders this period is reduced to 20-21 bars, instead of days.
-
Price: This refers to the price of an asset at the close of the trading day.
-
Volume: This refers to the amount an asset has been traded during a trading day.
To turn this information into something resembling an indicator, Chaikin used it to calculate the stock’s volume-weighted closing performance over that 20/21-day period (for the purpose of simplicity, we will use 21 days in this article). This he achieved in the following way:
-
Money Flow Multiplier (MFM):Based on the closing high-low range of the asset’s price each day. Equation = [(Close – Low) – (High – Close)] / (High – Low)
-
Money Flow Volume (MFV):Multiplying the MFM by the asset’s trading volume each day. Equation = Money Flow Multiplier * Volume for the Period
-
21-period CMF: Sum together the MFV for a 21-day period and then divide it by the sum of the volume for the same period. Equation = 21-period Sum of Money Flow Volume / 21 period Sum of Volume
With the final formula appearing as follows:
((((Close – Low) – (High – Close)) / (High – Low)) * Volume) / Total (Volume, 21)
The resulting values, which represent a volume-weighted average of the asset’s buying power vs selling power, show a continuously oscillating pattern, ranging from +100 to -100 and continuously crossing the 0-line. This oscillating line is known as the Chaikin Money Flow indicator.
How to Read Chaikin Money Flow Indicator
As with most indicators, the CMF indicator has a 0-line, which is used as the point where an asset’s value is considered to pass between strength and weakness in the market. The principle behind the CMF is simple.
First:
-
The further above the 0-line the asset’s value is at the end of the trading day, the more buying power, or accumulation, it has had.
-
The further below the 0-line the asset’s value is, the more selling power, or distribution, it has had.
So,
-
If the asset’s value consistently remains above the 0-line at the end of each trading day, then the asset’s average ratio of buying power to selling power, or CMF, will be positive, indicating that the asset is strong in the market (bullish).
-
If the asset’s value consistently remains below the 0-line at the end of each trading day, then the asset’s average ratio of buying power to selling power, or CMF, will be negative, indicating that the asset is weak in the market (bearish).
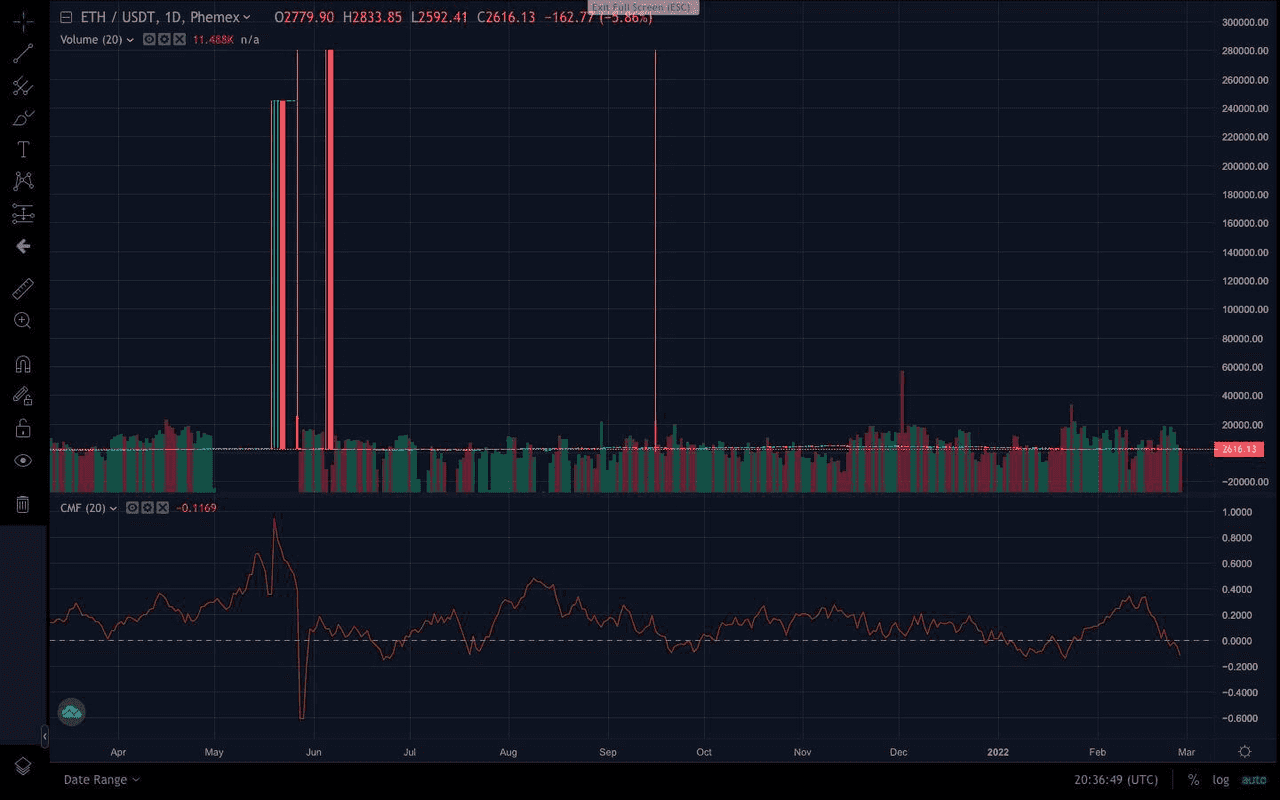
A representation of a Chaikin Money Flow indicator (red). (Source: Phemex.com)
Above the 0-line on a CMF indicator is considered to be a green region, indicating buying pressure (meaning bullish behavior), while below the 0-line is considered to be a red region, indicating selling pressure (meaning bearish behavior).
These clear colors make it easy to spot a few indications.
Chaikin Money Flow Persistency Indicator
Chaikin Money Flow Divergence Indicator
Generally, the CMF will follow the direction of an asset’s price chart — going up when it rises and going down as it decreases. However, when the price is seen as rising in the asset’s price chart but the money flow remains negative in the CMF indicator, or vice versa, this indicates a divergence. A divergence can be:
-
Positive/bullish:The value moves to a new low but CMF holds above its prior low to form a higher low.
-
Negative/bearish:The value moves to a new high but CMF fails to record a new high and forms a lower high.
The divergence indicator is important as it can warn of a trend being about to turn. In particular negative/bearish divergences can be indicative of an increased risk of a short-term reversal in the asset’s value.
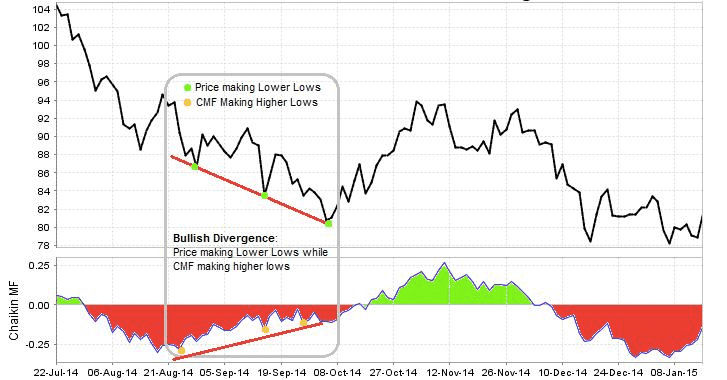
An example of a bullish divergence, as shown using the CMF indicator and a price chart. (Source: topstockresearch.com)
What Is the Chaikin Oscillator Indicator?
There are many other indicators that stem from Chaikin’s CMF. One that is often used, is known as the Chaikin Oscillator (CO) indicator.
The CO indicator is used to measure the momentum behind the accumulation distribution of an asset, meaning that it can give an indication of upcoming trends and help predict their strength. The CO indicator is in fact an indicator of an indicator, being that it is the difference between a 3-day exponential moving average (EMA) of the asset’s ADL and a 10-day EMA of the asset’s ADL. For clarity, an EMA is a moving average (MA), this being a calculation of the average price that an asset is moving at, with more weight assigned to more recent prices.
How to Calculate and Read the Chaikin Oscillator Indicator
The calculation of a Chaikin Oscillator follows a similar path the CMF indicator, with some added steps. It is calculated as follows:
-
MFM equation = [(Close – Low) – (High – Close)] / (High – Low)
-
MFV equation = Money Flow Multiplier * Volume for the Period
-
ADL equation = Previous ADL + Current Period’s Money Flow Volume
-
CO equation = (3-day EMA of ADL) – (10-day EMA of ADL)
The Chaikin oscillator indicator is represented by a solid line that oscillates between the highs and lows of the asset, passing over the 0-line in accordance with the asset’s momentum.
A representation of a Chaikin oscillator indicator (blue). (Source: Phemex.com)
Chaikin Money Flow vs Chaikin Oscillator
The Chaikin Money Flow (CMF) and Chaikin Oscillator (CO) are often confused, but in fact when looking at the Chaikin money flow vs Chaikin oscillator indicators, we can establish a clear difference:
-
Chaikin money flow indicator measures the amount of money flow volume (the amount the asset is being traded) over a specific period, as well as in which direction it is moving (negative or positive).
-
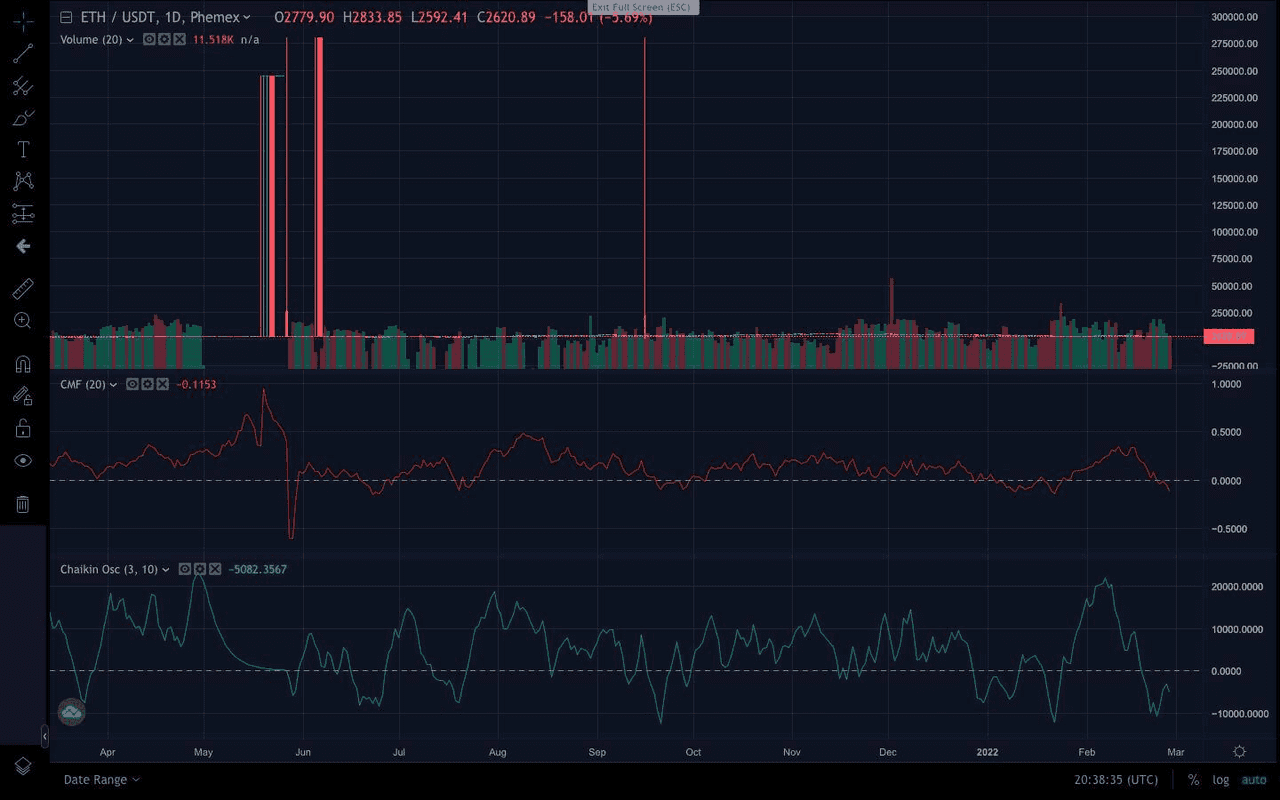
Chaikin oscillator measures the momentum behind the accumulation distribution of the asset. Additionally, as the momentum often represents trends (with increased buying indicating bullish behavior and increased selling indicating bearish behavior), it is a great indicator of changing trends. Due to its use of EMAs, the CO is also considered faster at picking up reversals than the CMF, as demonstrated by the below chart on Ethereum (ETH) price movements.

CO vs CMF. Notice how the CO traverses the 0-line before the CMF does. (Source: earn2trade.com)
How To Use the Chaikin Money Flow Indicator
The Chaikin Money Flow indicator is a tool found on many market analysis platforms, such as on Phemex’s partner TradingView. To use the CMF then, a trader will first go to one of these platforms, find the asset they want to analyze, and then add the CMF indicator. Once this is done, the trader will analyze the asset’s value using the indicator and come up with a Chaikin money flow indicator strategy to increase chances of profitability.
Regardless of the strategy, however, a trader should never solely rely on one indicator, whether the CMF or not. It is important to always use additional indicators to verify and confirm one’s analysis before deciding on whether to go short or long, as well as how much to invest or sell.
Some indicators that are similar include:
-
On Balance Volume (OBV) indicator: This indicator is the sum of an asset’s volume from a specific starting date — if the closing price of the asset on the day has increased from the previous day, it will be added, if it is reduced from the previous day, it will be deducted. The OBV usually follows the price of the asset and thus when a divergence appears, whether negative or positive, it is a sign for the trader to act. This indicator is therefore helpful to use in addition to Chaikin’s indicators. When comparing Chaikin money flow vs on balance volume, the main difference is that OBV measures based on the closing price difference from one day to another, while CMF measures based on the value of the closing price of each day.
-
Money flow index (MFI): The MFI also uses volume and price data to create an oscillating indicator that shows how much an asset is being overbought or oversold. When looking at money flow index vs Chaikin money flow, however, we can see that unlike the CMF, the MFI fluctuates between 0 and 100. To read the MFI, a trader will generally note that anything over 80 will be considered overbought, while anything below 20 will be oversold. Just as with the CMF and the OBV, a divergence between the MFI and the price chart of an asset is indicative of an upcoming change in trend. For example, if the MFI rises while the price remains flat or begins to decrease, this could indicate that the price may begin to rise.
What is Chaikin Volatility?
The Chaikin Volatility (CV) indicator is used in technical analysis to measure volatility — hence the name. This is done by using the rate of change (ROC) formula to compare the spread of the high and low pricing across an asset’s value. To have a better idea of the CV indicator, one can think of the Average True Range (AVT), with the difference that it ignores the asset’s previous close price.
Volatility is a great indicator of the market, with higher volatility suggesting unease from investors and lower volatility being an indicator of calm in the market. This can help influence a person’s investing decisions and is thus important to consider alongside other indicators during technical analysis.
How to Calculate the Chaikin Volatility Indicator?
The Chaikin Volatility indicator is calculated in the following way:
-
First, the high-low range is calculated for the selected period of bars: HL = Highest High – Lowest Low
-
Second, the exponential moving average (EMA) is applied to the previously calculated high-low range. HLema = EMA (HL, n) where n is the bar period setting of the EMA, which is usually the same period as used in step 1.
-
Finally, the CV is calculated using the ROC formula: CV = (HLema / HLemaPrev – 1) * 100 where HLemaPrev is HLema value M bars ago (as is used for the ROC indicator).

Chaikin Money Flow Movements (source)
Using CMF and CV Together in Crypto Strategies
Chaikin Money Flow (CMF) and Chaikin Volatility (CV) can effectively complement each other. Here are some combined insights:
Confirming Breakouts: For a strong breakout, look for price breaking key levels, a CV spike (indicating volatility confirms a regime change), and a positive or surging CMF (showing strong volume support). If volatility spikes but CMF remains flat or negative, it may indicate a false breakout. Conversely, if CMF is positive with little volatility, the move may lack momentum.
Spotting Weak Rallies or Drops: In an uptrend, if rising prices coincide with declining CV and CMF, it suggests a weakening trend and potential reversal. Conversely, in a downtrend, a spike in CV with a deeply negative CMF may indicate capitulation. If CV falls and CMF improves afterward, it could signal a bottom.
Comparing Cryptos: You can compare different assets using these indicators. For instance, look for altcoins with strong CMF inflows and low CV. A watchlist of coins showing high CMF and low CV can be beneficial, as they may explode upward when volatility returns.
Example Scenario: Imagine in 2025, Token A has a steadily climbing CMF while Token B's CMF is flat or negative, with both having low volatility. A trader might conclude Token A is quietly accumulating, predicting a bullish breakout when volatility increases, while Token B may drift or decline, suggesting caution.
Tips for Beginner to Intermediate Users
Adding Chaikin Money Flow (CMF) and Chaikin Volatility (CV) to your charts is easy on platforms like TradingView. Here are some concise tips:
-
Start with Standard Settings: Use default settings (CMF: 20 or 21-day; CV: 10-day EMA and ROC) to understand their behaviors before making tweaks.
-
Use Multiple Timeframes: Daily charts help identify trends, while shorter timeframes (like 4-hour or 1-hour) can refine entry points. For example, if the daily trend is up, but the 1-hour CMF shows a dip, it might indicate a consolidation. Timing entry when indicators turn positive can be beneficial.
-
Watch for Extreme Values: High (above 0.5) or low (below -0.5) CMF and CV can signal trend climaxes or reversals. At these extremes, consider locking in profits as corrections may follow.
-
Analyze Historical Events: Review past major market events to see how CMF and CV performed. This will enhance your understanding of their behavior during different market conditions.
-
Combine with Fundamentals: News can significantly impact volume and volatility. Be cautious of sudden spikes due to isolated events and analyze whether trends persist beyond initial reactions.
In summary, CMF and CV can enhance your analysis of market participation and volatility. By observing their signals alongside price action and managing risk, you can gain an edge in trading. Happy analyzing!
Conclusion
Chaikin’s indicators, including the Chaikin money flow, can be used in crypto as well as for securities trading, since the benefits from this market analysis tool remain the same. The CMF, CO, OBV, MFI, and other indicators are all fantastic tools to help a trader understand whether a price movement is likely to be sustained, how strong the momentum will be, and in which direction the buying/selling pressure is going. However, no matter the strategy employed, a trader should always back up and verify their findings through the use of multiple indicators. A trader may therefore want to use the valuable Chaikin indicators in combination with such technical indicators as moving averages (MAs), the parabolic SAR, Average directional index (ADX), relative strength indicator (RSI), stochastic oscillator, and other price analysis technical indicators and tools.