

Key Takeaways
The ABCD pattern is a four-point harmonic price structure built around two directional legs and one retracement.
Its core visual idea is that AB and CD are related moves, while BC is the pullback in between.
Traders use the pattern in both bullish and bearish form, depending on whether the market is setting up for a move higher or lower.
Fibonacci retracement and extension levels are commonly used to validate whether the structure is clean enough to trade.
The ABCD pattern works best as part of a broader process that includes trend-following, momentum confirmation, and risk management.
Chart patterns come and go in popularity, but some remain useful because they are simple, repeatable, and easy to build into a rules-based trading plan. The ABCD pattern is one of those classics. It is often one of the first harmonic trading patterns traders learn because it is visually clean, logically structured, and flexible enough to use in both trend-following and reversal setups.
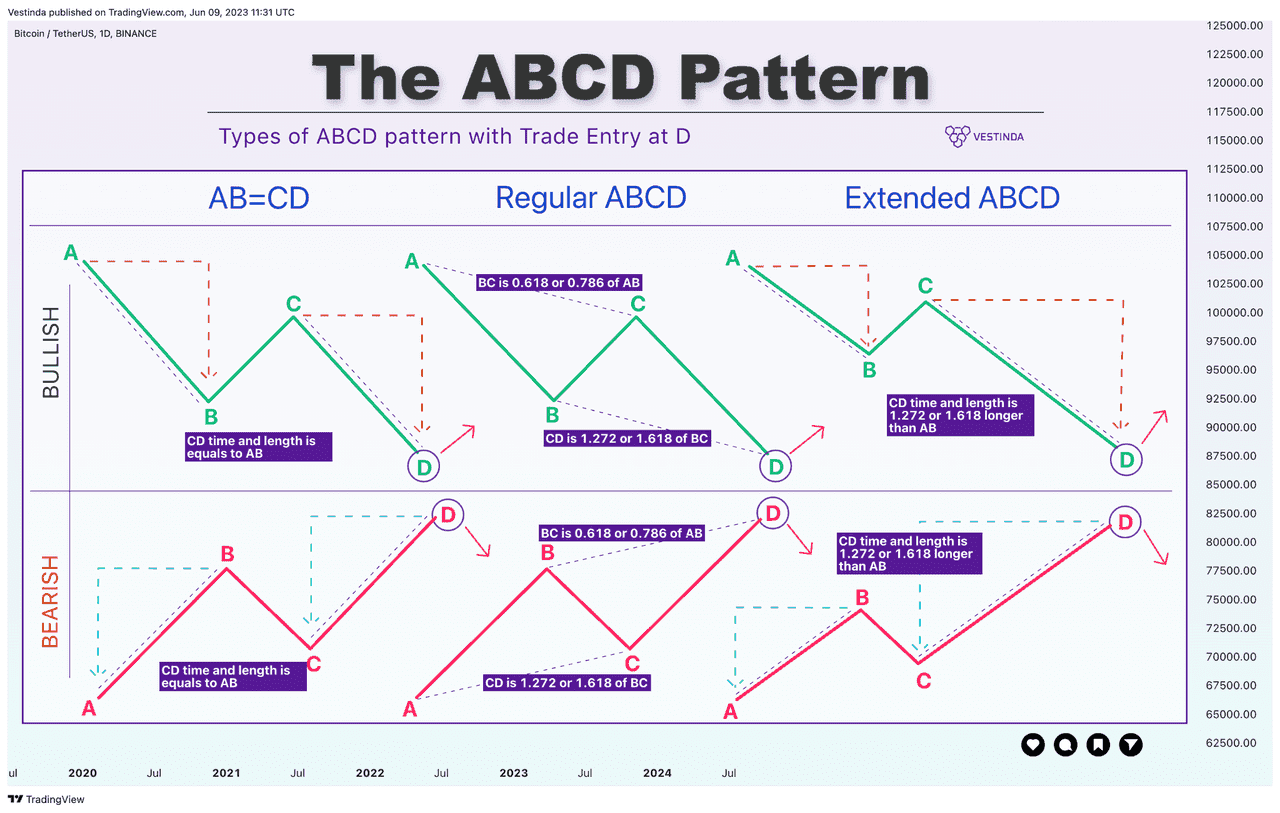
At its core, the ABCD pattern is a measured-price structure built around four turning points: A, B, C, and D. The defining idea is that the first impulse leg and the second impulse leg are related, while the move in between is a retracement. In the simplest version, the A-to-B leg and the C-to-D leg are roughly equal in price distance, while the B-to-C leg retraces part of the first move. Phemex’s earlier explanation emphasizes this “AB ≈ CD” relationship, while platform documentation from thinkorswim frames ABCD as a Fibonacci pattern that combines extension and retracement logic.
In crypto trading, that matters because markets often move in waves rather than straight lines. Price pushes, pulls back, then pushes again. The ABCD pattern gives traders a structure for evaluating whether that second push is likely to continue toward a defined completion zone or reverse from it. Used properly, it can help with entries, targets, invalidation levels, and risk-reward planning. Used poorly, it can become just another way to force shapes onto a noisy chart. That is why, in 2026, the best way to think about the ABCD pattern is not as a magic signal but as a disciplined trade framework.
What Is the ABCD Pattern?
The ABCD pattern is a four-point chart formation used in technical analysis to identify a probable price move from C to D after an initial move from A to B and a retracement from B to C. In plain English, the market makes one directional swing, pauses or pulls back, and then makes another directional swing. The pattern is considered “complete” when price reaches the projected D area. That projected D zone is where traders usually make their main decision: enter, take profit, or watch for reversal confirmation.
The ABCD is often grouped under harmonic trading because many traders validate it with Fibonacci relationships. Thinkorswim’s reference describes it as a Fibonacci pattern defined by four points, with a B-to-C move around 61.8% of BA and a BA-to-CD relationship of about 61.8% in its default logic. More general educational references, including FXCM and Phemex, present a broader trading view in which the BC retracement often lands near common Fibonacci levels such as 38.2%, 50%, or 61.8%, while the CD leg can be projected using extensions.
That flexibility is one reason the pattern remains popular. Traders do not all use the exact same ratio rules, but most agree on the same structural logic:
A clear first move
A meaningful retracement
A second move that is measured relative to the first.
Why the ABCD Pattern Still Matters in 2026
Crypto markets in 2026 are faster, more crowded, and more tool-driven than they were a few years ago. Traders have more scanners, more indicators, and more auto-detection overlays than ever. That has made it easier to find patterns, but harder to know which ones actually deserve attention. The ABCD pattern still matters because it forces traders to focus on market structure, not just on noise. It asks a useful question: if this market already made one meaningful swing, how likely is it to make a second measured swing before exhausting itself?
It also matters because the pattern can fit multiple trading styles. A short-term trader may use it on intraday BTC or ETH charts. A swing trader may use it on four-hour or daily charts to map entries and targets. A more advanced harmonic trader may use it as the building block for more complex XABCD structures.
The Four Points: A, B, C, and D
To understand the ABCD pattern, it helps to break down each point.
Point A is the starting swing point. In a bullish setup, it is usually a local low. In a bearish setup, it is usually a local high. Point B is the end of the first directional move. Point C is the retracement after that move. Point D is the projected completion point of the second directional leg.
The structure is simple, but the quality of the pattern depends on clarity. A clean A-to-B impulse followed by an orderly B-to-C pullback is far more useful than a messy zig-zag full of overlapping candles and random wicks. This is one reason ABCD setups tend to work better in directional markets than in flat, low-volume chop. FXCM explicitly notes that the pattern functions best in trending conditions, while the newer Phemex harmonic guide recommends combining harmonic logic with trend context and volume behavior.
ABCD Pattern (source)
Bullish ABCD Pattern
A bullish ABCD pattern typically forms after price has been declining or has just completed a downward swing. In this version:
A to B is a decline,
B to C is a rebound,
C to D is another decline into the projected completion zone,
and D is where traders look for a possible upside reaction.
The trading logic is straightforward. If the market has completed a measured downside move into a predefined zone, and if that area aligns with Fibonacci projections and other support signals, then the trader watches for confirmation that sellers are losing control. Depending on the strategy, that confirmation may be a bullish reversal candle, RSI stabilization, reclaim of an intraday level, or a break in short-term structure. FXCM notes that bullish reversal methodology often enters after completion of the C-to-D leg, while broader harmonic practice treats D as a zone to evaluate, not a blind buy button.
In crypto, bullish ABCD setups are commonly watched after sharp selloffs that begin to look stretched. If BTC, ETH, or a large-cap altcoin makes a controlled second leg down into a known support region, traders may use the ABCD completion area to map a bounce or reversal attempt.
Bearish ABCD Pattern
A bearish ABCD pattern is the mirror image. In this version:
A to B is an upward move,
B to C is a pullback,
C to D is another upward move into the projected completion area,
and D is where traders look for downside reaction or reversal signs.
This setup is especially useful in overheated rallies. Markets rarely move up forever in a straight line. A strong push, a pause, and then a second push often create exactly the kind of measured structure ABCD traders want to see. If that second move reaches a projected completion zone while momentum weakens or volume stalls, the D area may become a logical place to plan a short, a hedge, or a take-profit decision.
Again, the key idea is not prediction with certainty. It is identifying a zone where risk can be defined clearly. That makes bearish ABCD setups useful even for traders who do not want to short aggressively. A spot trader may simply use the pattern to avoid chasing a late rally.
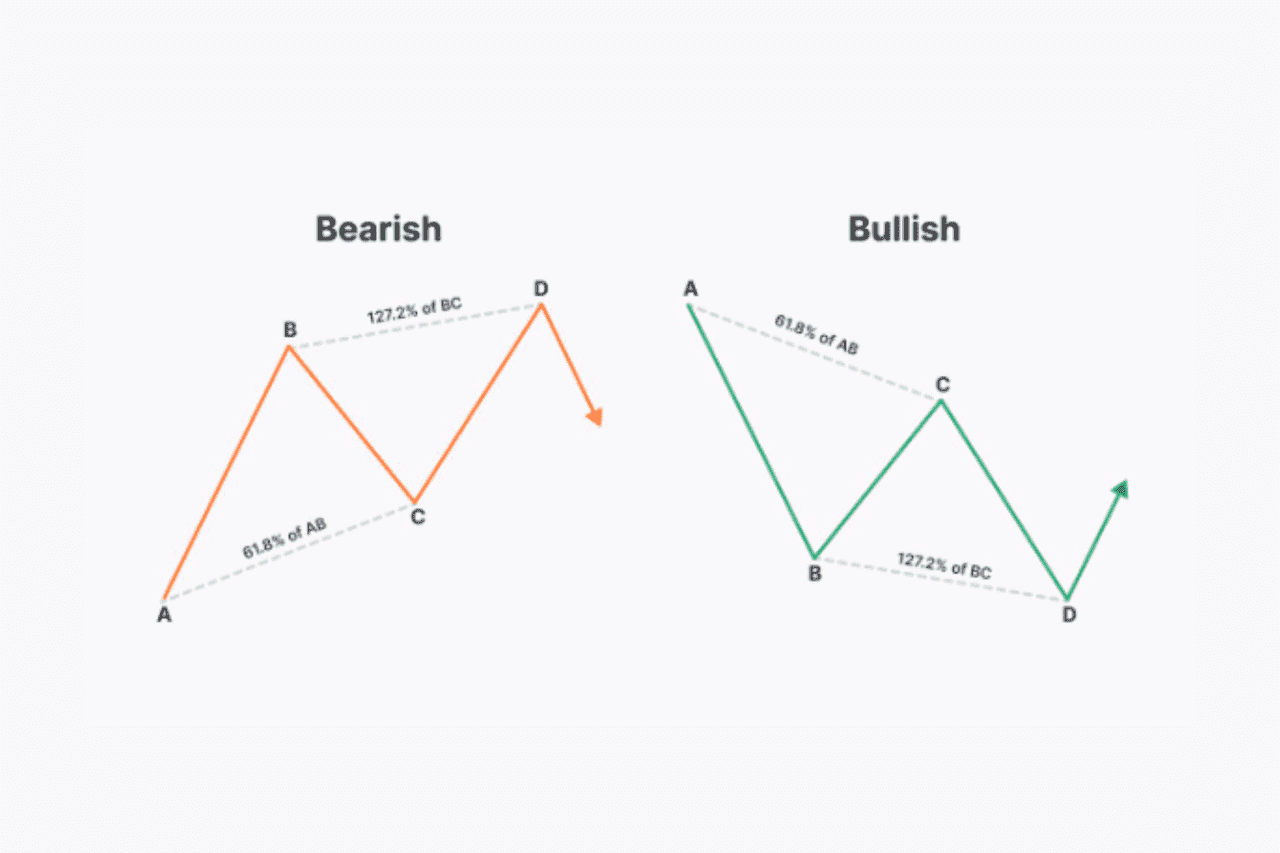
Bullish vs Bearish ABCD (source)
Fibonacci Ratios and Why Traders Use Them
The ABCD pattern is simple enough to see with the naked eye, but Fibonacci tools help traders decide whether the structure is statistically cleaner and therefore more tradable. The most common Fibonacci relationships referenced in ABCD education are:
BC retracing AB by roughly 38.2%, 50.0%, or 61.8%
CD projecting from BC with common extension levels such as 127.2% or 161.8%
or AB and CD being approximately equal in length.
Thinkorswim’s reference uses a stricter default description built around 61.8% relationships, but broader educational material accepts a small family of valid retracement and extension combinations. That is important in real-world trading because crypto markets rarely print textbook-perfect geometry. The goal is not to demand exact mathematical symmetry down to the last tick. The goal is to identify a measured structure where multiple Fibonacci relationships cluster near a common zone. That cluster is often what harmonic traders call the Potential Reversal Zone, or PRZ.
How To Draw the ABCD Pattern
The ABCD pattern becomes easier to work with once traders identify clear highs and lows and then use Fibonacci tools to connect the legs. That is still the right basic process.
A simple workflow looks like this:
Find a strong directional move from A to B.
Measure the retracement from B to C using Fibonacci retracement tools.
Project the likely D zone using either AB=CD symmetry or Fibonacci extension logic.
Check the market context around the projected D area.
Wait for confirmation before entering.
The confirmation step matters. Harmonics should be combined with momentum, volume, and multi-timeframe alignment. That is especially important in crypto, where large wicks and round-the-clock volatility can cause a market to overshoot a textbook level before choosing a direction.
ABCD Pattern as a Reversal Strategy
Many traders use the ABCD primarily as a reversal setup. FXCM notes that reversals are often the favored application. In this approach, the trader is most interested in what happens at D. If price reaches D after a measured second leg and the market begins to stall or reject that area, the trader treats D as a possible inflection point.
For a bullish reversal ABCD, traders may look for:
bullish candle rejection,
a higher low on lower timeframes,
a reclaim of local resistance after D is tagged.
For a bearish reversal ABCD, traders may look for:
a failed breakout near D,
bearish engulfing or rejection candles,
momentum divergence,
loss of intraday support after completion.
This is usually the more conservative use of the pattern because it treats D as a place to look for reversal evidence rather than blindly fading every measured move.
ABCD Pattern as a Trend-Continuation Strategy
Not every trader uses the ABCD as a reversal pattern. Some use it as a continuation framework. FXCM describes this alternate usage clearly: in trend-following mode, traders use the pattern to buy pullbacks or sell rallies within an existing trend, with the BC retracement and CD continuation leg helping define the trade.
In a bullish trend, a trader may read:
AB as the first strong push higher,
BC as a healthy pullback,
CD as the continuation leg that resumes the uptrend.
In a bearish trend, the mirror logic applies. This variation can work well in strong crypto trends, especially when BTC or ETH establishes a dominant directional bias and traders want a structured way to re-enter after a pullback.
The important distinction is intent. In reversal mode, D is often where the trade begins. In continuation mode, some traders use the retracement and projection framework earlier in the pattern to structure a trend re-entry.
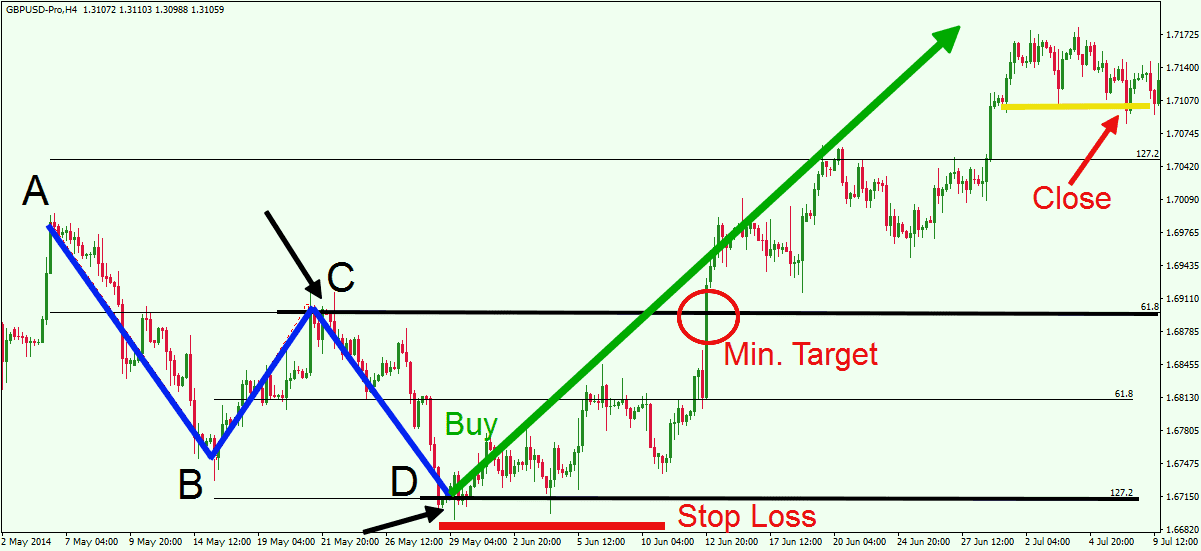
ABCD Pattern before reversal (source)
Common Mistakes When Trading the ABCD Pattern
The first mistake is forcing the pattern. If you have to squint, ignore major wicks, or invent awkward anchors, the setup probably is not worth trading. A good ABCD usually looks obvious in hindsight and fairly clear in real time.
The second mistake is treating D as automatic. A projected D zone is not a guaranteed turning point. Thinkorswim’s own reference warns that technical analysis should not be used as the sole means of investment research and that the pattern only suggests price is likely to find support or resistance there, not that it must.
The third mistake is ignoring broader context. The March 2026 Phemex harmonic guide recommends confirmation from RSI, MACD, OBV, and multi-timeframe analysis for a reason. A perfect-looking ABCD setup against a strong higher-timeframe trend can still fail.
The fourth mistake is poor risk management. FXCM notes that false signals are possible and that stop losses and profit targets should be aligned with the structure. That remains essential advice. Harmonic patterns are useful partly because they create logical invalidation levels. If a trader ignores those levels, the main advantage of the pattern is lost.
Risk Management for ABCD Traders
A practical ABCD trade plan usually includes entry criteria, invalidation level, first profit target, and position size based on the distance to the stop.
For example, a bullish reversal trader may wait for price to hit D, show confirmation, and then place a stop below the invalidation zone. Profit targets might include the C point, the midpoint of CD, or the B area depending on aggressiveness. A bearish setup uses the same logic in reverse.
This is also where exchange tools matter. Phemex’s help materials document take-profit, stop-loss, and trailing-stop functionality for traders who want more structured execution and trade management. Those tools are especially useful when trading chart-based setups like ABCD, where the edge often comes from consistent execution rather than raw prediction.
Conclusion
The ABCD pattern remains useful in 2026 because it turns messy price action into a structured decision process. It is simple enough for newer traders to understand, but still flexible enough for experienced traders to incorporate into sophisticated, rules-based setups. At its best, the pattern helps answer three important questions: where a measured move may complete, where a trader is wrong, and whether the potential reward justifies the risk.
That is why the ABCD pattern still belongs in the modern crypto trader’s toolkit. Not because it predicts every reversal perfectly, but because it creates a repeatable framework for planning trades with more discipline. Used with Fibonacci ratios, confirmation tools, and good execution habits, it can help traders approach volatile crypto markets with clearer structure and better risk control.
Want to apply chart patterns like the ABCD setup in real market conditions? On Phemex, traders can follow crypto price action across spot and derivatives markets, analyze chart structure, and use order-management tools such as take-profit, stop-loss, and trailing stops to build more disciplined strategies. Whether you trade reversals, continuations, or measured-move setups, Phemex offers a flexible environment to turn technical analysis into a more structured trading process.