
Key Takeaways
A bull trap is a false upside breakout, where price moves above resistance, attracts buyers, and then reverses sharply lower.
A bear trap is a false downside breakdown, where price falls below support, pulls in sellers or shorts, and then quickly rebounds.
Volume, RSI, and price confirmation are key tools for spotting whether a breakout is real or likely to fail.
Fast reclaims of broken levels are major warning signs that a move may be a trap rather than the start of a sustained trend.
Crypto traders are especially vulnerable to traps because 24/7 markets, thinner liquidity, and leverage can amplify fakeouts and liquidation cascades.
The best defense is patience and risk management—wait for confirmation, trade with the broader trend, and always use clear stop-loss rules.
Crypto traders love breakouts. A clean move above resistance can feel like the start of a major rally, while a sharp drop below support can look like the beginning of a fresh selloff. But markets do not always reward the obvious move. Sometimes a breakout fails, reverses hard, and traps traders who acted too quickly. That is where bull traps and bear traps come in. The current Phemex version of this article was last updated on July 16, 2021, so it benefits from a full refresh for today’s market.
In simple terms, a bull trap is a failed upside breakout that pulls buyers in before price reverses lower. A bear trap is a failed downside breakdown that pulls sellers or short traders in before price snaps back upward. Both are forms of a broader “false breakout” or “fakeout” pattern, where price briefly moves through a key level and then returns back into the prior range.
These patterns matter even more in crypto because the market trades 24/7, liquidity can thin out quickly, and leverage can amplify both breakouts and reversals. On March 13, 2026, Phemex news highlighted Bitcoin surging to around $73,000 amid a rally, while other reports warned that moves around the $70,000 to $73,000 zone could trigger large liquidation cascades on either side. That kind of environment is exactly where traders need to think about traps, not just trends.
What Is a Bull Trap?
A bull trap happens when price appears to break above resistance and signal the start of a bullish move, only to reverse lower soon after. Traders who bought the breakout get “trapped” in losing long positions as price falls back below the level they thought had been conquered. The older Phemex article already described this correctly, and the core idea still holds up today.
Bull traps often start with a strong-looking candle that closes above resistance or a local high. Momentum traders see the breakout, assume follow-through is coming, and pile in. But instead of building into a sustained trend, the market stalls, sellers step in, and price falls back into the old range. Once that happens, breakout buyers may rush to exit, which can accelerate the drop.
In crypto, bull traps are especially common near obvious chart levels that many traders are watching at once: previous daily highs, weekly resistance, round numbers, or the top of a consolidation range. The more crowded the setup, the more violent the reversal can be when the breakout fails.
What Is a Bear Trap?
A bear trap is the opposite pattern. Price breaks below support or a key swing low, traders assume a deeper drop is underway, and they either sell their holdings or open short positions. Then the market reverses higher, reclaiming the broken level and trapping the bears.
Bear traps are painful because they often trigger fear. Traders see support fail and assume momentum will keep cascading downward. But if the breakdown lacks real conviction, or if there is strong demand waiting below support, the move can reverse quickly. Short sellers then scramble to cover, which can fuel a sharp bounce.
In leveraged crypto markets, bear traps can become even more explosive when a quick rebound starts liquidating short positions. Phemex cited Coinglass data in February showing that if Bitcoin moved above $73,000, roughly $482 million in short liquidations could be triggered across major centralized exchanges. That is exactly the kind of positioning imbalance that can turn a simple rebound into a violent squeeze.
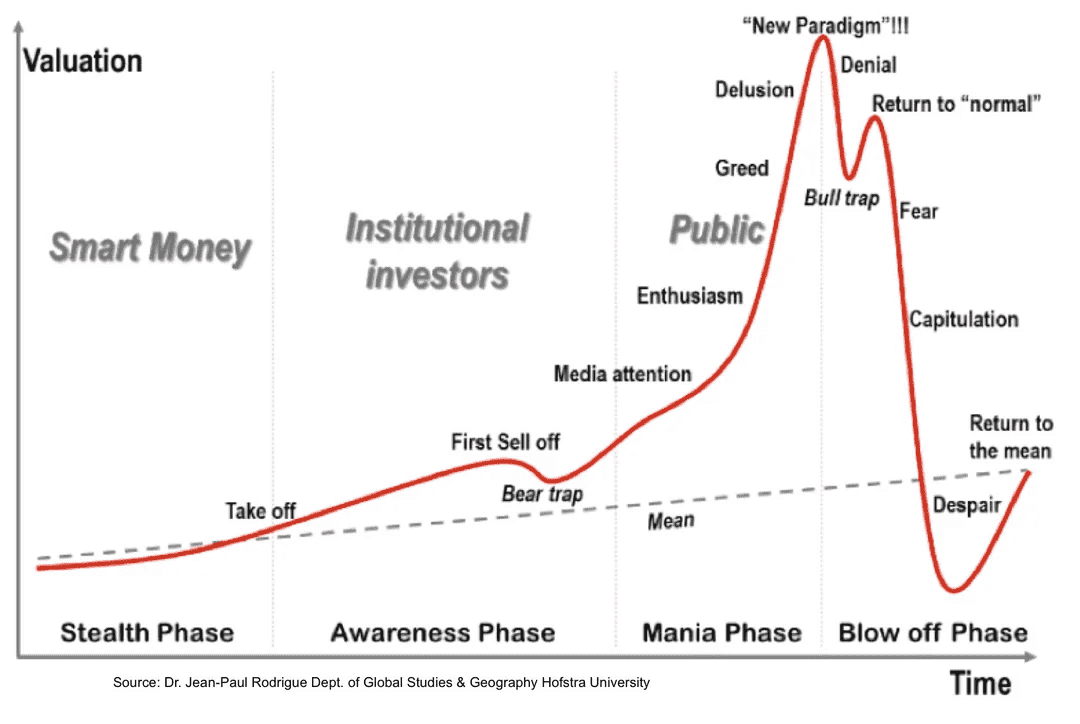
Market Psychology Phases
Why Bull and Bear Traps Happen
Bull and bear traps are not random. They usually form because market participants rush to act on a price level before the market has actually confirmed the move.
One reason is crowded breakout behavior. Many traders are taught to buy resistance breaks and short support breaks. When too many people act on the same level without waiting for confirmation, the market can overshoot briefly and then reverse.
Another reason is thin liquidity. In crypto, price can move through a level quickly when order books are light, especially outside peak trading hours. That move may look meaningful on the chart, but without sustained participation it can fail just as quickly.
A third reason is leveraged positioning. When too many traders are leaning one way, the market becomes vulnerable to liquidation-driven reversals. A failed breakdown can squeeze shorts. A failed breakout can flush longs. This is one reason why fakeouts are so common around highly watched BTC and ETH levels.
Finally, some traps form because traders treat one signal in isolation. A breakout alone is not enough. Without support from volume, momentum, and broader market context, the move may be little more than noise.
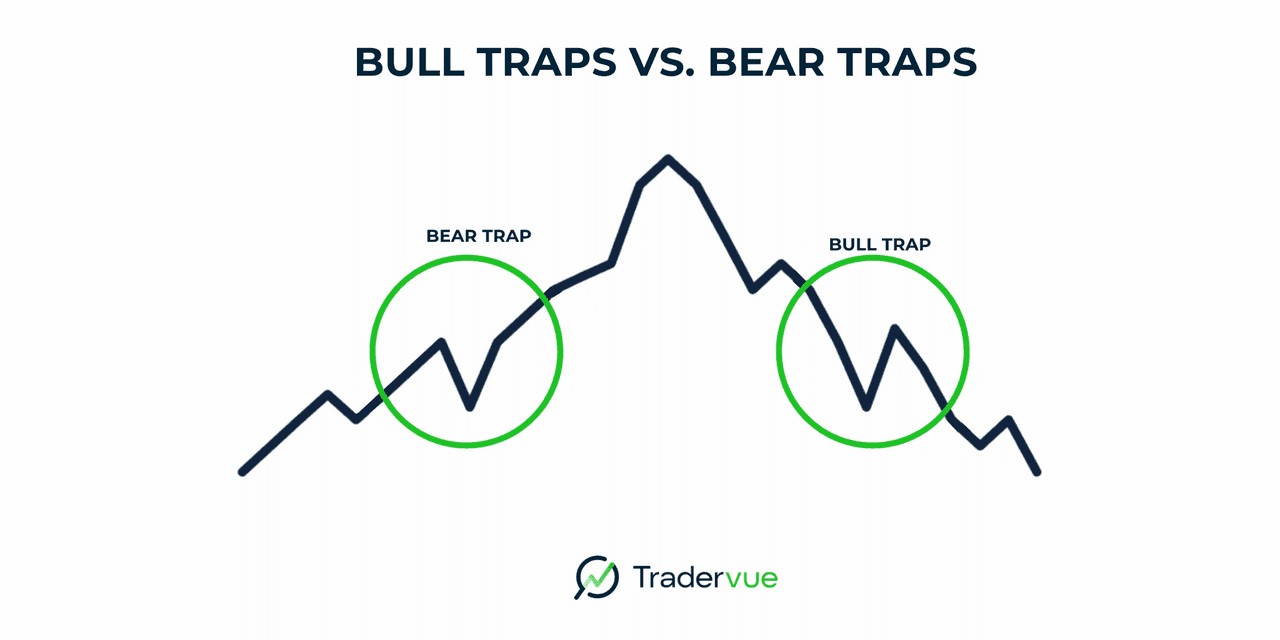
Bull Trap vs Bear Trap: The Core Difference
The simplest way to separate the two is this:
A bull trap fakes strength, then reverses down.
A bear trap fakes weakness, then reverses up.
Bull traps usually occur after price pushes above resistance, a trendline, or a recent high. Bear traps usually occur after price breaks below support, a recent low, or the bottom of a range. In both cases, the trap is the same underlying phenomenon: a false breakout that punishes traders who entered too early.
How to Spot a Bull Trap
No indicator can identify every trap in advance, but several warning signs can improve your odds.
The Breakout Lacks Volume
Low or unimpressive volume is one of the biggest red flags. The existing Phemex article notes that stronger price moves usually need higher-than-average volume, and that idea remains valid. If price breaks resistance but volume does not expand, the breakout may lack real conviction.
In practice, this means you should be skeptical of breakouts that look dramatic on the candle but do not attract meaningful follow-through. A true breakout usually brings commitment from buyers, not just a quick price spike.
RSI Is Overheated
The Relative Strength Index, or RSI, is still one of the most widely used momentum tools. Traditionally, readings above 70 suggest overbought conditions and readings below 30 suggest oversold conditions, though those thresholds are not universal. Investopedia and newer trading education pieces both stress that RSI works better when used with trend and price confirmation rather than by itself.
For a possible bull trap, an upside breakout accompanied by a stretched RSI can be a warning that momentum is already crowded. That does not guarantee reversal, but it does mean chasing the move becomes riskier.
Price Closes Back Below Resistance
One of the clearest signs of a bull trap is simple price behavior: the market breaks out, then quickly closes back below the level. This is often more meaningful than the initial breakout itself. If the market cannot hold the breakout area, buyers may not really be in control.
Many traders improve their process by waiting for a retest. Instead of buying the very first breakout candle, they wait to see whether the old resistance actually turns into support. If it does not, the odds of a trap go up.
Momentum Divergence Appears
If price is making a higher high but RSI or MACD is failing to confirm with a stronger momentum reading, that divergence can signal weakening conviction. Divergence is not a standalone sell signal, but it often helps identify fragile breakouts.
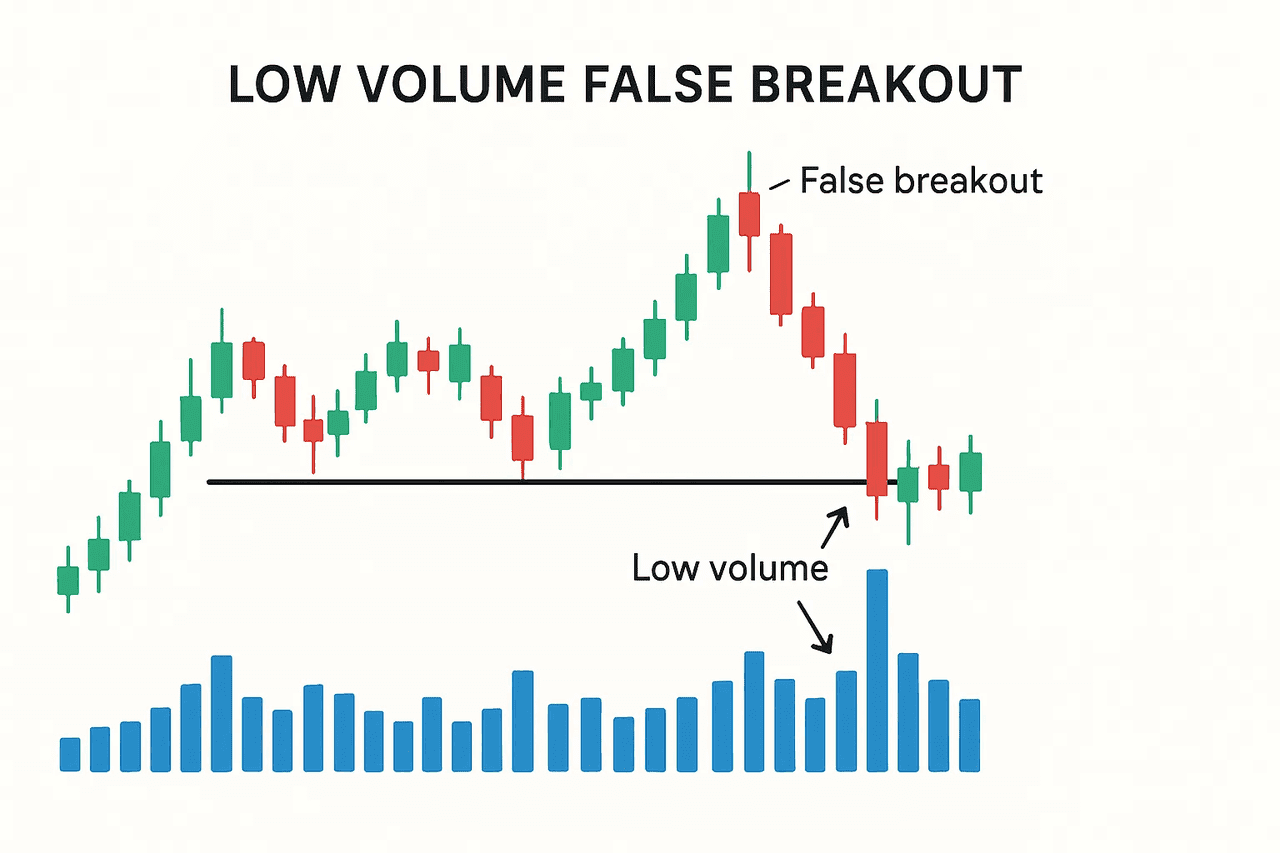
False Breakouts Sometimes Occur Due to Low Volume (source)
How to Spot a Bear Trap
The logic is the mirror image on the downside.
Breakdown Volume Is Weak
If price breaks support but the move happens on weak or only average volume, sellers may not have enough strength to sustain the decline. The market can dip under support, trigger panic selling or short entries, and then rebound sharply.
RSI Shows Oversold Conditions
An RSI below 30 can suggest oversold conditions, especially if price is dropping into a major support area. That does not mean price must bounce immediately, but it does warn against blindly assuming that every breakdown will extend.
In crypto, oversold markets can stay oversold for a while. That is why experienced traders look for confirmation, such as a reclaim of support, a bullish candle pattern, or improving volume, before betting on reversal.
Price Reclaims the Broken Level Fast
If the market breaks support and then quickly moves back above it, that is one of the strongest signs of a bear trap. The longer price stays back above the level, the more uncomfortable it becomes for late shorts.
Short Squeeze Conditions Build
When short interest is heavy, even a modest rebound can trigger forced covering. In crypto this can produce an outsized move, because liquidation mechanics can add fuel to the rally. The recent Phemex liquidation discussion around BTC above $73,000 is a good real-world reminder that positioning matters just as much as chart structure.
Indicators That Help Confirm or Reject a Trap
The 2021 Phemex article focused mostly on RSI, volume, and candlestick patterns. Those are still the right building blocks, but in 2026 the more important lesson is not which single indicator to use. It is how to stack confirmation.
A practical confirmation checklist looks like this:
Is the breakout or breakdown happening with strong volume?
Is RSI supportive, or already stretched?
Did price hold above resistance or below support, or did it snap back?
Are there clear candlestick confirmations or signs of indecision?
Is broader market sentiment aligned, or is this move happening against the higher-timeframe trend?
Candlestick patterns can help, but they should not be used alone. The older Phemex article correctly notes that indecisive candles like doji patterns can warn of tension between buyers and sellers. That is useful, but context matters more than memorizing pattern names.
How to Avoid Getting Trapped
The best defense against bull traps and bear traps is patience.
Wait for Confirmation
Do not assume the first move through a key level is real. Waiting for a candle close, a retest, or a second wave of follow-through can save you from many bad entries. You may miss the exact bottom or top of a move, but you will often improve your trade quality.
Trade With the Higher-Timeframe Trend
Fake breakouts are more dangerous when you trade against the dominant trend. An upside breakout inside a larger downtrend has a higher chance of failure than one aligned with a healthy higher-timeframe uptrend. The same logic applies in reverse for downside breaks.
Use Smaller Size on Early Entries
If you want to participate in a breakout before full confirmation, size down. Smaller initial exposure makes it easier to survive a failed move without emotional or financial damage. This is especially important in leveraged crypto products.
Respect Stop Losses
A trap only becomes catastrophic when risk is unmanaged. Phemex’s Help Center explains that traders can set Take Profit and Stop Loss orders on positions, and also use trailing stops in supported products to lock in gains or limit losses as price moves.
How to Trade a Bull Trap or Bear Trap
There are two basic ways to approach traps: defensive and offensive.
The defensive approach is to avoid entering until the market confirms the move. This is the safer method and the one most traders should prioritize.
The offensive approach is to trade the reversal itself. For example, if price breaks above resistance, fails, and falls back below that level, some traders will short the failed breakout. Likewise, if price breaks below support, fails, and reclaims it, some traders will buy the reclaim. This can be effective, but it requires discipline, fast execution, and clear invalidation rules.
For risk control, trailing stops can be useful once a trade starts moving in your favor. Phemex describes trailing stops as orders that track the market dynamically, adjusting the trigger as price moves, which can help protect gains without requiring a perfectly timed manual exit.
Conclusion
Bull traps and bear traps are not rare exceptions. They are a normal part of trading, especially in fast, leveraged, emotionally charged markets like crypto. A bull trap punishes breakout buyers. A bear trap punishes breakdown sellers. Both are just different versions of the same lesson: price crossing a level is not the same as price confirming a trend.
The good news is that you do not need to predict every trap in advance. You only need a process that makes you less vulnerable to them. Use volume, RSI, structure, and confirmation together. Be skeptical of obvious breakouts that have no follow-through. Respect positioning and liquidation risk in crypto. And always define your exit before entering the trade.
In a market where Bitcoin can be trading around the low-$70,000s one week and headlines are already debating whether the next move is real or just another fakeout, disciplined execution matters more than prediction. That is the real edge when trading bull traps and bear traps in 2026.
Want to put these trading concepts into action? On Phemex, traders can monitor live crypto markets, analyze price behavior around key support and resistance zones, and use risk-management tools such as Take Profit, Stop Loss, and trailing stop orders to trade with more discipline. Whether you are navigating breakouts, breakdowns, or volatile fakeouts, Phemex gives you the tools and market access to turn trading knowledge into a more structured strategy.