

Summary
-
The Three Black Crows is a bearish chart pattern that appears when bears overwhelm the bullish momentum for three trading sessions in a row.
-
The Three Black Crows pattern generally represents an incoming downtrend.
-
The Three Black Crows pattern is usually quite reliable, but it’s crucial to take factors like volume and trend momentum into account before making any trading decisions.
Simply put, the Three Black Crows is a bearish reversal pattern that signals the bulls’ momentum has been overtaken by strong selling pressure over three consecutive trading sessions. For intermediate investors and crypto-curious readers, understanding this pattern can add a powerful tool to your trading arsenal. By spotting Three Black Crows on a price chart, you can make more informed decisions – for instance, deciding when to exit a long position before a downturn or when to consider opening a short position to profit from a decline. Throughout this article, we’ll dive deeper into what the pattern entails, the psychology behind it, how to identify and trade it, and some extra tips.

The cryptocurrency market is a perilous world of breathtaking volatility and adrenaline-fueled trading. To some, it’s a game of chance; to others, an opportunity. Investors constantly observe the market, shuffling through graphs and trend indicators to predict a particular asset’s behavior. Technical analysis is a crucial component of learning to understand markets, but while an indicator can signal whether a trade is likely to be profitable or not, it can’t guarantee it.
Markets are fundamentally unpredictable, but over the years, analysts have noticed patterns regularly emerging amidst the noise – recurring and reproducible market behavior performed under specific conditions.
Chart patterns have existed for a long time and are regularly used by traders and analysts worldwide. Indicators can never say for sure whether the market will sway one way or the other, but technical analysis relies on the psychology of market participants, which hasn’t changed much over the years.
What is the Three Black Crows Pattern?
Patterns come in varying shapes and sizes and often predict the onset of either a bullish or bearish price movement. Bullish patterns usually signal an incoming upward price movement, while bearish patterns indicate imminent price depreciation. The ‘Three Black Crows’ is a bearish chart pattern that appears when bears overwhelm the bullish momentum for three trading sessions in a row.
How to read the Three Black Crows?
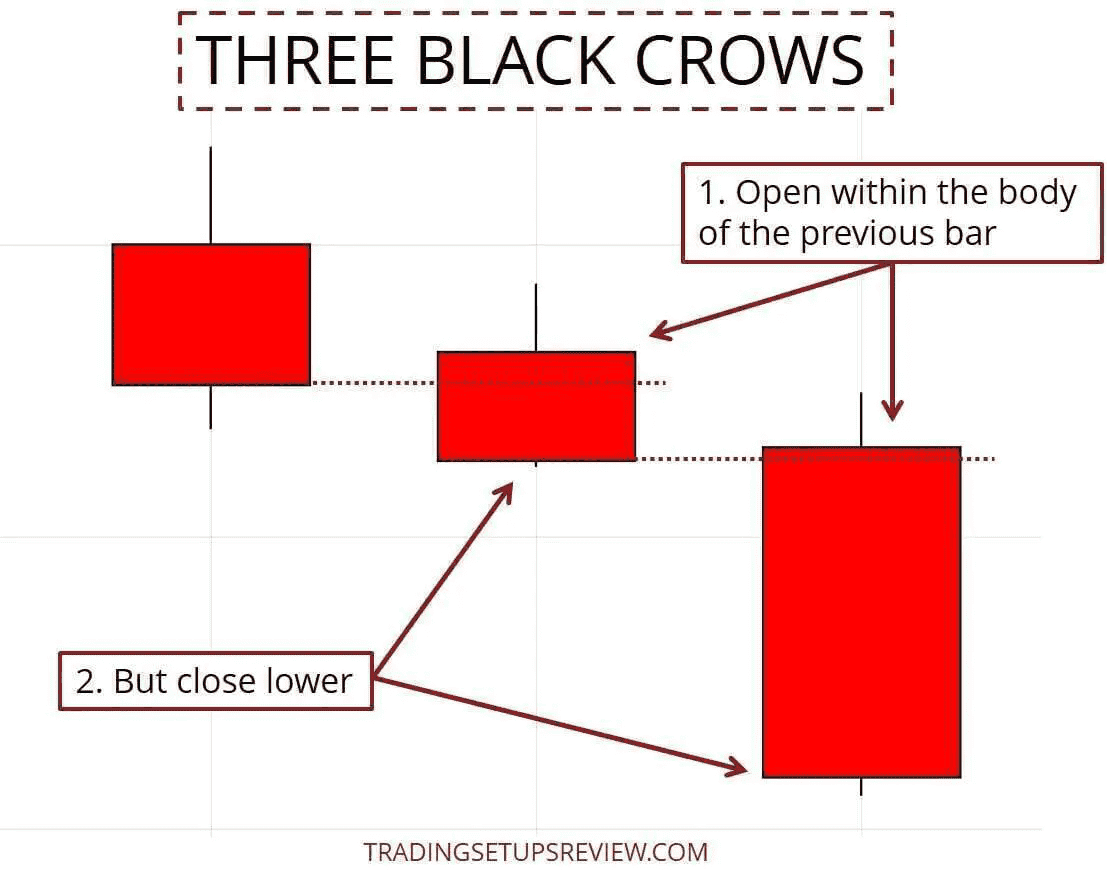
Crows are often associated with bad luck, and the Three Black Crows pattern generally represents an incoming downtrend. To understand why we first need to dig into why these patterns form in the first place. Visually, the Three Black Crows pattern appears as three consecutive, long candlesticks that open within the previous candle’s body but close lower than it.

Source: Investopedia
Psychology Behind the Three Crows Pattern
The Three Black Crows pattern reflects a dramatic shift in market psychology from bullish to bearish. To appreciate why it’s so telling, consider what happens during each of the three candles:
-
During the first crow (first red candle): The market has been in an uptrend, so bullish sentiment was prevailing. However, on this day, sellers come in force. Perhaps news turned negative or big investors started taking profits. The candle closes much lower than it opened, showing that bears overwhelmed bulls that session. Psychologically, this is the first clue that bullish confidence is cracking – some traders who were optimistic are now surprised by the strong drop.
-
During the second crow: Many traders might expect a bounce after a big drop, so the session might start with a hopeful tone (hence the open of the second candle is usually within the prior candle’s body, not dramatically lower). But as the day unfolds, selling resumes. The bulls’ attempt to regain control fails, and the price closes lower again. This confirms to market participants that the prior day’s weakness was not a one-off event. Bullish sentiment erodes further as more traders realize that bears are in charge. Some bulls begin to panic or lose confidence, adding to selling pressure.
-
During the third crow: By now, a lot of bullish traders have been shaken. The third candle often opens slightly above or around the previous close (since there might be a last attempt by bargain hunters or remaining optimists), but once again sellers dominate. Another lower close cements the pattern. At this point, the psychology is largely fear and pessimism among those who were long. Many who held through the first two drops might capitulate on the third, accepting that the uptrend is likely over. Bears, on the other hand, feel emboldened – seeing three consecutive wins, they gain confidence that a downtrend is truly underway.
Throughout these three sessions, the market psychology flips: The optimistic, greedy mindset during the prior uptrend turns into worry and fear. Buyers who were once in control are now overwhelmed and retreating. The metaphor of “crows” (often symbols of bad omen) fits because the pattern signals bad news for prices – it’s as if these three crows are announcing the death of the bullish trend.
Another psychological aspect is self-fulfilling prophecy. Technical traders around the world recognize the Three Black Crows. When they see it, many will take it as a sell signal. In crypto communities and trading forums, spotting such a pattern on Bitcoin or major altcoins often becomes a hot topic, and more traders may start selling or shorting as a result. This collective recognition can amplify the bearish move: the pattern not only indicates sentiment change but also contributes to further bearish sentiment as traders react to it.
How to Trade with The Three Black Crows?
Cryptocurrency markets are infamously volatile, with impressive gains and colossal losses being regular events. A single uninformed decision can wipe out a significant chunk of your profits. In these scenarios, chart patterns like the Three Black Crows can reveal a lot about the market’s potential movements.
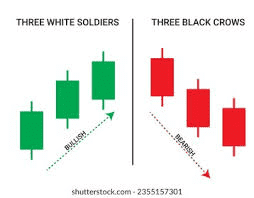
The Three Black Crows vs. The Three White Soldiers
There also exists a version of the Three Black Crows pattern that offers a more optimistic perspective – the Three White Soldiers – which looks like the Three Black Crows Pattern happening in reverse as the candles approach the end of a bullish movement. These visual representations on candlestick charts are crucial for traders to recognize and act quickly upon.
The Three White Soldiers pattern can also form after a period of market consolidation. While it is considered a bullish signal, its appearance isn’t as significant as one that appears after a strong uptrend.
However, these patterns can be quite aggressive, and excessively long candles could signify that the bearish momentum has pushed the asset into oversold territory.
In these cases, short-sellers should be wary of the incoming reversal switching into a retracement if bulls exploit their depleted momentum. However, the Three Black Crows pattern doesn’t always indicate that a bearish reversal is incoming. Most patterns give off false signals at least once in a while, and the Three Black Crows pattern is no exception.
To confirm this pattern, traders often use technical indicators like the Relative Strength Index (RSI) and the Stochastic Oscillator to form a more vivid picture of the market. Chart patterns are everywhere, but learning to recognize them and make quick decisions based on them is closer to an art than a science. However, just because a pattern exists doesn’t mean it indicates something. It’s in our nature as humans to observe patterns in randomness, and understanding which patterns are just noise is a crucial part of becoming a better trader.
Market Sentiment
Despite its simple appearance, the Three Black Crows pattern provides traders with a lot of information. Based on each candle’s size and their positions relative to each other, a lot can be revealed about the market sentiment. Long-bodied bearish candles often imply that there’s enormous selling pressure, while shorter candles indicate relative market stability, with similar opening and closing prices.
Sizes of the Three Black Crows Candlestick
Candles themselves also present traders with a lot of information. The size of the candle’s body and whether it’s solid or hollow can be telling of a market’s certainty about a particular price level, and its wicks let you know just how far the asset’s value could extend outside market prices.
Candle wicks appear both above and below each candle, but their lengths are usually not the same. A strong high and a weak close tend to produce a long upper wick, while a longer lower shadow generally arises from the opposite. A longer lower wick implies sellers are in control of the session, pushing the price further down, while a longer upper wick could mean the bulls are making moves to push the price up.
However, once in a while, there are candles with wicks of equal length, which form a ‘spinning top candlestick.’ The appearance of a ‘spinning top candlestick’ shows a stalemate between the bulls and the bears, and is usually attributed to small-bodied candles due to their nearby opening and closing prices.
Since the candles in a Three Black Crows pattern don’t usually have long wicks, it’s important to consider other metrics alongside. For instance, volume levels can provide an additional layer of insight into the market’s direction. Suppose volumes are low leading up to the Three Black Crows pattern but increase during it. In that case, the uptrend can be seen as initially initiated by a smaller group of investors, and a bigger group of bearish investors dramatically reversed their efforts.
The Three Black Crows pattern and Dojis
The Three Black Crows pattern can also form near candles with equal opening and closing prices (dojis). Dojis usually illustrate market indecision before a trend reversal and can support a bearish signal from the Three Black Crows pattern.
The first candle that appears in a Three Black Crows pattern should always be long-bodied, which implies immense selling pressure on the asset. The candle is usually formed at a continuation point for the uptrend and has a closing price lower than the opening price. The second candlestick can be either short or long but is also bearish in nature, and its opening price lies between the midpoint and closing end of the first candlestick.
The third bearish candlestick copies the second in terms of its opening price and is the final defining indicator of falling prices. This triplet of bearish candlesticks is formed for three consecutive market sessions, setting off warning bells to every trader in the market. However, if the third candle appears smaller than the others, it can be a sign of weakness.
The bears are only said to be in control when the second and third candles are approximately the same size. Otherwise, the prices may have formed a hammer, signaling traders that the bulls are back in business.
These candlesticks can also classify as bearish marubozu, which are long-bodied, bearish candlestick patterns that open at the high and close at the low for that session. Similar to the candles in the Three Black Crows pattern, bearish marubozu don’t have any wicks (‘marubozu’ means ‘bald’ in Japanese) and indicate the potential for extreme bearish momentum.
More Implications
The Three Black Crows imply that the market’s bearish momentum has surpassed its upward drive and is a prominent sign that the current trend is weakening. In January this year, the Three Black Crows pattern emerged on the BTCUSD chart. Between the 10th and 12th of the month, prices cascaded lower, marking a temporary pause in Bitcoin’s bull-run.
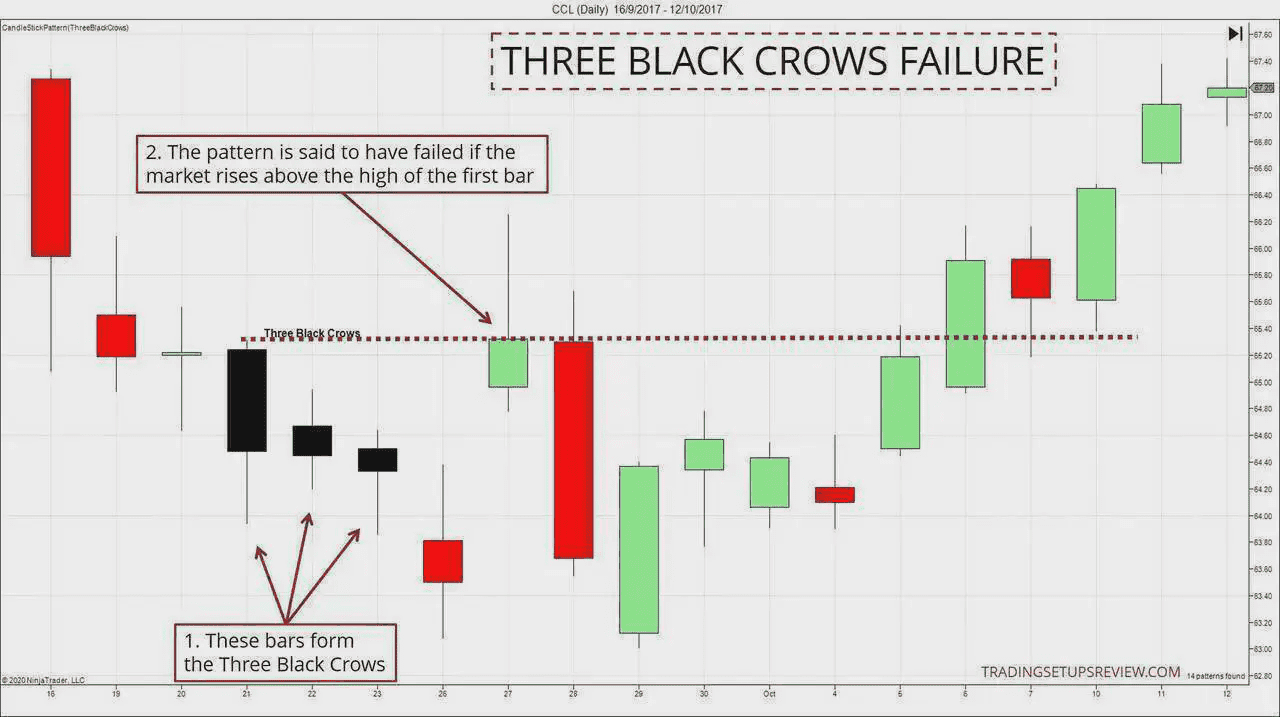
How accurate is the Three Black Crows Pattern?
Prices dropped even lower soon after but eventually moved back into an upward trend due to the bulls’ resilient pressure. On all three days, the closing price of bitcoin was lower than its opening price. The Three Black Crows pattern is usually quite reliable, but it’s crucial to take factors like volume and trend momentum into account before making any trading decisions. Further, it’s vital to set stops above the pattern’s start to catch the price breaking below it.
During a sudden breach below key support levels, technical indicators provide market participants with a greater advantage over graphically represented data, and this can increase the likelihood of a successful strategy. A mere three-day dip in a security’s market performance doesn’t necessarily guarantee a reversal, and it’s essential to observe and learn about the asset’s price history and stability before trading the Three Black Crows pattern.
If the pattern involves a prominent drop in price, traders should be careful of entering oversold conditions, which can lead to periods of consolidation before further moves downward. Technical indicators like RSI can be especially constructive here, while the Stochastic Oscillator gives investors a better idea of the price momentum.
When markets move upwards with strong momentum for extended periods, it’s only natural for bulls to eventually loosen their grip on the market, perhaps selling off to rake in some profits. The Three Black Crows pattern tells traders that there’s a bearish trend on the horizon, pushing them to take short positions.
Visual patterns are always more open to interpretation than technical indicators, and so they’re more helpful to people that understand the nuances of trading them. Where one analyst sees a bullish signal, others may predict a bearish movement. That being said, neither prediction is wrong until the market makes its decision.
Limitations of the Three Black Crows Pattern
Since the Three Black Crows pattern predicts trend formations and not short-term breakouts of momentum growth, the trends following a Three Black Crows pattern also last longer than expected. However, like any technical indicator or chart pattern, the Three Black Crows pattern has its limitations.
Since the pattern uses three candles to confirm a change in trend, the price is carried far away from the recent highs/lows, making it much more difficult to trade with low risk-tolerance objectives. It’s also common for a Three Black Crows pattern to create negative market sentiment, which can put additional negative pressure on the price, so it’s necessary to consider all of the market’s components before making any trades. The indicator is also subject to other challenges:
-
Overextended Moves & Oversold Conditions: If the pattern follows a large price drop, the asset may be short-term oversold. Initiating a new short trade immediately could be risky, as a bounce might occur before further downside. Check indicators like RSI; if it’s below 30, the near-term downside may be limited.
-
Weak Three Black Crows: Not all patterns are equal. If the bearish candles decrease in size or the third candle is short, it suggests waning bearish momentum. Long lower wicks can indicate buyer interest, making the pattern less reliable.
-
Sideways or Choppy Markets: In a sideways market, three red candles may not signal a true trend reversal. Confirm breakdowns by checking if the price breaks established support levels after the candles form.
-
Need for Confirmation: The pattern’s interpretation can vary. Confirmations like breaking major support, bearish moving average crossovers, or increased volume are important. Without them, the signal may be weaker.
-
Fundamental or News Factors: News-driven sell-offs can lead to a Three Black Crows pattern, but if the news is resolved or less severe, the market might rebound.
-
Short Timeframe Patterns: The pattern is strongest in higher timeframes. Relying on three red 5-minute candles may lead to noise. Using a 4-hour, daily, or weekly chart yields better results.
In summary, the Three Black Crows pattern should be used with situational awareness and combined with other analysis for context.
Conclusion
All candlestick chart patterns involve identifying visual clues that point towards a potential trend, but the Three Black Crows pattern is a compelling signal of an incoming market downtrend and can give analysts and traders critical market insight from just one glance at the price charts. It tells a story of bullish exuberance giving way to bearish dominance in a span of three candles. By recognizing this pattern, you can anticipate downtrends and adjust your strategy accordingly – whether that means securing profits before a dip or taking advantage of short-selling opportunities. Though its predictions may be inaccurate here and there, using technical indicators like moving averages and RSI before drawing solid conclusions about an asset’s price action can help identify these false signals more easily. Used wisely, Three Black Crows can be a reliable harbinger of trend change in the volatile crypto market.
As you incorporate the Three Black Crows into your trading toolkit, it’s also important to have the right trading platform to act on these signals. Phemex is a recommended exchange for executing professional crypto trading strategies. On Phemex, you can trade both spot markets and futures contracts, which means you’re well-equipped to respond to patterns like Three Black Crows – for instance, by selling assets or taking short positions when you foresee a downturn. Phemex also offers powerful trading bots that can automate your strategy; you could program a bot to alert you or open trades when it detects patterns or certain technical conditions, ensuring you never miss an opportunity even if you’re away from the screen.
Read More
- Three White Soldiers – A Bullish Reversal Candlestick Pattern
- Dark Cloud Cover Pattern – What Does it Mean?
- The 8 Most Important Crypto Candlestick Patterns
- All About Reversal Candles: How to Read and Trade
- The 3 Most Important Triangle Patterns in Crypto Explained
- Triple Bottom Pattern & Triple Top Pattern in Crypto Trading
- What is Dragonfly Doji: An Indication of a Trend Reversal
- What Are Continuation Patterns: Geometric Shapes to Trading Success