


Doji candles or Doji candlesticks are a particular kind of candlestick pattern that indicates market neutrality. It doesn’t happen very often, but occasionally, bull and bear sentiments are equally matched on the market. Candlestick patterns are the language of price action, and among them, the doji candlestick pattern is one of the most important single-candle signals a trader can learn to recognize. A doji is unique because it indicates a moment of indecision in the market – a tug-of-war between buyers and sellers that ends in a stalemate.
For crypto traders, understanding doji candlesticks and their variations can provide valuable clues about potential trend changes or pauses. In this article, we’ll explore what a doji candlestick is and why it’s useful in crypto trading, the psychology behind its formation, how to identify different doji candlestick types, and strategies to trade using dojis.
What is a Doji Candle?
Doji candle is a candlestick pattern that indicates market neutrality. Market neutrality means that buyers and sellers will cancel one another out, resulting in no net price movements for a given trading period. When this happens, the Doji candlestick pattern emerges on the trading chart.
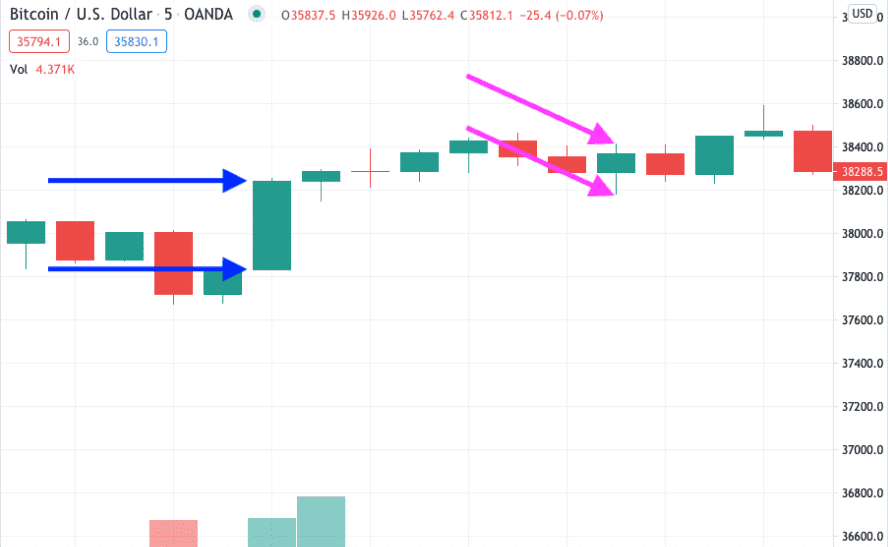
Candlestick patterns tell us about what price movements occurred during a particular period of trading. They comprise four pieces of information:
-
Price when the period opened (indicated by the line indicating the top of the body)
-
Price when the period closed (indicated by the line at the bottom of the body)
-
The highest price during the period (indicated where the upper wick ends at the top)
-
The lowest price during the period (indicated where the lower wick ends at the bottom)
The blue arrows point to the open and close prices in the chart below, while the purple arrows indicate the high and low prices.
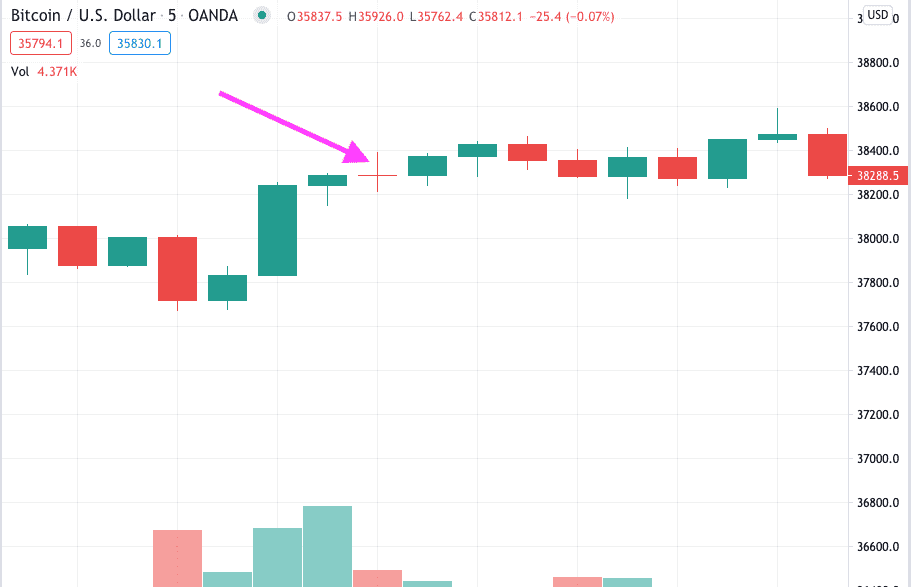
If the prices at open and close are very close or the same, then the candle is displayed with a wick but only a very thin line to indicate the open/close price, with no candle body. This is known as a Doji candle. You can see an example in the chart below.
To Learn more about other types of Candlestick Patterns, read The 8 Most Important Candlestick Patterns in Crypto Trading.
History of Doji Candles
It’s widely accepted that the concept of candlestick patterns originated in Japan and was brought to modern trading in the Western world by Steve Nison in his book “Japanese Candlestick Charting Techniques.”
In Japanese, “doji” means a mistake or error, so the name was given to a particular type of candlestick pattern to indicate that it’s a mistake that traders didn’t intend to make. After all, traders are always hoping the markets will move in one direction or another – it’s the entire point of trading.
Types of Doji Candles and What do they Indicate
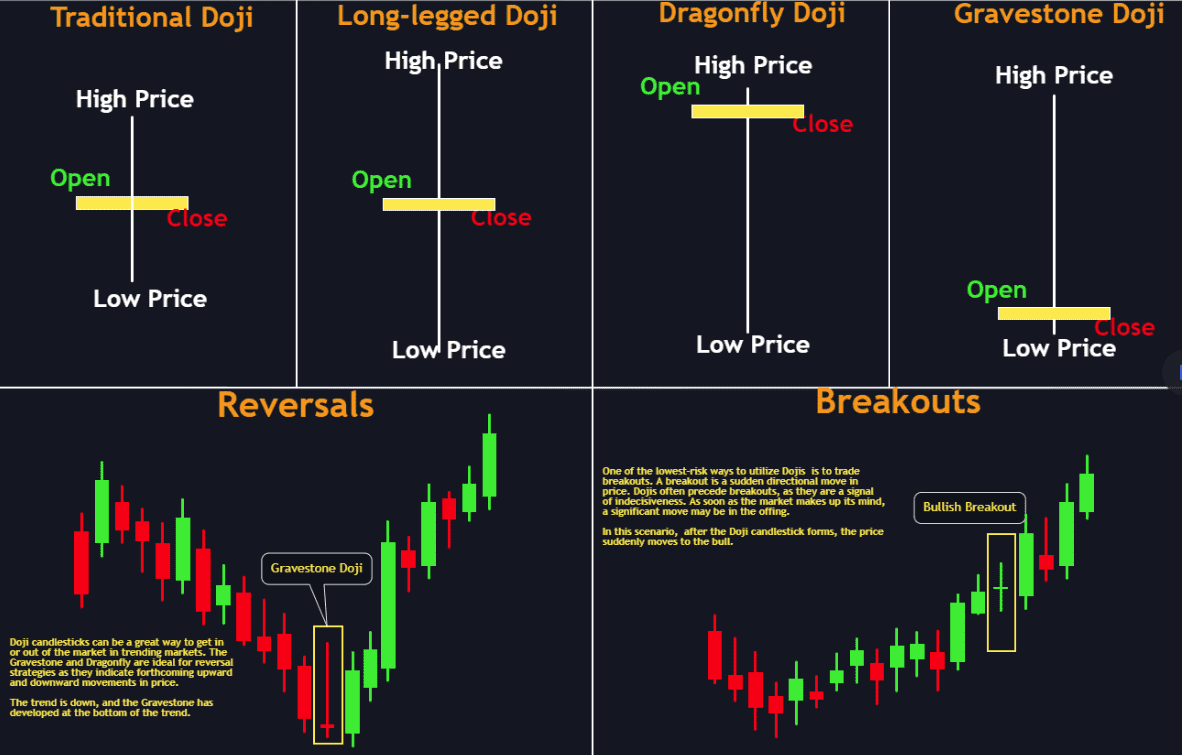
There are different types of Doji candles, as shown below.
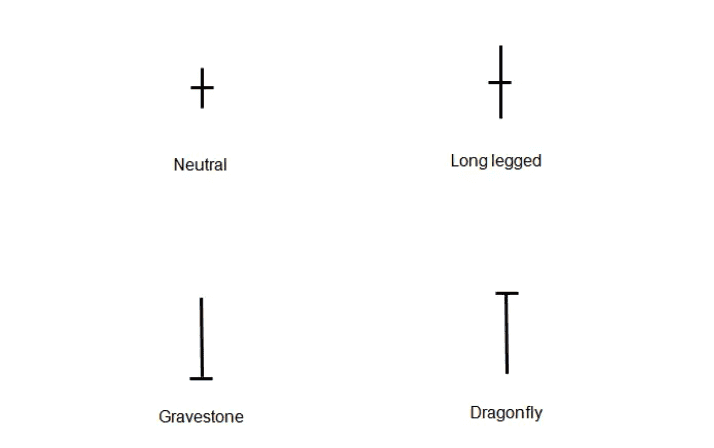
In addition to the four Doji candles in this graphic, there is also one more, indicated by only a straight horizontal line with no wick. This is extremely rare, known as a 4-price Doji. We will cover all five here.
Neutral Doji
The neutral Doji, also known as the Star Doji, indicates that the opening and closing prices were the same, but the equal length of wick at the top and bottom shows that price movements on either side of the opening and closing price were also equal.
Therefore, during this trading session, neither bulls nor bears had any particular advantage over the other, with most trades canceling one another out. It indicates indecision.
Long-legged Doji
The Long-Legged Doji is very similar to the Neutral Doji, but with a longer wick on either side of the open/close price. The Long-Legged Doji indicates that there was more volatility between the high and low prices in the trading session than the neutral Doji.
4-Price Doji
The 4-Price Doji has no wick, just an open and close price, which also indicates the high and low price for the session. A 4-Price Doji is extremely rare in high-volume markets, as it indicates that there was virtually no price movement during the session. If there has been trading volume, it means that market participants are highly indecisive about price direction.
Neither the Neutral Doji, the Long-Legged Doji, or the 4-Price Doji tells you very much about what the markets might do next. Depending on what the preceding candlestick patterns are telling you, it may indicate a price reversal. This is often the case when they’re observed during a strong upward or downward trend, as they show that the market is now becoming indecisive following the recent trend.
The best way to determine what either of these Doji candles means is to wait to see what happens or use another technical indicator to gauge market sentiment. If the price moves up in the next trading period, you could open a long, or if it moves down, open a short. Otherwise, consider using leading indicators such as a stochastic oscillator to predict how the market will move.
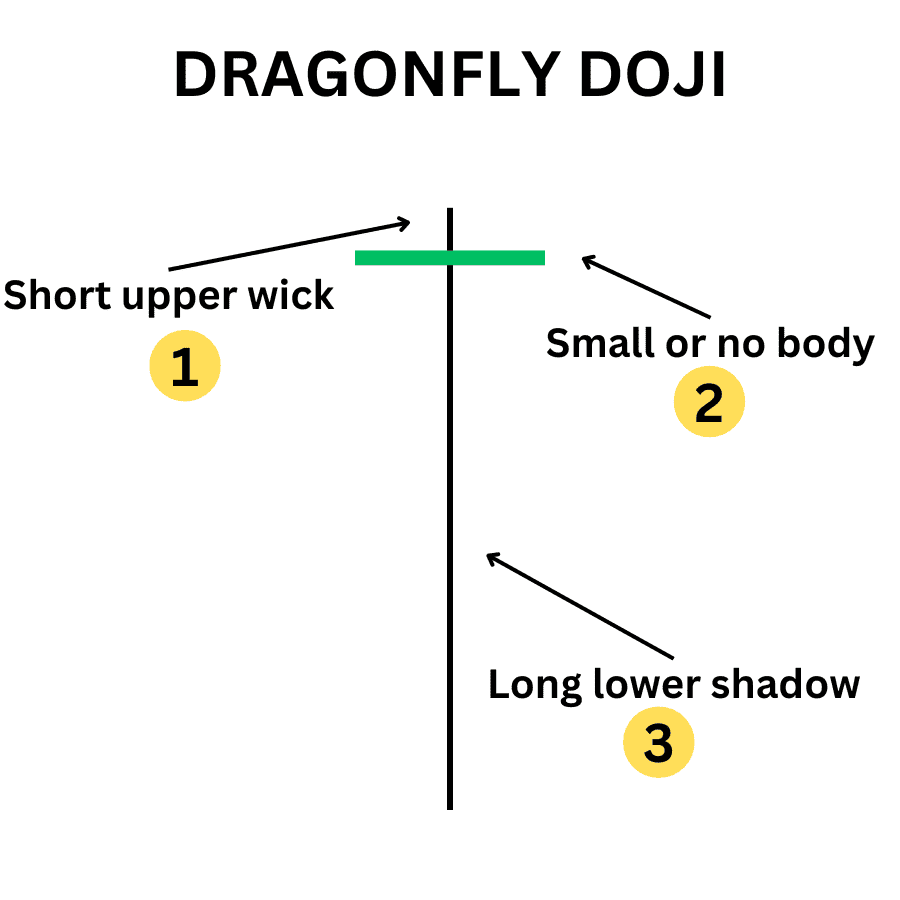
Dragonfly Doji
A Dragonfly Doji shows the open and close price at the same level as the high price. Most or all of the wick is below.
Dragonfly Dojis can often indicate that the market is about to change direction, particularly if they emerge after a downtrend. They demonstrate that traders have rejected the lower prices indicating that there’s a strong buy-side. However, if a Dragonfly Doji appears after an uptrend, it can also indicate a reversal is on the way. The next candle on the chart will confirm the market direction.
To learn about the indication behind the Candlestick, read What is Dragonfly Doji?
Gravestone Doji
A Gravestone Doji is the opposite of a Dragonfly Doji, showing the open and close price around the same level as the low price with a long upper wick.
If seen following an uptrend, which is most common for this candlestick pattern, Gravestone Dojis can be a bearish indicator. Traders may exit their long positions or wait for confirmation from the next candle.
How to Trade Doji Candlesticks
Understanding doji candlesticks is crucial for crypto trading, but acting on that knowledge requires careful strategy. Here are key approaches to consider:
-
Wait for Confirmation: A doji signals indecision, so don't buy or sell immediately. Instead, wait for the following candle to confirm the direction. For instance, in a downtrend, if a dragonfly doji forms and the next candle closes higher, it validates a potential bullish reversal.
-
Use Dojis at Support/Resistance: Dojis are particularly significant at key price levels. If a doji appears near support, it may suggest buyers are stepping in. Conversely, a gravestone doji near resistance could indicate sellers are rejecting that level.
-
Incorporate Volume and Indicators: Pairing dojis with high volume or other indicators like RSI can enhance confidence in your trades. A doji formed at an outer Bollinger Band might also signal a reversal.
-
Trading Star Patterns: Patterns like the morning or evening star involve a doji as the middle candle and can be effective trading signals. Enter a long after a morning star, placing a stop below the doji; do the opposite for an evening star.
-
Intraday Trading: For day-trading, use dojis for quick entries or exits. However, smaller timeframe dojis are less reliable, so combine them with other signals.
-
Use Stop Losses: Set stops just beyond the doji’s extreme to manage risk. If price breaches this level, it negates the doji's signal.
-
Partial Positions & Trend Continuation: A doji may indicate a pause in a strong trend rather than a reversal. If confirmed with another candle in the trend direction, it can be used to re-enter or add to a position.
By applying these strategies, you can more effectively incorporate doji candlesticks into your trading approach.
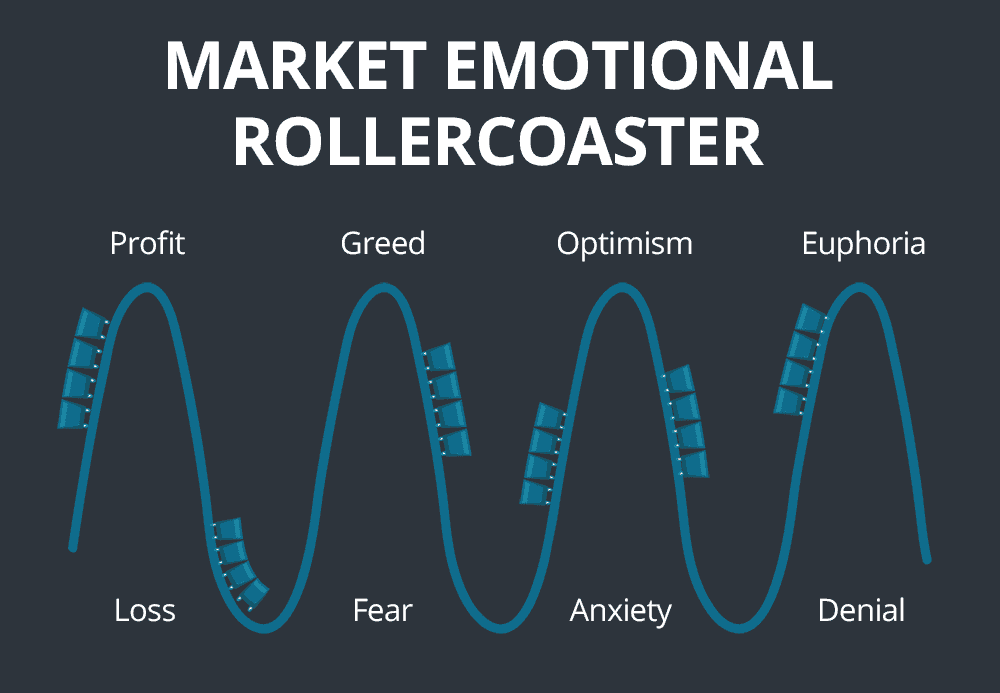
Psychology Behind Doji Candlesticks
The power of the doji candle lies in the psychological equilibrium it reveals, indicating indecision among traders. During the formation of a doji, buyers push the price up at times, while sellers push it down, ultimately closing at the open price. This reflects that neither bulls nor bears gained control, signaling market uncertainty.
A doji appearing after a trend often suggests a sentiment shift. For example, in a strong uptrend, a doji may indicate that bullish enthusiasm is meeting bearish resistance. Conversely, in a downtrend, it shows that sellers might be losing conviction, with buyers starting to test the waters.
Traders may hesitate in response to a doji, waiting for more information or external factors before committing. The traditional Japanese interpretation of "doji," meaning "blunder," reflects the idea that the market failed to find direction.
Savvy traders don’t act on dojis alone; they wait for the next candle to confirm which side gains strength. For instance, a strong green candle after a doji in a downtrend may indicate a reversal, while a strong red candle suggests the prior trend continues.
Different types of dojis, like the long-legged doji, dragonfly doji, and gravestone doji, provide additional insights into market sentiment. Each has unique psychological implications, with the dragonfly typically bullish and the gravestone bearish.
In summary, the doji encapsulates market indecision and can signal potential turning points. Understanding the doji can help traders prepare to act as the market resolves its uncertainty.
Limitations of Doji Candles - When Not to Use Them
While doji candles can signal indecision in the market, there are important limitations to consider:
-
Not a Standalone Guarantee: A doji doesn’t ensure a reversal or significant move. Many dojis lead to continued trends, so seek confirmation from other indicators (e.g., support or volume spikes) before acting.
-
False Signals in Low Liquidity: In thinly traded assets or low timeframes, dojis can result from noise rather than meaningful market sentiment. Relying on these could lead to whipsaws; dojis are more reliable with higher liquidity.
-
Overabundance in Ranging Markets: In sideways markets, dojis reflect indecision as the norm. Trading off single dojis during consolidation is risky; wait for a breakout for a clearer move.
-
Need for Speed: Waiting for confirmation may result in entering trades at worse prices. This cautious approach can mean missing out on key price moves.
-
Misidentifying Candle Types: It’s crucial to distinguish dojis from similar candles, like spinning tops. Small-body candles can be misleading, so focus on context and the story they tell.
-
One Piece of the Puzzle: Dojis should be part of a broader analysis, considering trend, momentum, volume, and news. Isolated trading based on dojis during volatile periods can be dangerous.
-
Emotional Bias: Traders may project their desires onto dojis, interpreting them favorably or unfavorably. It’s essential to remain objective, treating dojis as indicators of caution rather than definitive signals.
Conclusion
By themselves, Doji candles aren’t the most powerful indicators of any given movement. However, used as part of a broader reading of market conditions, they can help anticipate changes in trends or prompt a trader to undertake a more detailed analysis to decide when to trade. In the quest to trade crypto like a pro, mastering candlestick patterns is a crucial step, and the doji candlestick is one of the cornerstone patterns to understand. A doji represents that delicate balance and hesitation in the market, and while it’s a small pattern, it carries big implications. By now, you’ve learned that a doji candle is not an outright buy or sell signal, but rather a signal to pay close attention. It’s the market’s way of telling you that the previous momentum has paused, and a new move could be on the horizon.
Now, as you prepare to apply this knowledge, having the right tools and platform will make a significant difference. Phemex is an excellent choice for executing candlestick-based strategies. Phemex offers both spot trading and futures trading with leverage. This flexibility means you can act on doji signals in either direction and even hedge if needed. Risk management is seamless on Phemex because you can set stop-loss and take-profit orders at the time of entry. For instance, if you enter a trade after a doji confirmation, you can immediately place your stop beyond the doji’s high/low and set target orders. This way, you execute your plan calmly without emotional interference.
Beyond just trading, Phemex Earn can complement your strategy. Say the market is indecisive (lots of dojis, low volatility) and you decide to stay on the sidelines, you could put some into Phemex Earn to generate passive yield. It’s a smart way to let your money work while you wait for prime trading opportunities.
Beyond just trading, Phemex Earn can complement your strategy. Say the market is indecisive (lots of dojis, low volatility) and you decide to stay on the sidelines, you could put some into Phemex Earn to generate passive yield. It’s a smart way to let your money work while you wait for prime trading opportunities.