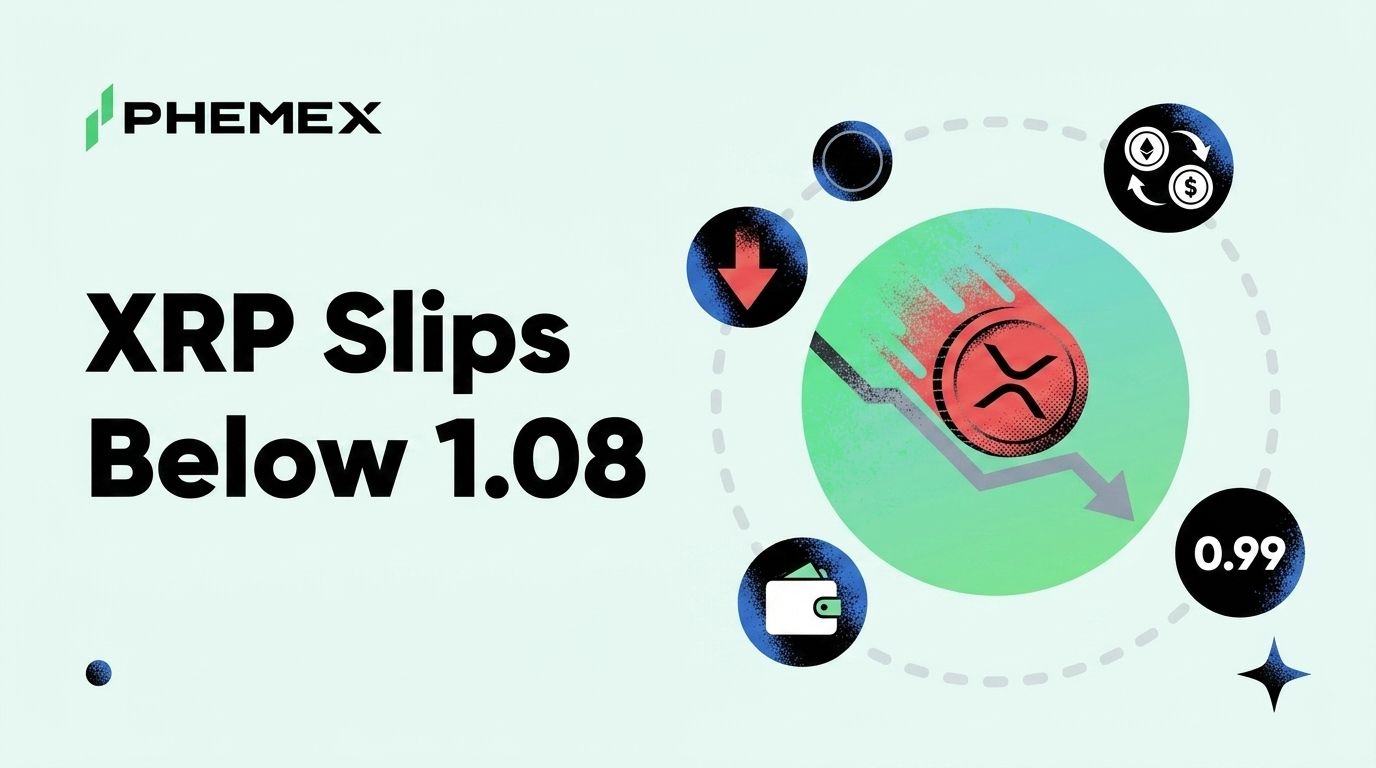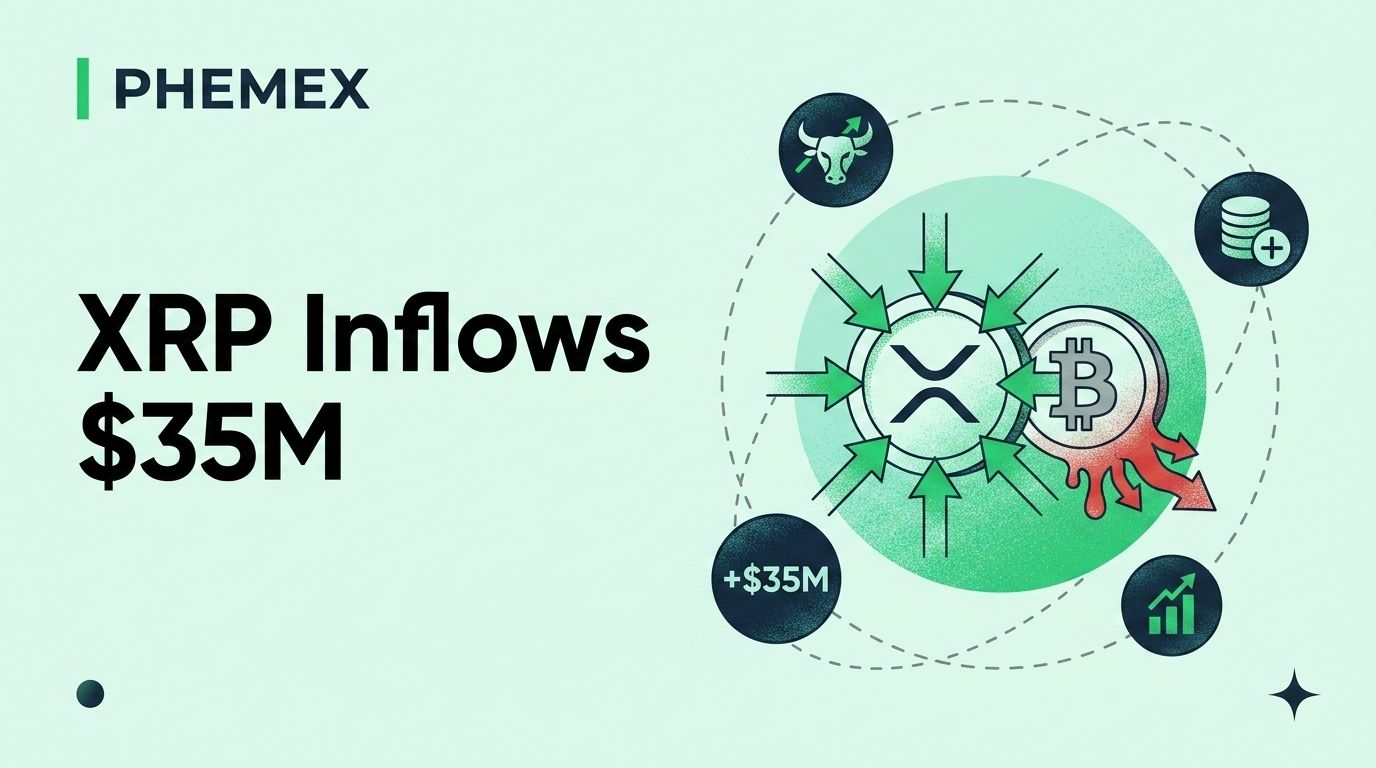
XRP focused products pulled in $35 million in net inflows from May 20 through May 29 while spot Bitcoin and Ether ETFs collectively lost more than $2 billion across the same period. The seven US spot XRP ETFs that launched between late 2025 and early 2026 now hold a combined AUM of roughly $1.2-1.4 billion, with May posting the strongest monthly net inflow figure since launch at approximately $84 million. XRP price ranged $1.38-$1.46 through the period, market cap held above $83 billion, and the asset reclaimed the #5 spot from BNB in late May.
The rotation matters because it is the cleanest piece of evidence to date that institutional XRP demand is structurally separate from BTC and ETH demand. The same multi-strategy funds that were rotating out of IBIT and the major ETH products were rotating into XRP exposure at the same time. That is not coincidence. It is a deliberate allocation decision driven by three specific tailwinds.
The Three Tailwinds Behind the Inflows
The first is the CLARITY Act tailwind. The bipartisan crypto regulatory framework that passed Senate committee earlier in 2026 explicitly classifies XRP as a digital commodity under CFTC jurisdiction, resolving the legal status question that had been pending since the SEC's 2020 enforcement action. The classification removes the residual regulatory overhang on XRP that had kept some institutional allocators away even after the SEC's 2023 court loss in the Ripple case.
The second is the Ripple institutional partnership cadence. Ripple announced 10 new institutional partnerships for On-Demand Liquidity and tokenized asset issuance in the first half of 2026, including agreements with three Asian banks, a major European custodian, and two US payment processors. Each partnership represents a structural source of long-term XRP demand because the operational use case requires the parties to hold and transact in XRP rather than just speculate on it.
The third is the XRPL fixCleanup3 amendment activation in mid-May. The amendment cleaned up legacy ledger objects, improved transaction efficiency, and laid the groundwork for the next phase of XRPL feature releases focused on tokenized real-world assets and programmable settlement. The technical upgrade is incremental but signals continued development velocity on a chain that critics had previously dismissed as static. The broader XRP and Trump-Fed payment-order context is the policy backdrop that allocators are pricing alongside these three drivers.
What $35 Million Means in Context
Thirty-five million dollars across nine trading days is not a large absolute number. By comparison, IBIT can absorb $35 million in a single hour during normal trading. The figure is interesting because of what it does not include. The same period saw the seven XRP ETFs trade roughly $250 million in total daily volume, of which the $35 million net flow was a small fraction. The bulk of the trading volume was market-making, intraday rotation, and existing-holder rebalancing.
The net flow is the structural signal. When net flows are positive in a period when broader crypto ETF flows are negative, the implication is that there is a distinct buyer cohort that is not following the broader risk-asset rotation pattern. That buyer cohort is what makes XRP's institutional demand structurally separate from BTC and ETH demand.
The historical pattern is also worth noting. XRP ETFs have posted positive net inflows in 8 of the 9 months since the product cohort launched, with the only negative month being the broader risk-off period in February 2026. By comparison, BTC ETFs have posted negative net inflow months 4 of 9 across the same period.
XRP's Reclaim of the #5 Position
XRP's market cap climbed above $83 billion in late May and reclaimed the #5 position on the global crypto market cap rankings from BNB, which had held that slot for most of the spring. The position swap is symbolic but also operationally significant. The top-10 market cap rankings drive index inclusion decisions across passive crypto products, and a sustained position above BNB pulls additional structural demand from index-tracking funds and crypto basket products.
XRP and BNB have been swapping the #5 and #6 slots through the first half of 2026 as the two assets have diverged in narrative. XRP has been the institutional-adoption story. BNB has been the ecosystem-utility story. The two narratives produce different buyer cohorts. The position swap reflects which narrative has been winning the marginal flow on any given month.
For context on the broader XRP story and the asset's role in the Ripple ecosystem, the Phemex academy piece on what XRP is covers the full background.
The Technical Setup Into June
XRP is trading at approximately $1.42 with a market cap of $83 billion as of June 1. The chart is in a defined consolidation range between $1.30 support and $1.55 resistance, with the consolidation running approximately five weeks. The structural read is that XRP is digesting the rapid 2025-2026 advance from the $0.50 base into a sustained higher range.
The key resistance is $1.55. This is the level that capped multiple advance attempts through April and May and is the immediate target for the continuation thesis. A weekly close above $1.55 with sustained volume would project the next leg toward the prior cycle high in the $2.20-$2.40 zone.
The key support is $1.30. This is the structural defense level that has held on every retest through the spring consolidation. A daily close below $1.30 would break the consolidation structure and bring the deeper retracement toward $1.10-$1.15 into play.
The base case for the first week of June is a continuation of the range trade with the ETF inflow cadence supporting a slow drift toward the upper boundary. A sharp catalyst (a major Ripple partnership announcement, a CLARITY Act implementation milestone, or a broader risk-on macro move) would be the trigger to break $1.55.
Why the Institutional Demand Is Structurally Different
The reason XRP institutional demand looks different from BTC and ETH demand is the actual mechanism of the buyers. BTC ETF demand is largely macro-allocation driven. Institutional buyers add BTC exposure when they want to add risk-asset beta with a digital-commodity overlay. They reduce BTC exposure when they want to take risk off or rotate into other risk assets.
XRP institutional demand has more components. There is the macro-allocation cohort that treats XRP as another digital commodity exposure. There is the payments-thesis cohort that treats XRP as exposure to the cross-border payments build-out via Ripple's partnerships. There is the legal-clarity cohort that bought XRP specifically because the regulatory overhang resolved. Each cohort has a different time horizon and a different trigger for adding or reducing exposure.
The diversified demand structure tends to produce smoother net flows because the different cohorts respond to different signals. When the macro cohort is selling, the payments-thesis cohort may still be buying. The result is the pattern visible in the data. Persistently positive net flows even when broader crypto ETF flows are negative.
Frequently Asked Questions
Why is XRP attracting inflows when BTC and ETH are losing them?
Three reasons. Legal clarity from the CLARITY Act removed an institutional barrier specific to XRP. Ripple's institutional partnership cadence is producing structural sources of demand that BTC and ETH do not have. And the XRPL technical upgrade activations signal continued development velocity. The combination is XRP-specific.
How many XRP ETFs are currently live?
Seven US spot XRP ETFs launched between late 2025 and early 2026. The cohort includes products from multiple major issuers with various fee structures and staking participation options. Combined AUM is approximately $1.2-1.4 billion as of late May 2026.
What is the XRPL fixCleanup3 amendment?
The amendment is a ledger-level upgrade that cleaned up legacy transaction objects, improved efficiency, and prepared the chain for the next phase of feature releases. The upgrade is incremental but signals that XRPL development is still active and that the chain is not architecturally frozen.
Will the position swap with BNB hold?
Possibly. The two assets have traded the #5 and #6 slots multiple times in 2026. The differential depends on which narrative attracts more marginal flow in any given month. XRP's institutional ETF cohort gives it a structural edge in months where institutional flow dominates. BNB's ecosystem activity gives it an edge in months where retail flow dominates.
Bottom Line
XRP funds pulled in $35 million from May 20-29 while broader crypto ETFs lost $2 billion, market cap held above $83 billion, and the asset reclaimed the #5 position. The institutional demand is structurally different from BTC and ETH demand because the buyer cohort includes macro-allocation, payments-thesis, and legal-clarity components rather than just macro-allocation. The technical setup is a consolidation range with $1.55 resistance and $1.30 support. The next 30 days of CLARITY Act implementation milestones and Ripple partnership announcements are the catalysts most likely to break the range. The structural read favors continuation, but only if the macro backdrop cooperates and the institutional flow cadence holds. Watch the weekly ETF flow data and the $1.55 resistance level. Those two indicators set the tone for July.
This article is for informational purposes only and does not constitute financial or investment advice. Cryptocurrency trading involves substantial risk. Always conduct your own research before making trading decisions.