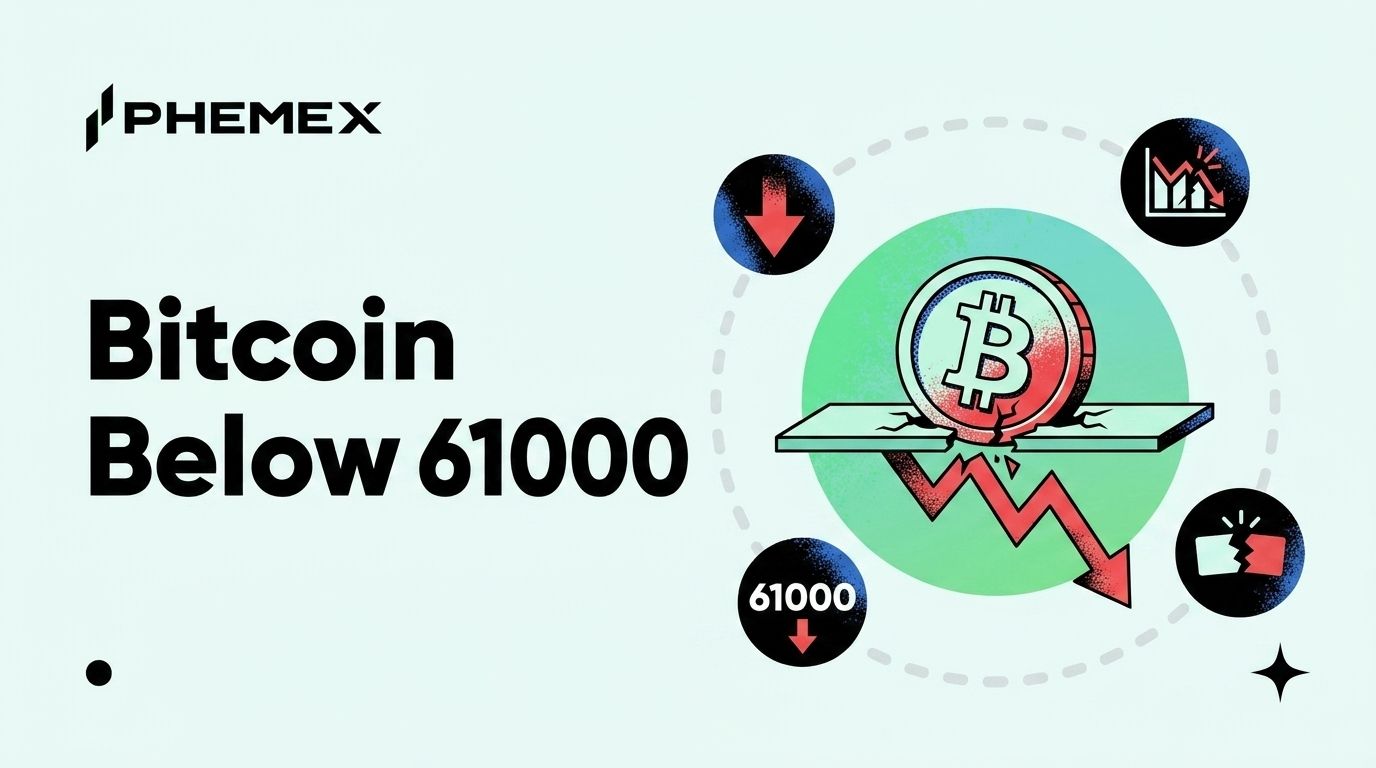
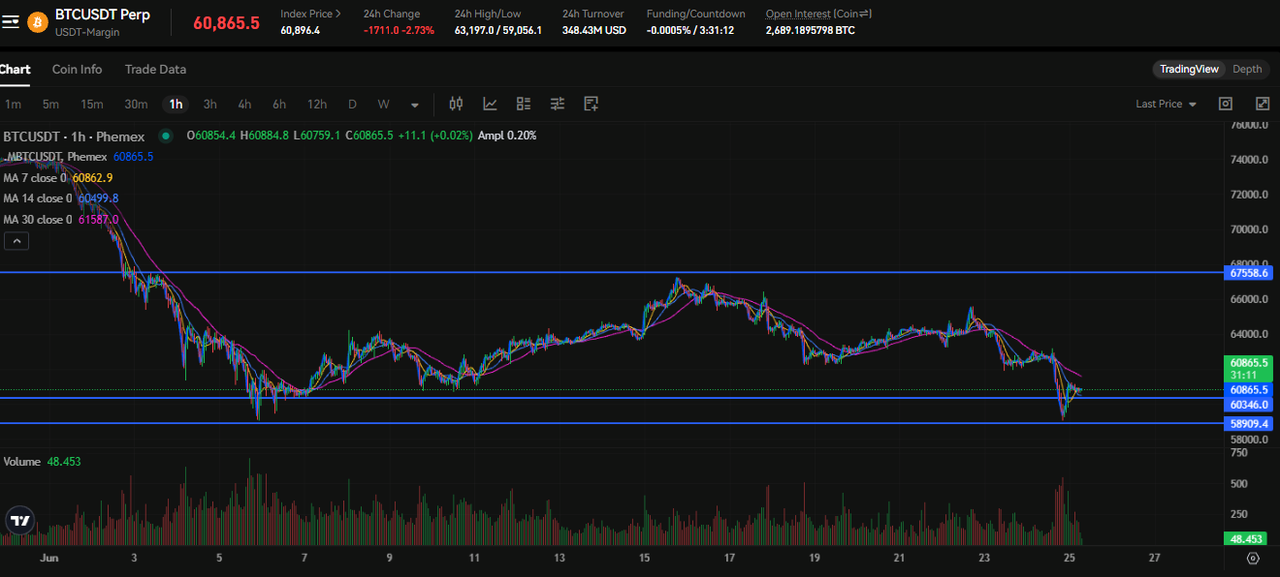
Bitcoin is trading at $60,714, down 2.96% on the day and now roughly 25% below the May peak of $77,600. This is the third straight crash day, and the slide below the $61,000 line puts BTC in a zone where the next support shelf, not the last one, decides how this week ends. The selling is not random. Six straight weeks of spot Bitcoin ETF outflows have pulled out roughly $5.94 billion, long-term holders have distributed around $2.4 billion into the weakness, and the Fear and Greed Index has dropped to 24, deep in Extreme Fear.
Price action is what matters now, and the levels are tight. Here is where the support sits, what would confirm a bottom versus more downside, and the decision rules that go with each level.
Bitcoin Price Snapshot for June 25, 2026
- Price: $60,714, down 2.96% on the day
- Drawdown: ~25% below the May 2026 peak of $77,600
- Spot ETF flows: ~$5.94 billion of net outflows across the last 6 weeks
- Long-term holder selling: roughly $2.4 billion distributed into the decline
- Sentiment: Fear and Greed Index at 24 (Extreme Fear)
The Support and Resistance Levels That Matter Now
With BTC sitting at $60,714, the chart breaks into a clear set of shelves above and below the current price. The two supports below are where buyers have historically stepped in, and the two resistances above are the ceilings any bounce has to clear before it means anything.
|
Level
|
Price
|
Why it matters
|
|
Resistance 2
|
$64,000
|
Prior demand shelf that flipped to supply on the way down, the level a real recovery must reclaim
|
|
Resistance 1
|
$62,500
|
First overhead ceiling, the breakdown point bulls need to retake to stop the bleeding
|
|
Current
|
$60,714
|
Third straight red day, trading below the psychological $61,000 line
|
|
Support 1
|
$58,000
|
First major shelf below, a round-number zone where short-term buyers tend to defend
|
|
Support 2
|
$56,000
|
The line in the sand, losing it on volume opens the door to a deeper flush
|
The structure is simple to read. As long as BTC holds $58,000, this looks like a sharp correction inside a larger range rather than a trend break. A clean loss of $56,000 changes the character of the move and shifts the conversation to lower targets. On the upside, nothing improves until price reclaims $62,500, and the bounce only earns trust above $64,000.
What makes the current level fragile is that it sits between supports rather than on one. BTC is not bouncing off $58,000 yet, it is grinding toward it. That distinction matters for anyone sizing a position, because catching a falling knife mid-air is different from buying a tested level.
There is also a reason these specific numbers carry weight beyond being round. $58,000 and $56,000 both line up with consolidation zones from earlier in the year where heavy volume changed hands, which means a lot of coins were bought there. Levels with real prior volume behind them defend better than arbitrary lines, because the traders who accumulated in that range have an incentive to protect their cost basis. That is why the reaction at $58,000 will tell you far more than the slide into it has.
How ETF Outflows and Long-Term Holder Selling Built the Pressure
The drop below $61,000 did not come from leverage alone. It came from the two slowest, heaviest hands in the market selling at the same time.
The first is the institutional bid going quiet. Spot ETFs have now logged six consecutive weeks of net outflows totaling around $5.94 billion, which means the steady daily buying that absorbed sell pressure for most of the cycle has reversed into a daily drag. When you want to see if the dip is being bought or sold, ETF flow data is the cleanest read available, and right now it is pointing the wrong way for bulls. You can track the daily numbers through Bitcoin ETF flow data and the published issuer-by-issuer figures on Farside's BTC ETF flow tracker.
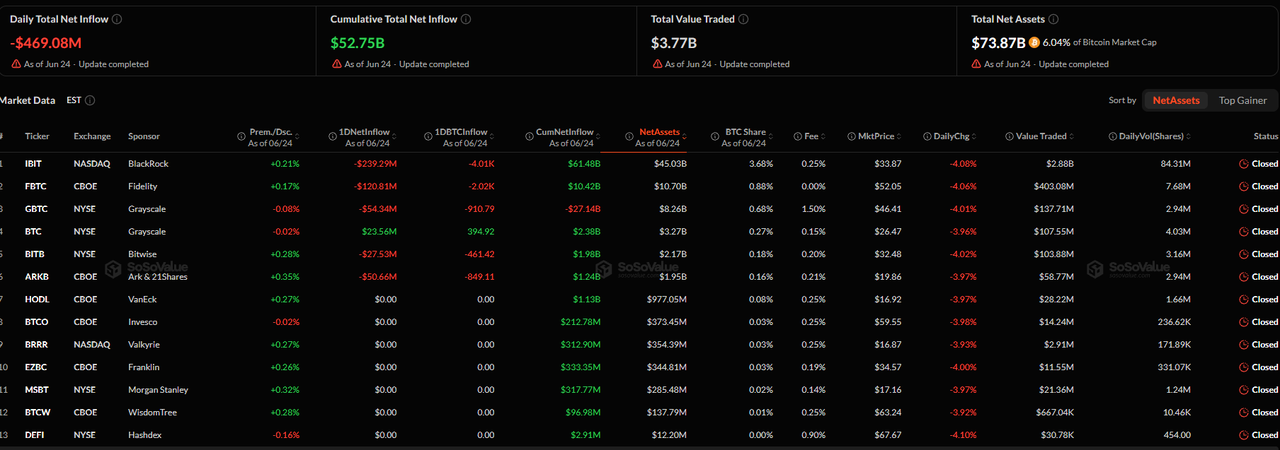
Source: SosoValue
The second is long-term holders distributing into the weakness. Wallets that have held for months or years have moved roughly $2.4 billion of supply, and that cohort matters because they usually sell strength, not weakness. When long-term holders sell into a falling market, it tells you they are de-risking rather than trimming gains, and that kind of supply takes time to clear.
Put together, the picture is mechanical. Institutions are not buying, long-term holders are selling, and there is no fresh catalyst pulling new capital in. That is the recipe for the kind of grind-down BTC has printed over the last three sessions. The Fed pivot debate is in the background, but the immediate driver here is supply and demand on the order book, not macro headlines.
The sequencing matters too. ETF outflows tend to lead, because they reflect allocation decisions made by funds and advisors who move slowly and in size, and once that selling starts it rarely reverses on a single green day. Long-term holder distribution usually follows as price weakness pulls more of that cohort off the sidelines. The point where both finally exhaust is the point where the grind stops, and that is exactly the data combination worth watching over the next several sessions rather than any one candle.
What Would Confirm a Bottom Versus More Downside
A bottom is a process, not a single candle, and the confirmation signals are concrete. The cleanest tell is a reclaim. If BTC drops toward $58,000, holds it, and then pushes back above $62,500 on rising volume, that sequence (test, hold, reclaim) is the classic bottoming pattern and the signal that the sellers are exhausted.
Flow data is the second confirmation. A bottom that lasts almost always lines up with ETF outflows slowing to flat or flipping back to inflows. Watch for the first green daily flow print after this six-week streak, because that is the institutional bid switching back on. Liquidation data tells the same story from another angle, and the cascade of long liquidations on a flush usually marks capitulation rather than the start of a new leg down. The aggregate figures on CoinGlass liquidation data are the place to check if a wipeout already happened or is still coming.
Longer-term value tools give context for how stretched this is. BTC is ~25% off the high, which is a normal correction depth, not an extreme one, and traders comparing this to prior cycles often check the Bitcoin 200-week moving averageand the Bitcoin rainbow chart to gauge if price is near a historical accumulation band or still has room to fall.
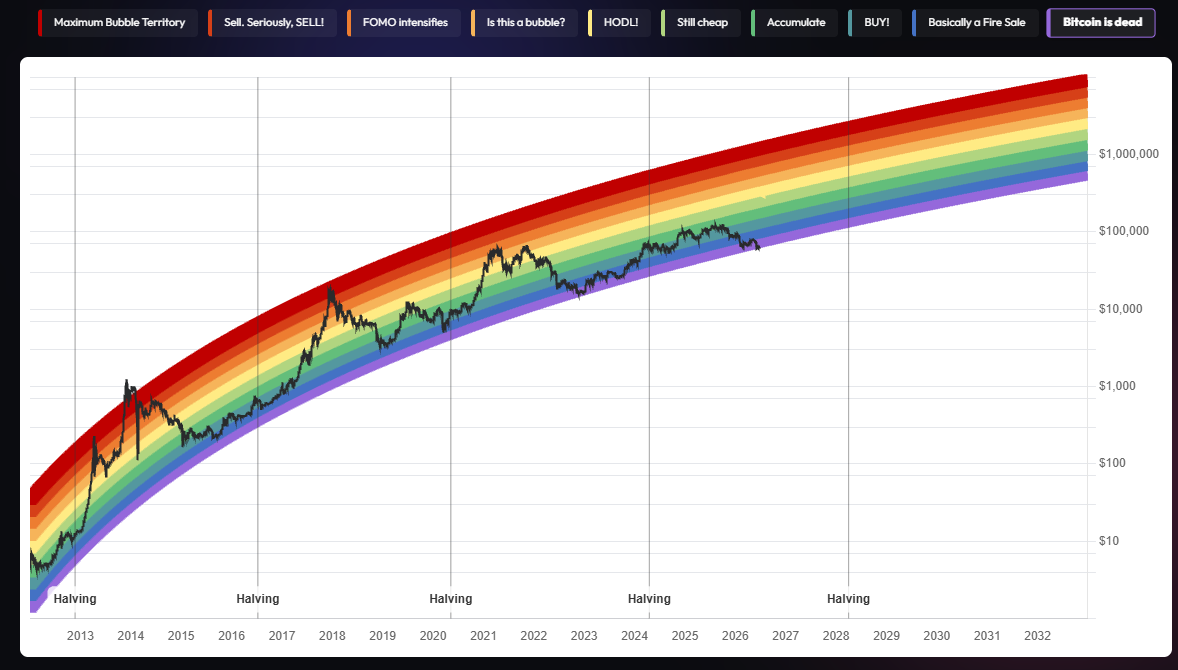
Source: Blockchaincenter
The downside case is equally clear. A daily close below $56,000 with heavy volume and accelerating ETF outflows invalidates the bottom thesis. That combination would signal the correction is turning into something deeper, and the next meaningful support sits well below the current range. The single most important thing to watch is if $56,000 holds on a closing basis, because that is the level separating a sharp dip from a trend change.
Reading the Extreme Fear Print
The Fear and Greed Index at 24 is the sentiment side of the same story, and it cuts both ways. Extreme Fear historically clusters near local bottoms because it marks the point where the weak hands have mostly sold and the marginal seller is running out. The readings below 25 over the past two years have more often preceded bounces than further crashes, which is why contrarians start paying attention here.
The catch is that Extreme Fear is necessary but not sufficient. Sentiment can sit in the low 20s for days while price keeps grinding lower, so a single Extreme Fear print is not a buy signal on its own. It becomes useful only when it lines up with a price level holding and flows turning. You can track the live reading and its history on Alternative.me's Fear and Greed Index.
The honest read is that sentiment is doing its job. It is telling you the crowd is scared, which is the emotional backdrop bottoms tend to form in, but it is not telling you the bottom is in. For that you still need the price and flow confirmation, and traders who want to dig into the data side can compare several of the best Bitcoin valuation and analysis toolsrather than relying on one gauge.
Frequently Asked Questions
Why is Bitcoin dropping below $61,000 today?
The drop is driven by supply, not a single headline. Spot ETFs have logged six straight weeks of outflows totaling around $5.94 billion, long-term holders have distributed roughly $2.4 billion, and there is no fresh buying catalyst to absorb it. With institutions stepping back and long-term holders selling, BTC ground down to $60,714 on its third straight red day.
What are the key Bitcoin support levels right now?
The first major support is $58,000, a round-number zone where short-term buyers tend to defend, and the line in the sand below that is $56,000. As long as BTC holds $58,000 this reads as a correction, and a daily close below $56,000on heavy volume is the level that would signal a deeper move down.
Is now a good time to buy the Bitcoin dip?
The data favors patience over chasing. A durable bottom usually shows up as a test of $58,000 that holds, a reclaim of $62,500 on rising volume, and ETF outflows slowing to flat or turning positive. Buying before those signals confirm means catching a falling knife, while waiting for the reclaim trades a slightly higher entry for far better odds.
Does Extreme Fear mean Bitcoin has bottomed?
Not by itself. The Fear and Greed Index at 24 shows the crowd is scared, and that emotional backdrop often surrounds local bottoms, but sentiment can stay low for days while price keeps falling. It only becomes actionable when it lines up with a support level holding and flow data improving.
Bottom Line
Bitcoin at $60,714 is sitting between shelves on its third straight red day, pressured by ~$5.94 billion of ETF outflows and ~$2.4 billion of long-term holder selling, with sentiment in Extreme Fear at 24. The level map is the whole trade from here. Hold $58,000 and reclaim $62,500 on volume, and this is a correction that found its floor. Lose $56,000 on a daily close with rising outflows, and the move turns into something deeper that targets lower support.
The decision rules are clean. Above $64,000, the recovery has legs. Between $58,000 and $62,500, it is a range to trade with defined risk, not conviction. Below $56,000, step aside until the chart rebuilds. Extreme Fear says the crowd has mostly sold, but confirmation comes from price holding and flows turning, not from a number on a sentiment gauge.
This article is for informational purposes only and does not constitute financial or investment advice. Cryptocurrency trading involves substantial risk. Always conduct your own research before making trading decisions.