XRP is trading at $1.07, down 3.03% on the day, after the broad crypto market turned risk-off and dragged nearly every major asset lower with it. Bitcoin slipped under $61,000 in the same session, and when BTC moves like that, XRP rarely escapes the pull. The drop carried XRP back below the $1.08 line that had been acting as a near-term pivot all week.
There is one number that does not fit the sell-off story, though. XRP spot ETFs still pulled in roughly $5.31 million in net inflows on June 22, extending a seven-week accumulation streak even as the price bled lower. That gap between steady institutional buying and a falling chart is the real story today. Here is where the key levels sit, what the divergence means, and the rules that decide the next move.
XRP Price Snapshot for June 25, 2026
- XRP price: $1.07 on the spot market as of this morning
- 24-hour change: down 3.03%, in line with the broad market
- XRP spot ETF net inflows: $5.31M on June 22, a seven-week streak
- Nearest support: $1.04, the level buyers defended on the last dip
- Nearest resistance: $1.10, the line bulls need to reclaim first
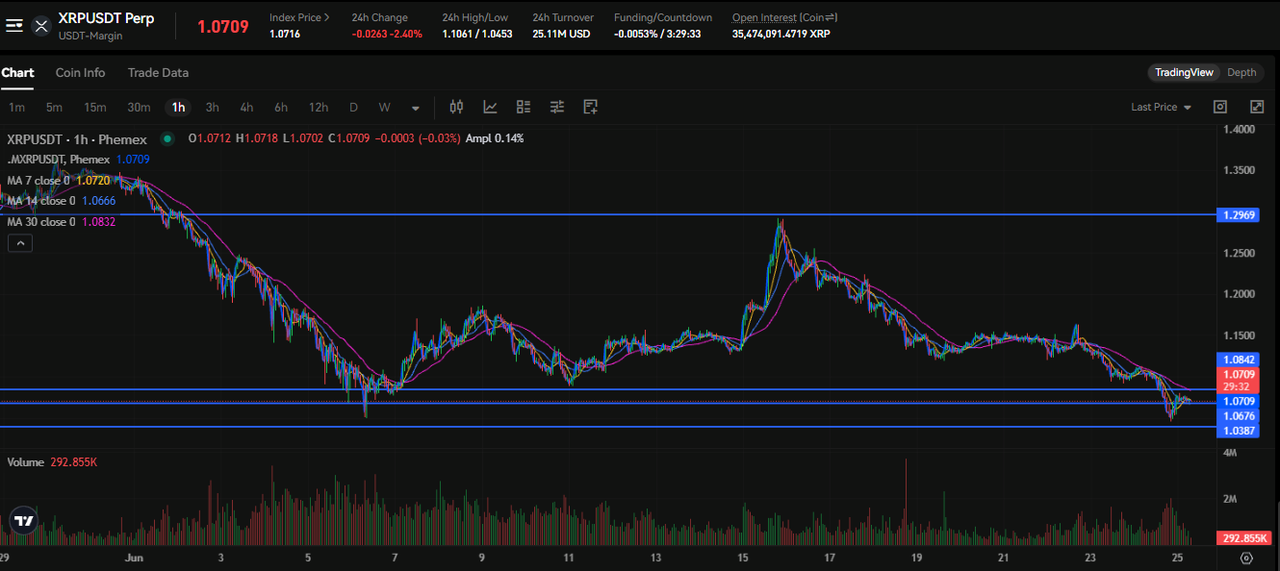
You can cross-check the live figure on the CoinGecko XRP page. The snapshot tells you most of what matters in five lines. XRP is not in free fall, and it is not breaking down on token-specific bad news. It is moving with the market, and the $1.04 to $1.10 band is the zone that decides if this is a routine shakeout or the start of something deeper. XRP has spent most of June trading inside a tightening range, and today's slip is a test of the lower half of that range rather than a clean break of it.
The XRP Price Levels That Define the Next Move
The map below frames the current price between the support that has to hold and the resistance that has to break. Use it as a decision grid, not a prediction.
|
Level
|
Price
|
What it means
|
|
Resistance 2
|
$1.14
|
Range high. Reclaiming it flips the structure bullish again.
|
|
Resistance 1
|
$1.10
|
First ceiling. Bulls need a close above this to stop the bleed.
|
|
Current price
|
$1.07
|
Sitting just below the $1.08 pivot, inside the lower range.
|
|
Support 1
|
$1.04
|
The line buyers defended last week. Losing it opens the door lower.
|
|
Support 2
|
$1.00
|
The psychological floor. A flush here would shake out weak hands.
|
The structure is simple to read. As long as XRP holds $1.04 on a closing basis, the broad range from $1.04 to $1.14stays intact and today reads as noise inside a bigger consolidation. Lose $1.04 with volume and the next real shelf is the round $1.00 mark, where a lot of stop orders tend to cluster. On the upside, nothing changes for the bulls until XRP reclaims $1.10 and then $1.14. Until then, every bounce is a lower-conviction move inside a market that is still leaning down.
The reason $1.08 matters as a pivot is that it sat roughly in the middle of June's range. Price spent days bouncing off it from both sides, which turns it into the first thing bulls have to take back. Trading back above it would be the earliest sign that today's dip was the bottom of the wobble rather than the start of a leg lower.
What the ETF Inflows Versus Price Drop Actually Tell You
Here is the part most price-only takes miss. XRP fell while money kept flowing into the spot ETFs. That $5.31 millioninflow on June 22 was not a one-off either. It was another day in a seven-week run of net positive flows, which means the institutional bid has been steady through a stretch where the price did almost nothing but chop and fade.
When inflows rise while price falls, it usually means one of two things. Either patient buyers are accumulating into weakness because they are positioning for a longer horizon than this week's chart, or the selling pressure is coming from a different pool entirely. In XRP's case it looks like the second wrapped around the first. The spot selling today is broad-market risk-off, leveraged longs and short-term holders trimming as BTC cracks $61,000, while the ETF desks keep adding on a slower clock. If you want a primer on how to read these flows, the mechanics behind Bitcoin ETF flows apply almost identically to the XRP products.
This divergence does not guarantee a bounce. Accumulation can persist for weeks while price keeps grinding lower, and a steady $5 million a day is meaningful but not a wall of capital that stops a market-wide flush on its own. What it does tell you is that the dip is not being driven by institutions abandoning XRP. The smart-money flow is going the other way. That is the kind of backdrop where support levels have a better chance of holding than they would if ETFs were bleeding out alongside the price. For deeper context on XRP's June setup, the broader XRP price picture for June 2026 covers the escrow, regulatory, and ETF threads feeding into today's chart.
What Bulls Need to Reclaim From Here
For the buy side, the to-do list is short and specific. The first job is a daily close back above $1.08, which would prove the slip below it was a wick and not a level change. After that, $1.10 is the line that flips the near-term momentum, because it caps the small range XRP has been stuck under since the start of the week. Take $1.10 with rising volume and $1.14 comes into play fast, since there is not much resistance in between.
Reclaiming $1.14 is the real prize. That is the top of June's range, and a close above it would turn the entire month of chop into a base rather than a top. At that point the conversation shifts from defending support to the question of XRP finally breaking out of the range it has been trapped in. The steady ETF bid makes that scenario more plausible than the current price action alone suggests, because the supply absorbed during this consolidation tends to fuel the move once sentiment turns.
What bulls do not want to see is a failed retest. If XRP rallies back to $1.08 or $1.10, stalls, and rolls over again, that failure usually invites another push toward support. The cleanest bullish tell is a reclaim that holds on a retest, not a sharp spike that fades within hours. Patience beats chasing here. The token has burned plenty of impatient longs in June already.
How the Broad-Market Drag Pulled XRP Lower
None of today's move is really about XRP. The whole market turned defensive, with Bitcoin sliding below $61,000 and the risk-off mood spreading across majors and alts alike. XRP carries a high correlation to BTC on down days, so when Bitcoin cracks a round number and triggers a wave of liquidations, XRP gets sold in sympathy regardless of its own fundamentals. The CoinGlass liquidation data showed the broad flush hitting leveraged longs across majors during the session.
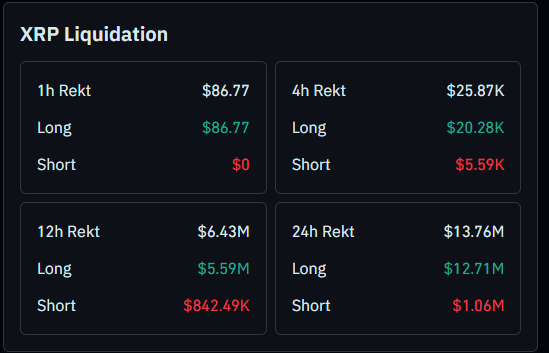
Source: Coinglass
That matters for how you read the 3.03% drop. A market-wide flush is different from a token-specific breakdown. There is no negative XRP headline behind today's candle, no failed catalyst, no fresh legal cloud. The regulatory picture in Europe even improved recently, though that is a separate story from the chart. What you are watching is XRP behaving like a high-beta asset on a day when the whole DeFi and broader crypto complex is leaning down together.
The practical takeaway is that XRP's next move is partly hostage to Bitcoin. If BTC stabilizes above $60,000 and reclaims lost ground, XRP's $1.04 support has a strong chance of holding and the ETF accumulation thesis gets room to work. If Bitcoin keeps sliding, even a steady ETF bid will struggle to hold the line, and $1.00 comes into focus. Watch BTC as the leading indicator and XRP's own levels as the confirmation. The same logic applies to most majors right now, including the stablecoin flows that often spike when traders rotate to the sidelines during a sell-off.
Frequently Asked Questions
Why is XRP down today?
XRP fell about 3% to $1.07 because the entire crypto market turned risk-off, with Bitcoin dropping below $61,000 and dragging most majors lower. There is no XRP-specific bad news behind the move. It is trading like a high-beta asset in a broad sell-off.
Will XRP go back above $1.08?
A daily close back above $1.08 would be the first sign the dip is over, and $1.10 is the next ceiling bulls need to reclaim. The steady ETF inflows give that scenario a reasonable backing, but it depends heavily on Bitcoin stabilizing in the next few sessions.
Why are XRP ETFs seeing inflows while the price falls?
It points to two different pools of capital. ETF desks have been accumulating on a slow, steady clock for seven weeks, while today's selling is coming from leveraged and short-term holders reacting to the market-wide risk-off. Institutions adding while price drops is a constructive sign, not a bearish one.
What is the key support level for XRP right now?
The nearest support is $1.04, the level buyers defended on the last dip. Below that, the round $1.00 mark is the major psychological floor where stop orders tend to cluster. Holding $1.04 keeps the broader range intact.
Bottom Line
XRP at $1.07 is sitting inside a range, not breaking down. Hold $1.04 and the $1.04 to $1.14 consolidation stays alive, with the steady $5.31 million ETF inflow streak quietly building a base under the price. Reclaim $1.08, then $1.10, and the bulls get their first real footing back. Lose $1.04 on a closing basis and the next stop is $1.00, where the market would test how committed the dip buyers really are.
Watch Bitcoin as the lead and XRP's own levels as the confirmation. The institutional bid is still pointing up even while the chart points down, and that divergence usually resolves in the buyers' favor when the broad market stops bleeding. The level that decides everything is $1.04. Defend it and this was noise. Lose it and the next chapter is lower.
This article is for informational purposes only and does not constitute financial or investment advice. Cryptocurrency trading involves substantial risk. Always conduct your own research before making trading decisions.