Technology remains the heartbeat of the 2026 global economy, but this morning, that pulse is racing with unusual intensity. As Tesla (TSLA) faces a sharp technical pivot and NVIDIA (NVDA) tests the limits of its $4.38 trillion valuation, the 'Trillion Dollar Club' has become the epicenter of high-stakes volatility. For Phemex traders, the wall between digital assets and traditional equities has effectively disappeared—today’s market isn't just about watching the numbers; it’s about navigating the bridge where crypto liquidity meets Nasdaq momentum.
For Phemex users, this environment necessitates a sophisticated approach to portfolio management. With NVIDIA (NVDA) maintaining a significant $4.38 trillion market cap despite a 1.3% intraday dip, and Tesla (TSLA) facing technical resistance, the integration of crypto-liquidity with traditional equity movements remains a focal point for those utilizing the Phemex TradFi infrastructure.
Bridge your crypto to the Nasdaq: Trade TSLA and NVDA with USDT on Phemex TradFi today
The Market Snapshot: Analyzing Sector Divergence
According to the latest market overview, the "Magnificent 7" and semiconductor leaders are exhibiting signs of cooling after recent rallies.
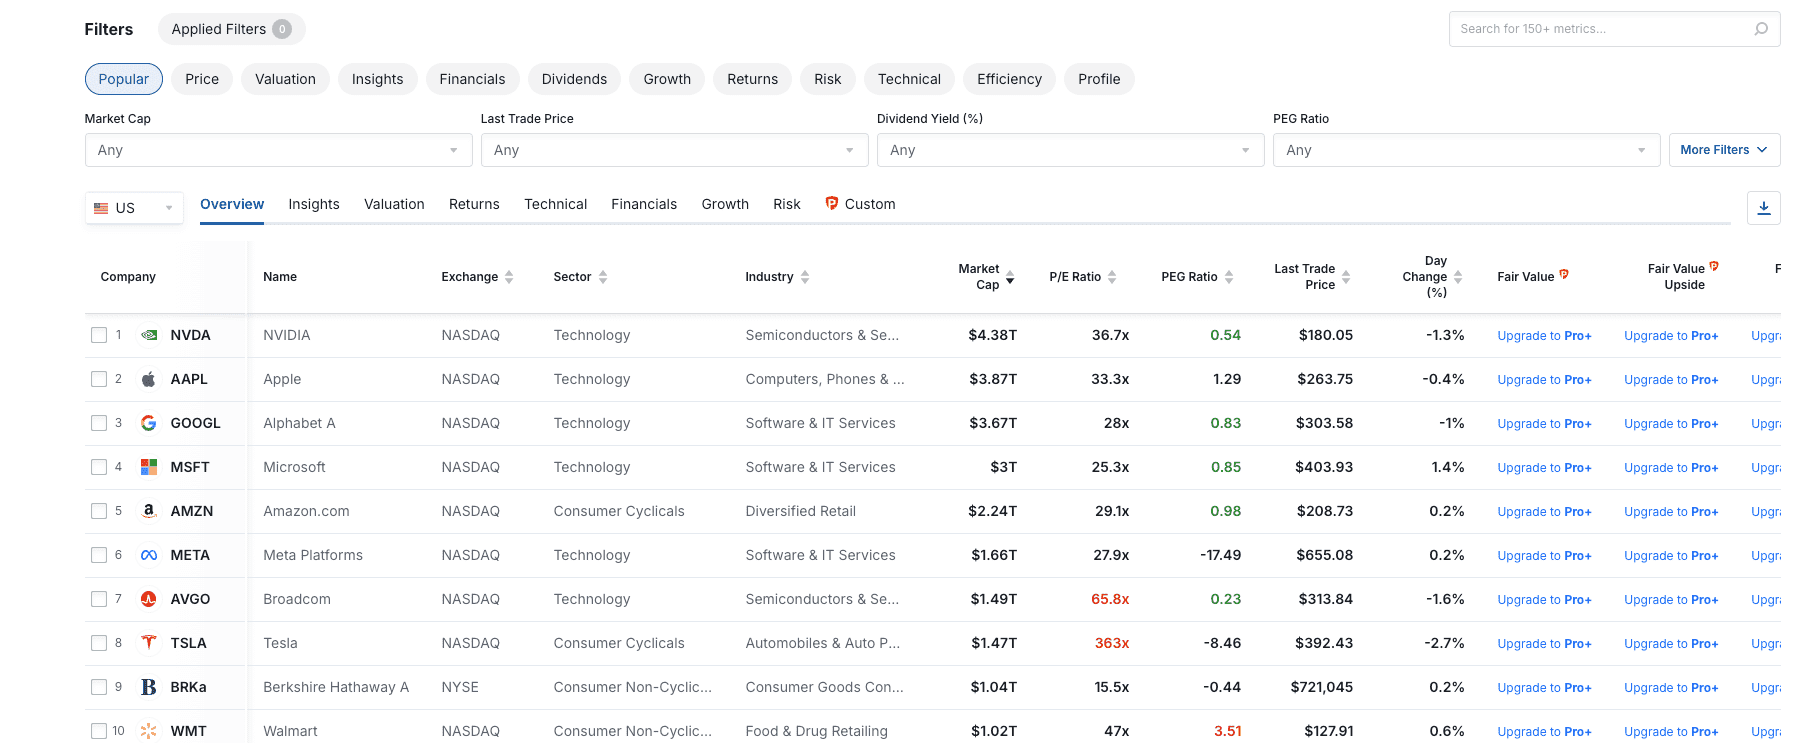
Source: Investing.com
The Heavyweights: NVDA, AAPL, and GOOGL
NVIDIA (NVDA): Currently trading at $180.05, down 1.3%. Despite the correction, its dominance is reflected in a $4.38T market cap. The 0.54 PEG ratio remains a key metric for analysts evaluating its growth-to-valuation alignment.
Apple (AAPL) & Alphabet (GOOGL): Both are tracking broader Nasdaq weakness, down 0.4% and 1.0% respectively.
The Microsoft (MSFT) Exception: Amidst the tech consolidation, Microsoft is showing relative strength, up 1.4% at $403.93. This divergence often indicates institutional capital seeking stability within the technology sector during high-beta sell-offs.
Tesla (TSLA) Momentum: Examining the Bearish Pivot
Tesla is currently the primary outlier for the day. The stock closed at $392.43, representing a 2.70% decline.
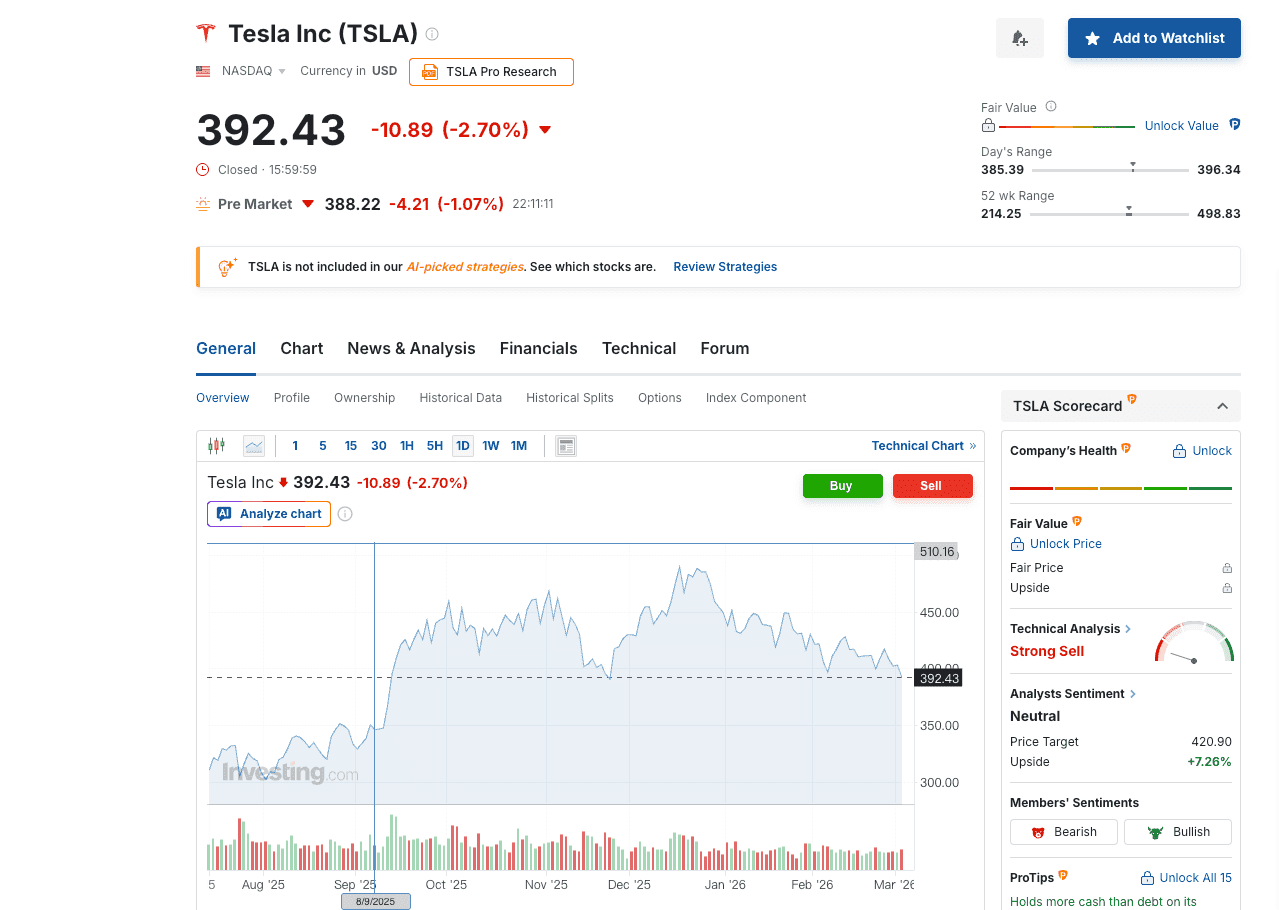
Source: Investing.com
Pre-Market Activity: Data indicates continued downward pressure, with TSLA sliding an additional 1.07% to $388.22 in extended trading.
Valuation Metrics: Tesla’s P/E ratio is recorded at 363x, with a negative PEG ratio of -8.46. These metrics suggest a highly sensitive pricing environment, which has triggered "Strong Sell" signals across several technical screening models.
Deep Dive: Tesla’s Technical Structure
For those monitoring the TSLA chart on Phemex, the current technical setup provides a case study in trend exhaustion.
The "Strong Sell" Indicator
Technical analysis gauges have moved firmly into the "Strong Sell" zone. The stock is currently testing the lower bound of its day range ($385.39 - $396.34) and is trading significantly below its 52-week high of $498.83.Support and Resistance Levels
Price action shows a rejection from the $450 - $500 zone established in late 2025. Market participants are now closely watching psychological support at $380. A failure to hold the $388 pre-market level may lead to a test of the $350 liquidity zone.Analyst Sentiment vs. Technical Reality
An interesting divergence exists: while technicals signal immediate pressure, the aggregate analyst price target remains at $420.90 (a +7.26% theoretical upside). This gap between short-term technical indicators and medium-term sentiment often drives intraday volatility.
Phemex TradFi: Managing Equity Exposure with Crypto
Phemex TradFi infrastructure allows users to address these market movements by utilizing USDT or BTC holdings as collateral. This provides a bridge for those looking to manage stock market exposure without exiting the digital asset ecosystem.
Platform Features for Navigating Volatility:
Accessing Downward Movements: Traditional brokerage accounts often involve complex barriers to short-selling. Phemex TradFi simplifies the technical process for those seeking exposure to downward trends, such as the current TSLA market correction.
Capital Efficiency: Leveraged contracts on Phemex allow for the management of stock volatility with optimized capital allocation. Note: Leverage increases both potential returns and potential losses.
Zero-Delay Deployment: Market gaps often happen in minutes. By using crypto as collateral, users can react to pre-market shifts (like Tesla’s 1.07% drop) without waiting for traditional bank settlement cycles.
Cross-Asset Hedging: If a portfolio is heavily weighted in tech-correlated "AI-coins", utilizing NVDA or TSLA contracts can serve as a strategic tool to hedge against tech-sector systematic risk.
Market Scenarios: The March 4 Outlook
The following are analytical scenarios and do not constitute investment advice.
Scenario A: The Momentum Continuity
Indicator: A break below the $385 support level during the opening session.
Observation: This would confirm the "Strong Sell" technical sentiment and may lead traders to favor short-side exposure.
Scenario B: The Relative Strength Rotation
Indicator: MSFT maintaining its +1.4% gain while the Nasdaq remains flat.
Observation: This 'flight to quality' might suggest that capital is concentrating in lower-PE tech giants during the TSLA correction.
Scenario C: Mean Reversion Scalp
Indicator: NVDA testing its $175 support followed by a high-volume bounce.
Observation: A recovery in the $4.38T "anchor" stock could provide a relief rally for the broader semiconductor sector.
The Macro Outlook: Semiconductors and Valuation Realities
The current P/E multiples—363x for Tesla and 36.7x for NVIDIA—reflect a high-growth environment that remains sensitive to interest rate expectations and earnings quality. As of March 2026, the S&P 500's performance is deeply tethered to AI implementation. When the $4 trillion leader (NVDA) experiences a dip, the effects are felt across both TradFi and crypto markets.
Final Thoughts
Today’s market data confirms a transition into a "trader’s market," characterized by technical breakdowns and sector rotations. Whether you are analyzing the Tesla "Strong Sell" signal or monitoring Microsoft’s resilience, Phemex TradFi provides the professional tools required to navigate these global shifts.
Explore TSLA, NVDA & MSFT Markets on Phemex TradFi Now
Market Data Summary (March 4, 2026):
TSLA: $392.43 (-2.70%) | Pre-market: $388.22
NVDA: $180.05 (-1.30%) | Market Cap: $4.38T
MSFT: $403.93 (+1.40%) | Trend Outlier
Sentiment: Technical Bearish / High Volatility
Disclaimer: Trading involves significant risk. Leveraged contracts can result in losses that exceed your initial deposit. Digital asset and TradFi contract prices are highly volatile. This content is for informational purposes only and does not constitute financial or investment advice.