

The Market Cap to TVL ratio (MC/TVL) is a simple yet powerful metric for evaluating DeFi projects. It is calculated by dividing a project’s market capitalization by its total value locked (TVL). In essence, this ratio indicates whether a DeFi protocol’s token price is relatively overvalued or undervalued compared to the amount of crypto assets locked in its smart contracts. A higher MC/TVL suggests the token’s market cap is high relative to the value locked (potentially overvalued), whereas a lower ratio implies the token’s price might be low compared to its TVL (potential undervaluation). This indicator has gained popularity as a “crypto equivalent” of traditional financial ratios (similar to a price-to-book ratio) for assessing DeFi fundamentals.
How to Calculate MC/TVL Ratio
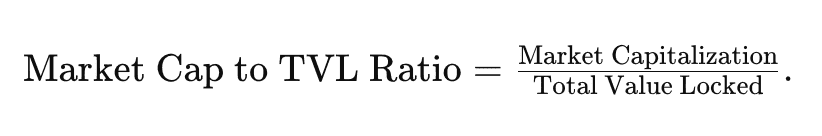
Calculating the Market Cap to TVL ratio is straightforward. Use the formula:
-
Market Capitalization (Market Cap): The total value of all circulating tokens of a project (token price × circulating supply).
-
Total Value Locked (TVL): The total USD value of assets deposited or staked in the project’s smart contracts (liquidity pools, lending vaults, etc.).
For example, if a DeFi protocol has a market cap of $500 million and a TVL of $1 billion, its MC/TVL ratio would be $500M / $1,000M = 0.5. This indicates the project’s market cap is half its locked value – often interpreted as undervalued since the ratio is below 1. Conversely, if the market cap were $2 billion with the same $1 billion TVL, the ratio would be 2.0, suggesting a potentially overvalued token.
Interpretation guidelines:
-
MC/TVL > 1.0: The project’s token is likely overvalued relative to its TVL. Investors should be cautious, as a high ratio (>1) means the market cap exceeds the platform’s locked value, and a price correction could be on the horizon.
-
MC/TVL < 1.0: The project appears undervalued relative to TVL. A ratio under 1.0 means the market cap is less than the locked value, implying the token’s price might have room to grow if the project’s fundamentals are strong.
-
Closer to 0: An extremely low ratio (approaching 0) suggests deep undervaluation. Traders scanning for bargains often seek projects with very low MC/TVL as potential investment candidates. However, extremely low ratios can also occur for newer projects or those with tokens that have yet to catch up to high TVL, so further research is needed.
It’s important to note that context matters. An MC/TVL ratio above 1 doesn’t automatically mean a bad investment, and a low ratio doesn’t guarantee price appreciation. Some reputable projects trade above 1 due to high market confidence or additional revenue streams, while some with low ratios may have other risks. The ratio is best used as an initial filter or comparative tool rather than a definitive valuation method.
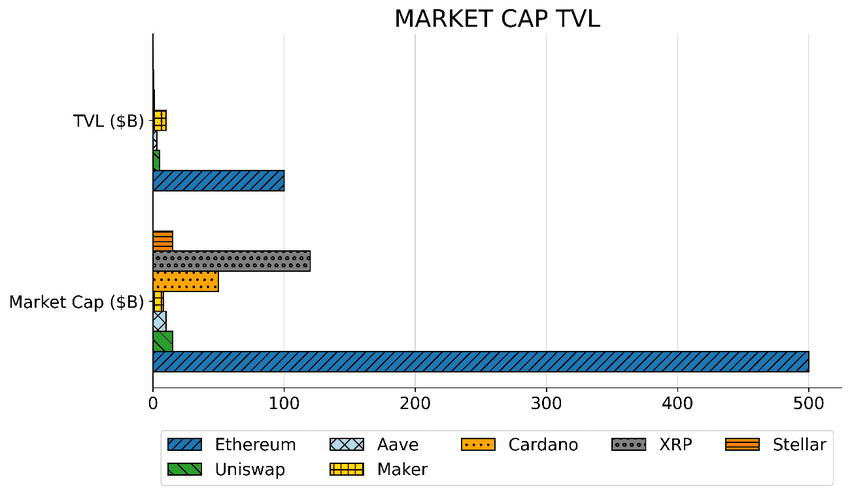
Market Cap TVL of Popular Networks (source)
Why MC/TVL Ratio Matters in DeFi
The MC/TVL ratio has become an underrated yet insightful metric for DeFi investors and analysts. Here’s why it’s useful, especially in the 2025 crypto market:
-
Quick Valuation Filter: DeFi is a fast-moving sector with hundreds of protocols. The MC/TVL ratio helps quickly screen projects. A trader can filter thousands of DeFi protocols to find those most undervalued by focusing on lower ratios. This provides a shortlist for deeper research, saving time in identifying potential opportunities.
-
Investor Sentiment Gauge: The ratio can reflect investor sentiment and hype. A high overall market cap relative to TVL might indicate euphoric sentiment or speculation, whereas a low ratio might indicate caution or underappreciation. For example, during bullish phases, if many DeFi tokens trade at MC/TVL of 3 or 4, it might signal an overheated market. In late 2021, the aggregate DeFi market cap to TVL was around 0.70, suggesting no extreme euphoria at that time.
-
Undervalued Gem Hunting: Projects with exceptionally low MC/TVL (far below 1) could be hidden gems. Investors often interpret a low ratio as a sign the market hasn’t fully valued the project’s locked assets or revenue potential. For instance, if Protocol X has $1 billion TVL but a market cap of $200 million (ratio = 0.2), it might warrant attention as potentially undervalued – provided the TVL is organic and the platform is sound.
-
Overvaluation Warnings: On the flip side, a very high ratio may warn of overvaluation. If a DeFi token’s price has pumped far beyond the growth in its TVL, the ratio will spike above 1. Such divergence could mean the token’s price has outpaced its fundamental usage. Cautious investors may take that as a cue to investigate why – perhaps speculation or upcoming news – and be prepared for a correction if the hype fades.
Why 2025’s market cares: After the boom-and-bust cycles of 2020–2022, the crypto community in 2024–2025 has put greater emphasis on fundamental metrics. TVL itself rebounded sharply in 2024, rising from about $36B in late 2023 to over $100B by mid-2024. By 2025, DeFi TVL climbed back above $170B, indicating renewed capital inflows. With so much value at stake, MC/TVL offers a grounded way to assess if token prices have run too far ahead of actual adoption. It’s particularly relevant as institutional investors increasingly evaluate DeFi projects – they look for metrics like MC/TVL (akin to valuation multiples) to justify investments.
However, the ratio must be used alongside other metrics. DeFi valuation is multifaceted: factors like active users, protocol revenue, and security also matter. TVL can be inflated by short-term incentives, and a low MC/TVL might sometimes reflect underlying concerns (e.g. a token with weak governance or high inflation). Therefore, consider MC/TVL as one piece of the puzzle.
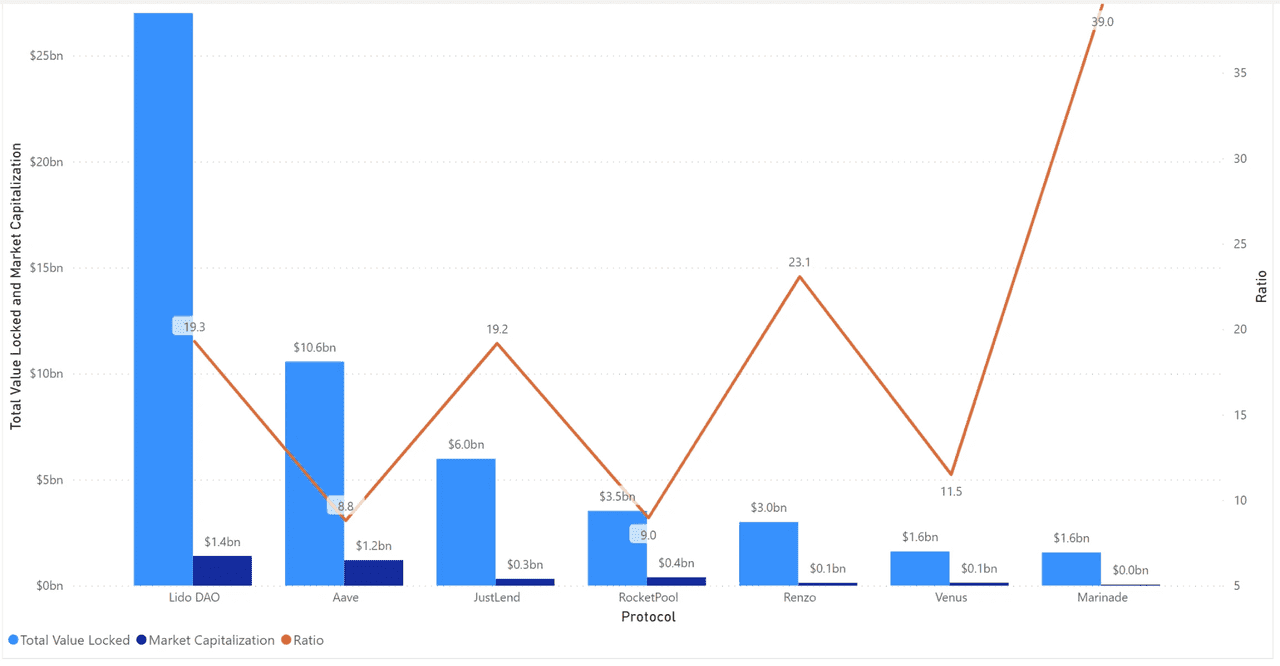
TVL and Market Cap of DeFi Protocols (source)
TVL vs Market Cap: What’s the Difference?
It’s helpful to understand TVL and market cap separately, as they measure different aspects of value:
-
Market Cap – Reflects investor valuation. It’s the price tag the market puts on the project via its token. A high market cap often signals strong market expectations or network effects (like Bitcoin’s large market cap indicating its dominance). But market cap alone can be misleading; it doesn’t tell you how much value is actually being used within the project.
-
Total Value Locked (TVL) – Reflects user engagement and capital in use. TVL measures the actual assets committed to the protocol’s smart contracts – liquidity provided, coins staked, funds loaned, etc. A high TVL indicates many users trust the protocol enough to lock up funds, showing real usage and liquidity. For example, Ethereum’s TVL (across all its DeFi apps) far exceeds Bitcoin’s, because Ethereum powers many DeFi activities.
Neither metric alone is “better”; they provide different lenses. Market cap captures the broad sentiment and potential of a project (including future expectations), while TVL captures current utilization and traction in DeFi. This is why comparing them via the ratio is insightful. In fact, looking at both is crucial. For instance, as of early 2024, Bitcoin’s market cap was enormous (making it the largest crypto), yet its DeFi TVL was tiny; Ethereum had the opposite, with the largest TVL but a lower market cap than Bitcoin. Neither metric alone told the full story of value – Bitcoin’s ratio was astronomically high (~1000+) because most of its value isn’t “locked” in DeFi, whereas Ethereum’s ratio was single digits, reflecting significant on-chain usage.
In DeFi contexts, both market cap and TVL are important. TVL shows how much users have deposited into a protocol (a sign of trust and utility), whereas market cap shows how much investors value the protocol’s token. The MC/TVL ratio essentially bridges these two – marrying market sentiment with on-chain fundamentals. A balanced perspective considers all angles: if one were to look only at market cap, they might miss that Ethereum’s on-chain activity is huge; only at TVL, and they might ignore that Bitcoin’s market narrative grants it high value despite low DeFi usage. Thus, MC/TVL offers a normalized view to compare protocols across different sizes and types.
Examples: MC/TVL Ratios of Major DeFi Protocols (2025)
To illustrate, let’s look at some notable DeFi platforms and their MC/TVL ratios using updated data (approximately mid-to-late 2025):
As of August 2025, for example, major DeFi protocols showed the following values:
|
Protocol
|
Market Cap (USD)
|
TVL (USD)
|
MC/TVL Ratio
|
|
Lido (LDO) – Liquid Staking
|
0.03 (very low)
|
||
|
Aave (AAVE) – Lending/Borrowing
|
0.12 (low)
|
||
|
Spark (SPK) – MakerDAO’s Lending
|
0.018 (extremely low)
|
||
|
Uniswap (UNI) – DEX
|
1.10 (above 1)
|
||
|
Curve (CRV) – Stablecoin DEX
|
0.51 (moderate)
|
Sources: CoinGecko/DeFiLlama data aggregated in August 2025.
Interpretation: Lido’s MC/TVL of ~0.03 is remarkably low – its token market cap is only a few percent of the massive ~$38B staked via Lido. This suggests Lido’s token (LDO) was largely undervalued relative to the protocol’s dominance in ETH staking (indeed, Lido leads with the highest DeFi TVL). Aave also has a low ratio (~0.12), indicating its token price is modest compared to the ~$38B locked across its lending markets – potentially a value play if one expects Aave’s token to eventually capture more value. Spark (a newer MakerDAO-affiliated lending dApp) is an extreme case: its token’s market cap is almost negligible next to its TVL, possibly reflecting that the platform is viewed more as an extension of Maker/DAI rather than a value-capturing token itself (or that it’s early in gaining market recognition).
Uniswap, on the other hand, has a ratio above 1 (around 1.1). This means Uniswap’s market cap slightly exceeds its ~$6B TVL, suggesting investors price UNI for more than just current liquidity – likely due to its fee revenue potential, governance value, and brand as the top DEX. It’s not uncommon for leading DEX tokens to trade at MC/TVL > 1, because the token may entitle holders to future fee splits or simply because the market expects growth. In fact, back in 2021, Uniswap had an MC/TVL around 2.4 – higher than peers like Aave or PancakeSwap at the time – reflecting premium investor expectations. By 2025, that premium moderated closer to 1, possibly as UNI’s token economics evolved and competition increased.
Curve’s ratio (~0.5) indicates moderate undervaluation; CRV’s market cap is half of the ~$2.7B locked in Curve’s stablecoin pools. This aligns with the narrative that Curve’s TVL has remained strong, but its token price suffered after 2022’s bear market and some liquidity mining inflation. Value-oriented investors might see a sub-1 ratio for a major protocol like Curve as a positive sign – it suggests a lot of locked value that isn’t yet fully reflected in the token’s price. Indeed, analysts often note that Curve and Balancer have been extremely undervalued by MC/TVL metrics in recent years.
Keep in mind these ratios can change rapidly with market conditions. If a token’s price rallies or falls sharply, or if users deposit/withdraw funds en masse (changing the TVL), the ratio moves accordingly. For example, if Uniswap’s token doubled in price without a TVL change, its MC/TVL would jump to ~2.2, potentially making it look overpriced unless TVL also grows.
Using MC/TVL in Investment Strategy
Investors and traders can incorporate the MC/TVL ratio in several ways:
-
Comparing Competitors: When evaluating projects in the same category (e.g., DEXs or lending platforms), MC/TVL helps highlight relative valuation. Suppose DEX A has MC/TVL = 0.5 while DEX B is 1.5. If both have similar growth and usage, DEX A might be a bargain (or DEX B expensive). This doesn’t guarantee an outcome, but it provides a clue. In the past, almost every major network’s DeFi ecosystem looked undervalued by this metric except perhaps one or two outliers like Uniswap, which stood out with a high ratio.
-
Tracking Market Cycles: During bull runs, token prices can outpace growth in TVL, pushing ratios up. In bear markets, TVL may drop as users withdraw funds, sometimes faster than market cap drops, or vice versa. By monitoring the aggregate MC/TVL for the DeFi sector, one can gauge if the sector is entering bubble territory. As noted in one analysis, an aggregate ratio climbing to 3 or 4 might indicate over-exuberance, whereas a very low sector-wide ratio could indicate pessimism or a bottom. As of late 2025, the total DeFi market’s MC/TVL has hovered around 0.8–1.0 (hypothetically), suggesting fairly balanced valuation after the post-2024 resurgence – not as frothy as early 2022, but not rock-bottom either.
-
Spotting Red Flags: If a project’s MC/TVL skyrockets in a short time (say due to token price mooning), it could be a red flag of hype. Conversely, if TVL plunges (due to a hack or users fleeing) and market cap doesn’t adjust, the ratio will jump – another red flag. Always investigate sudden ratio changes: a surging ratio might mean the token price is pumping without fundamental support, whereas a plunging ratio could signal either a buying opportunity or a serious loss of user trust. Use additional research to figure out which.
Caution: The MC/TVL ratio is not a standalone judgment. High or low ratios can have valid reasons:
-
Some protocols naturally have higher ratios because their tokens capture value in ways not directly reflected by TVL. Example: A governance token with fee revenue (like UNI potentially sharing fees) might trade at a premium.
-
A low ratio might reflect that the protocol’s TVL is largely driven by incentives (yield farming rewards) that could be unsustainable – once rewards end, TVL might drop, thus the low token price was justified.
-
Also, watch out for fake or transient TVL. In 2021, there were cases of protocols briefly inflating TVL (e.g., by counting double-staking or offering unsustainably high yields). Investors who blindly bought tokens because of low MC/TVL sometimes got burned when the TVL proved fickle.
In summary, the Market Cap to TVL ratio is a handy compass in the ocean of DeFi, pointing towards potentially undervalued or overvalued territories. In 2025’s matured crypto environment, it remains highly relevant: as DeFi protocols like Lido, Aave, Uniswap, and others continue to grow, MC/TVL gives a snapshot of market expectations versus on-chain reality. Use it to complement your analysis – alongside other indicators like protocol revenue, user counts, and risk factors – for a well-rounded investment decision. As with any metric, context and due diligence are key. A low ratio can highlight an opportunity, but it’s the deep research (what the protocol does, its tokenomics, security audits, etc.) that will confirm if it’s a diamond in the rough or a value trap.