Executive Summary: The Structural Shift in Early 2026
As of February 10, 2026, the cryptocurrency market is navigating a period of significant recalibration. BNB, the native utility token of the BNB Chain ecosystem, is currently trading at 1,400 mark, driven by ecosystem expansion and broader institutional adoption.
The current retracement to the $630 zone is not merely a price dip; it represents a return to a major historical breakout zone established in early 2025. With 24-hour trading volume climbing 4.68% to $1.79 Billion, the market is witnessing a high-velocity exchange between short-term sellers and long-term accumulators. This report provides an exhaustive deep dive into the technical indicators, social psychology, and execution frameworks necessary to navigate this volatility.
1. Technical Deep Dive: Deconstructing the CMC Charts
To understand the current price action, we must analyze the market through two distinct lenses: the immediate intraday volatility and the overarching macro-trend.
The Daily (24h) View: Searching for a Volatility Floor
On the daily timeframe, the price action has been characterized by a sharp "capitulation candle" that tested the psychological and technical floor at $600. However, the subsequent price behavior offers several insights for technical analysts:
Long Lower Wick Analysis: The presence of significant lower wicks on the Feb 9th and Feb 10th candles suggests a "Liquidity Grab." In professional trading terms, this indicates that as BNB entered the $600 - $615 range, it triggered a cluster of institutional limit orders (Buy Walls). This buying pressure was sufficient to reject the lower prices and push the asset back toward the $632 level.
Volume Profile & Seller Exhaustion: A 24-hour volume of $1.79B, while high, shows signs of "Climax Volume." Often, when a price drop is accompanied by a massive spike in volume followed by a price stabilization, it signals that the majority of motivated sellers have already exited their positions, potentially leading to a period of consolidation.
Mean Reversion Potential: The distance between the current price and the 20-day Exponential Moving Average (EMA) has widened significantly. Markets often exhibit a "rubber band" effect, where an overextended move to the downside leads to a mean reversion toward the moving average, currently situated near $740.
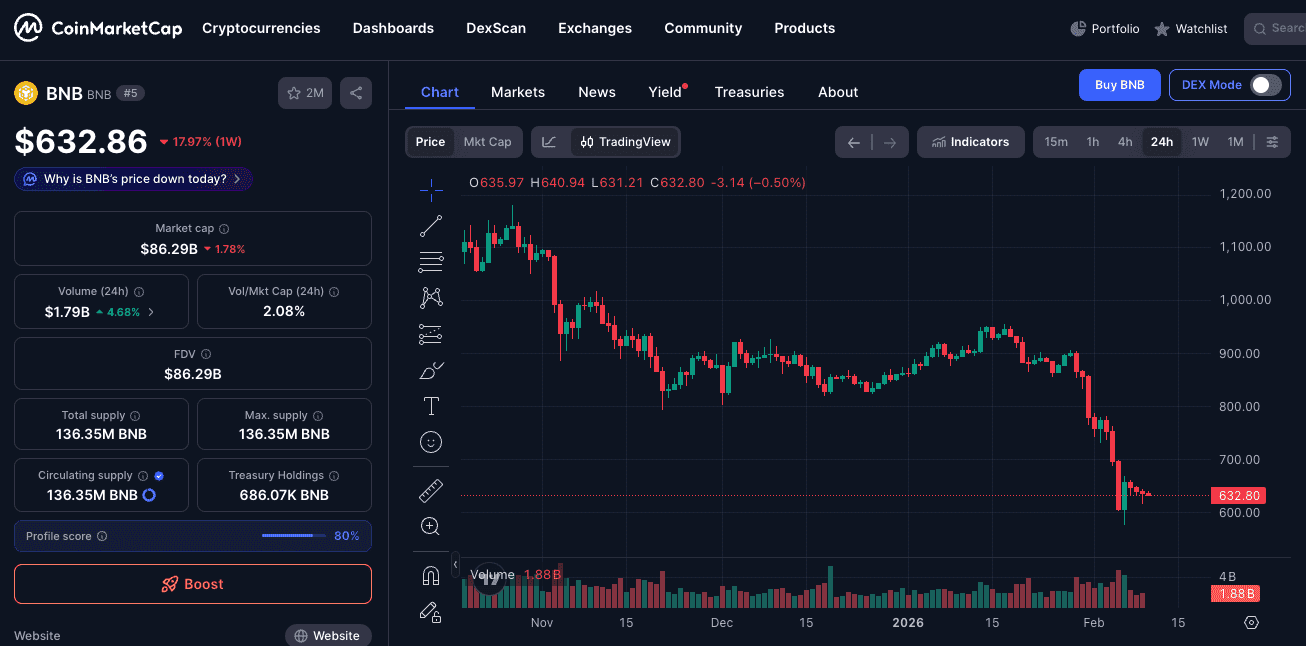
Source:CoinMarketCap
The Weekly (1W) View: The Macro Correction Context
Looking at the weekly chart, the $630 level takes on even greater significance. Following the parabolic run in 2025, a correction was technically overdue to "reset" the market’s overheating indicators.
Historical Support Synchronization: The $630 level served as a formidable resistance throughout the first half of 2025. In accordance with the "Role Reversal" principle of technical analysis, former resistance levels often transform into major support levels during a pullback.
The Fibonacci Retracement: From the 2025 lows to the $1,400 peak, the $630 - $650 zone aligns closely with the 0.618 "Golden Ratio" retracement level. This is a zone where long-term "Value Investors" typically look for entry opportunities, viewing the 17% weekly drop as a healthy deleveraging of the market.
Upside Targets: Should the 800** psychological resistance. Beyond that, the $1,000 mark remains the primary objective for the next cyclical leg.
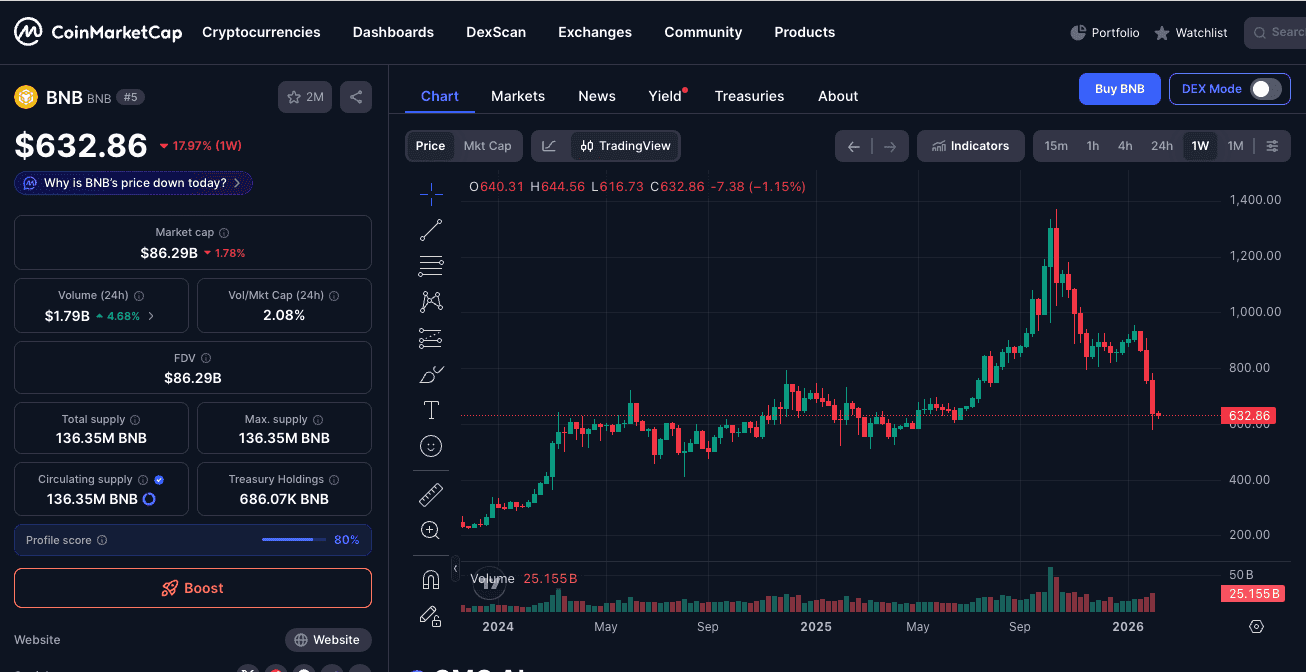
Source:CoinMarketCap
2. Community Pulse: Social Sentiment Trends (Feb 2026)
In the 2026 market landscape, social sentiment on platforms like X (formerly Twitter) and Reddit acts as a leading indicator for retail flow and "whale" activity. The current sentiment is characterized by a "Divide between Technical Speculation and Fundamental Utility."
| Platform | Current Sentiment | Narrative Focus | Market Implications |
| X (Twitter) | Cautiously Bullish | "The [RSI](https://phemex.com/academy/rsi-indicator-crypto-trading) Reset": Analysts are posting screenshots of the Daily RSI hitting 30 (Oversold), suggesting the selling is overextended. | High probability of a "Short Squeeze" if price breaks above $650, forcing bearish traders to cover positions. |
| Reddit (r/Binance) | Utility-Centric | Launchpool & Staking: Focus is on the increased APY for [staking](https://phemex.com/academy/what-is-crypto-staking-on-chain-vs-savings) BNB as the price drops, incentivizing long-term holding. | Provides a "Soft Floor" for the price, as tokens are locked in staking contracts rather than sold on the open market. |
| Reddit (r/CryptoCurrency) | Mixed/Skeptical | Macro Fears: Discussions revolve around the correlation between BNB and Gold/Global interest rates. | Warns of a "Head and Shoulders" pattern; suggests a failed bounce could lead to a test of $450. |
| General Market | Fear | Fear & Greed Index: Currently at 32/100. Historically, "Extreme Fear" has coincided with local market bottoms. | Retail capitulation often provides the necessary liquidity for institutional accumulation. |
Expanding the "BNB Burn" Narrative
A trending topic across all platforms is the Quarterly BNB Burn. In Feb 2026, the community is speculating that the high trading volumes during this 17% crash will lead to one of the largest burns in recent history. Since the burn mechanism is tied to transaction fees and volume, the current volatility inherently accelerates the deflationary nature of BNB, a factor that fundamental analysts believe will provide a "Supply-Side Tailwind" in the coming months.
3. Trading Scenarios for Feb 10: The Phemex Game Plan
Navigating a market at a "Make or Break" point requires a disciplined approach. Below are two structured scenarios based on current price action at $632.86.
Scenario A: The Bullish Reversal (The "Spring" Setup)
This scenario assumes that the $600 - $630 zone will hold as a long-term base.
Entry Strategy: Look for a 4-hour candle close above the VWAP (Volume Weighted Average Price), currently near $645. This confirms that the average buyer in the last session is now in profit.
Technical Confirmation: A "Bullish Divergence" where the price makes a lower low but the RSI makes a higher low.
Primary Target: $710 (Short-term liquidity gap).
Secondary Target: $800 (Mid-term structural resistance).
Stop-Loss Placement: Strictly below $590. A breach of this level would suggest that the support has failed and further downside is imminent.
Scenario B: The Bearish Continuation (The "Flush" Setup)
This scenario assumes that the macro-economic pressure will overwhelm the local support.
Trigger Event: A decisive break below $600 on high volume, followed by a "weak bounce" that fails to reclaim $615.
Target Zones: The next major liquidity clusters sit at 480.
Trading Strategy: For those utilizing futures, a "Short on Retest" strategy would be applicable if $600 turns from support into resistance.
Risk Warning: Shorting at historical support levels carries a high risk of "V-shaped reversals." Ensure trailing stop-losses are utilized.
4. Execution: Leveraging Phemex's Institutional-Grade Infrastructure
To execute these strategies effectively, traders require a platform that offers low latency and robust risk management tools. Phemex provides a comprehensive suite of products tailored for the 2026 market environment.
Spot Trading: Long-Term Position Building
For investors who believe in the 2026 BNB roadmap (including the evolution of Greenfield and OpBNB), the spot market is the most secure way to accumulate.
Zero Funding Risk: Unlike futures, spot positions do not incur daily interest (funding) fees, making them ideal for holding through a multi-week recovery.
Strategic Accumulation: Using the BNB/USDT pair to scale into positions at these $630 "historical value" levels.
Perpetual Futures: Managing Volatility with Precision
For active traders looking to capitalize on the $600 - $710 swing, Phemex’s futures engine offers:
Advanced Order Types: Use "Take Profit/Stop Loss" (TPSL) orders simultaneously upon entry to mitigate the risk of overnight volatility.
Flexible Leverage: Adjust leverage to match your risk tolerance. During periods of high "Fear," keeping leverage below 5x is often recommended to avoid liquidation during "Wick" events.
Copy Trading: Synchronizing with Market Leaders
Unsure about the $630 support? Phemex’s Copy Trading platform allows you to browse the portfolios of top-performing traders who are currently navigating the BNB correction.
Transparency: View the historical "Drawdown" and "Win Rate" of professional traders before committing capital.
Automated Execution: The system automatically mirrors the trades of the pro, ensuring you don't miss the entry if a recovery begins while you are away from your screen.
5. Macro Context: Why 2026 is Different
To understand why the $630 level is being so fiercely contested, we must look at the broader financial landscape of 2026.
Institutional Integration: Unlike the retail-driven cycles of 2017 or 2021, the 2026 market is heavily influenced by Institutional ETFs and corporate treasury allocations. These entities often operate on "Value-at-Risk" (VaR) models, where the $600 - $630 range represents a mathematically significant entry point.
The Gold-Crypto Correlation: As mentioned in the "Community Pulse," BNB has shown an increasing (yet fluctuating) correlation with Gold prices in 2026. As investors seek "Hard Assets" in response to global currency debasement, BNB’s fixed supply and burn mechanism position it as a digital alternative to traditional safe havens.
Ecosystem Maturity: The BNB Chain has evolved beyond simple DeFi. With the maturity of decentralized storage and Layer-2 scaling solutions, the "Intrinsic Value" of the BNB token is supported by actual network utility—not just speculative fervor.
Governance: The evolution of the BNB Chain also brings new governance models, further decentralizing decision-making and enhancing network resilience.
Final Verdict: Is the $630 Support the Local Bottom?
The data from CoinMarketCap and the technical structures on Phemex suggest that BNB is at a critical "inflection point." While the -17.97% weekly drop is daunting for retail sentiment, it has effectively "cleansed" the market of excessive leverage.
The $600 - $630 support zone is backed by:
Historical Price Action from early 2025.
Institutional "Limit Order" Clusters visible via wick analysis.
Fundamental Deflationary Pressure from increased burn rates.
Market participants should remain vigilant. A successful defense of $600 during this "Fear" phase could establish the foundation for a move back toward $800 and beyond in the latter half of Q1 2026. However, disciplined risk management—specifically the use of stop-losses on Phemex—is essential to protect capital in the event of a broader macro-economic downturn.
Watch the $600 level closely. Feb 10, 2026, may well be remembered as the point where the 2026 Q1 correction found its definitive floor.
Disclaimer: Cryptocurrency trading involves high risk and may not be suitable for all investors. The analysis provided in this article is for informational and educational purposes only and does not constitute financial, investment, or legal advice. Phemex is not responsible for any trading losses incurred. Always perform your own due diligence and consult with a professional financial advisor before engaging in market activities. Past performance—including the 2025 bull run—is not a guarantee of future results.