Quick Take: As of March 4, 2026, the digital asset market is experiencing a period of significant price discovery. Bitcoin (BTC) is currently trading around the $67,550 mark, having faced a sharp rejection from the $70,000 resistance zone earlier in the week.
With a 24-hour low of $66,239, the market is actively testing the resilience of mid-term support levels. While geopolitical headlines continue to influence broader “risk-off” sentiment, internal market metrics on Phemex suggest a complex interaction between retail liquidations and institutional absorption.
This briefing provides a data-driven breakdown of the current 4-hour and daily technical setup.
Navigate the volatility—Trade BTC/USDT on Phemex today
Geopolitics and Liquidity: The Market Drivers
The global financial landscape today is characterized by heightened sensitivity to geopolitical developments. As traditional markets react to shifting international tensions, the crypto-asset class is undergoing a liquidity stress test.
The Signal: Correlation and De-leveraging
In the last 24 hours, Bitcoin has exhibited a correlation with traditional risk assets, reacting to a surge in crude oil prices and a strengthening U.S. Dollar Index (DXY). On the Phemex BTC/USDT daily chart, we observe a sustained move below the 30-day Moving Average ($68,096), which has now flipped from support to a primary overhead resistance level. This price action has led to the flushing of over-leveraged long positions, a necessary albeit volatile process for market stabilization.
Technical Deep Dive: Analyzing the Phemex Charts
Based on current Phemex market data, several key technical indicators are guiding the short-term outlook:
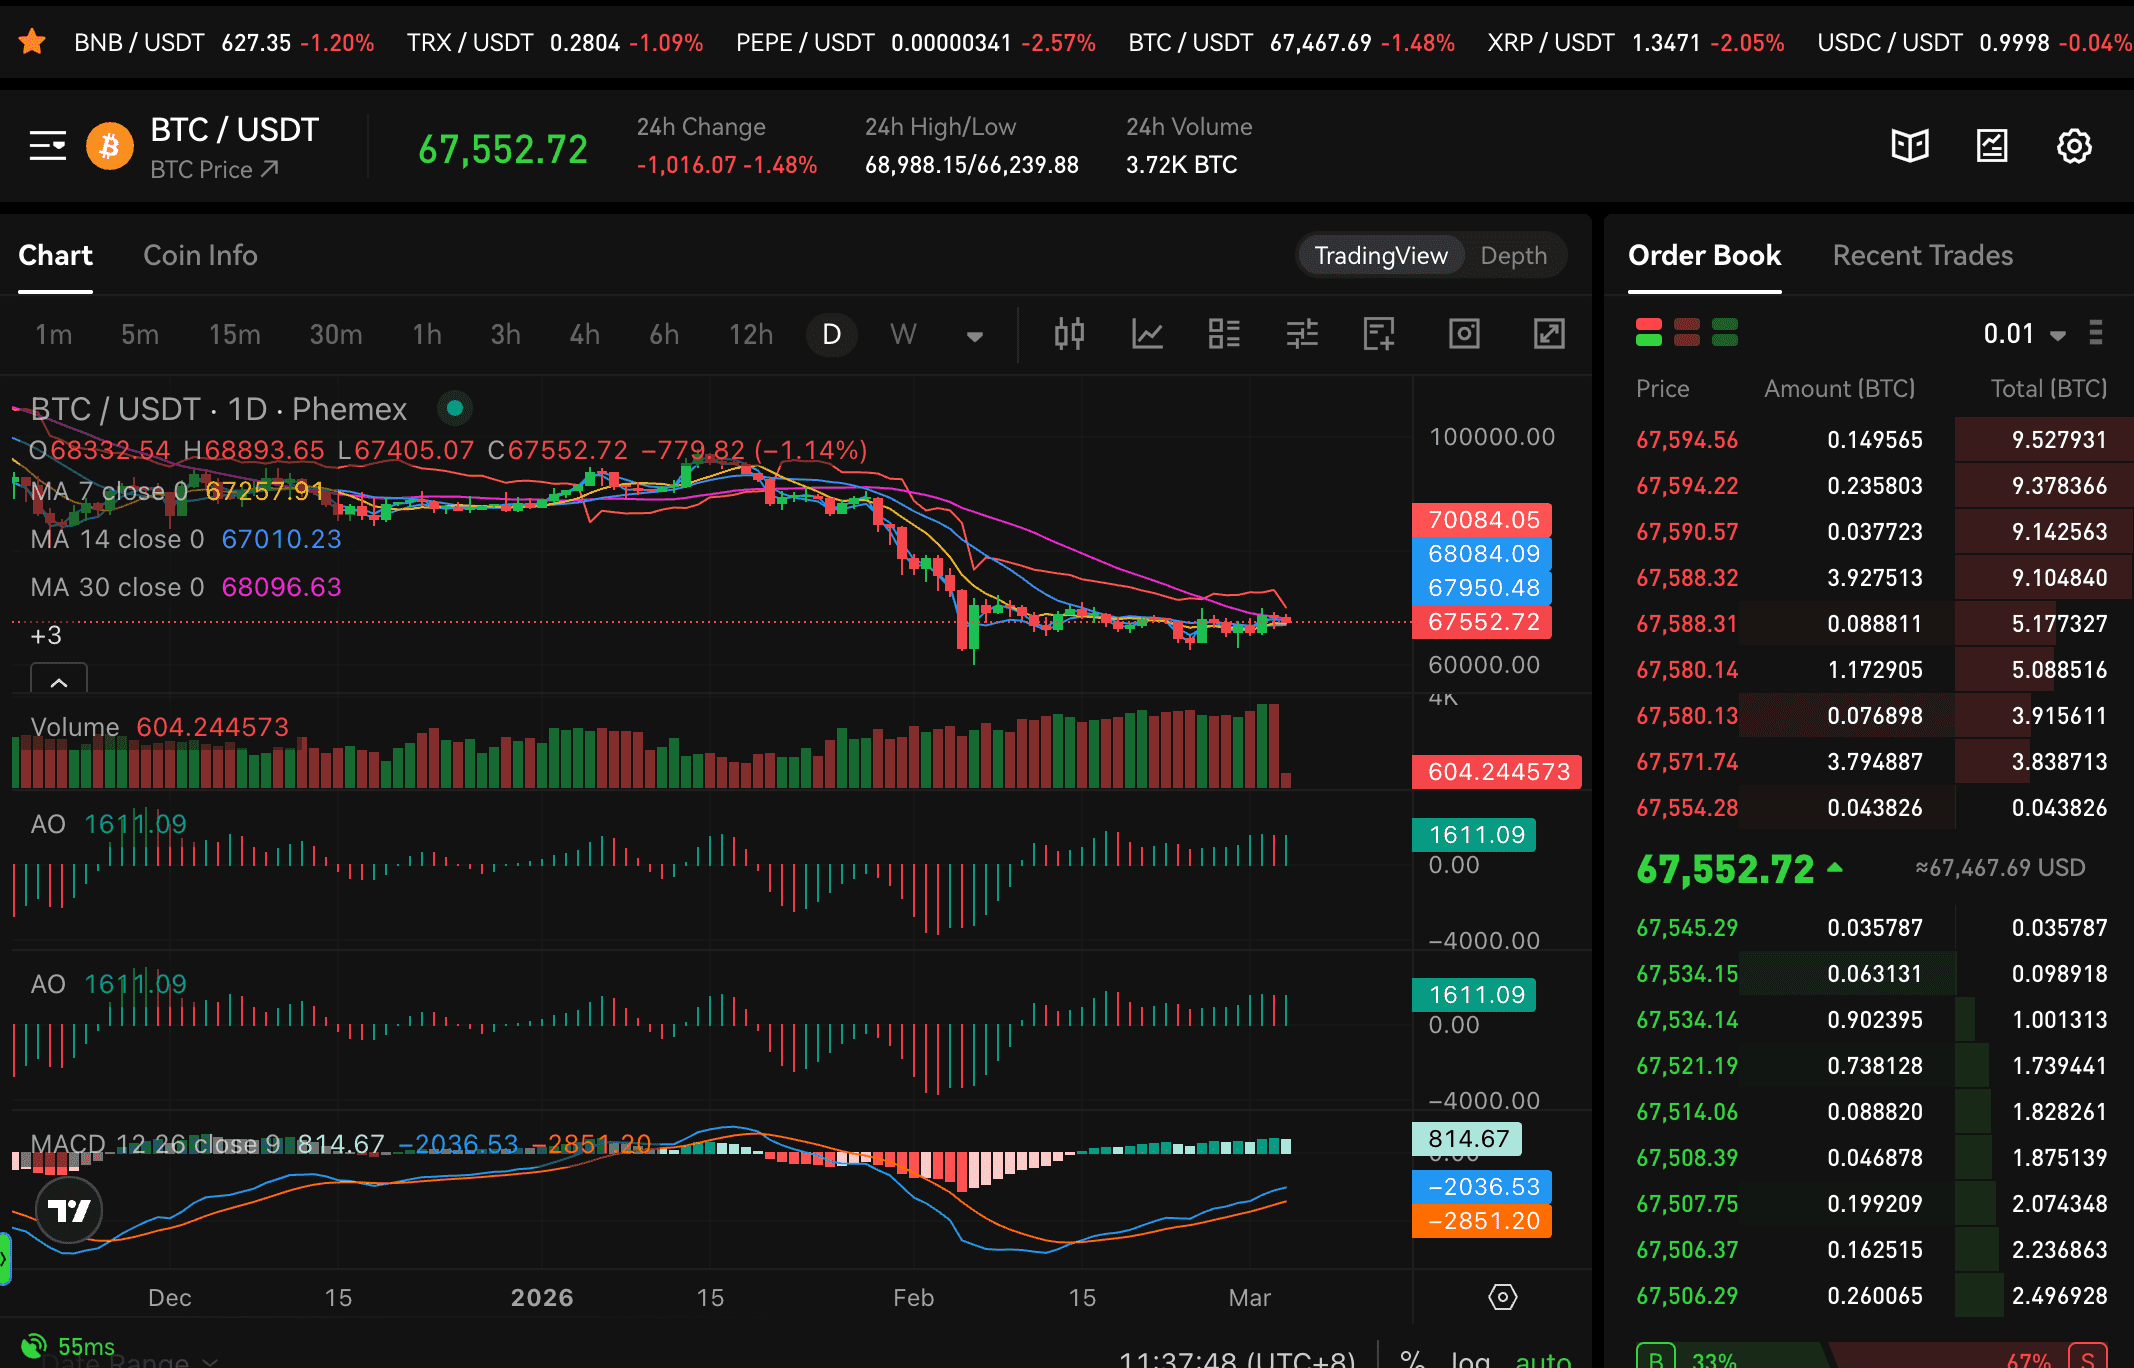
- Moving Averages (MA): The daily chart shows BTC currently hovering just above the MA 7 ($67,257) and MA 14 ($67,010). Maintaining price action above these levels is a prerequisite for a potential relief rally. A daily close below the MA 14 could signal a deeper retest of the $65,000 support zone.
- MACD and Momentum: The MACD (Moving Average Convergence Divergence) remains in negative territory (-2036), indicating that bearish momentum is currently dominant. However, the flattening of the histogram suggests that the intensity of the selling pressure may be stabilizing near current levels.
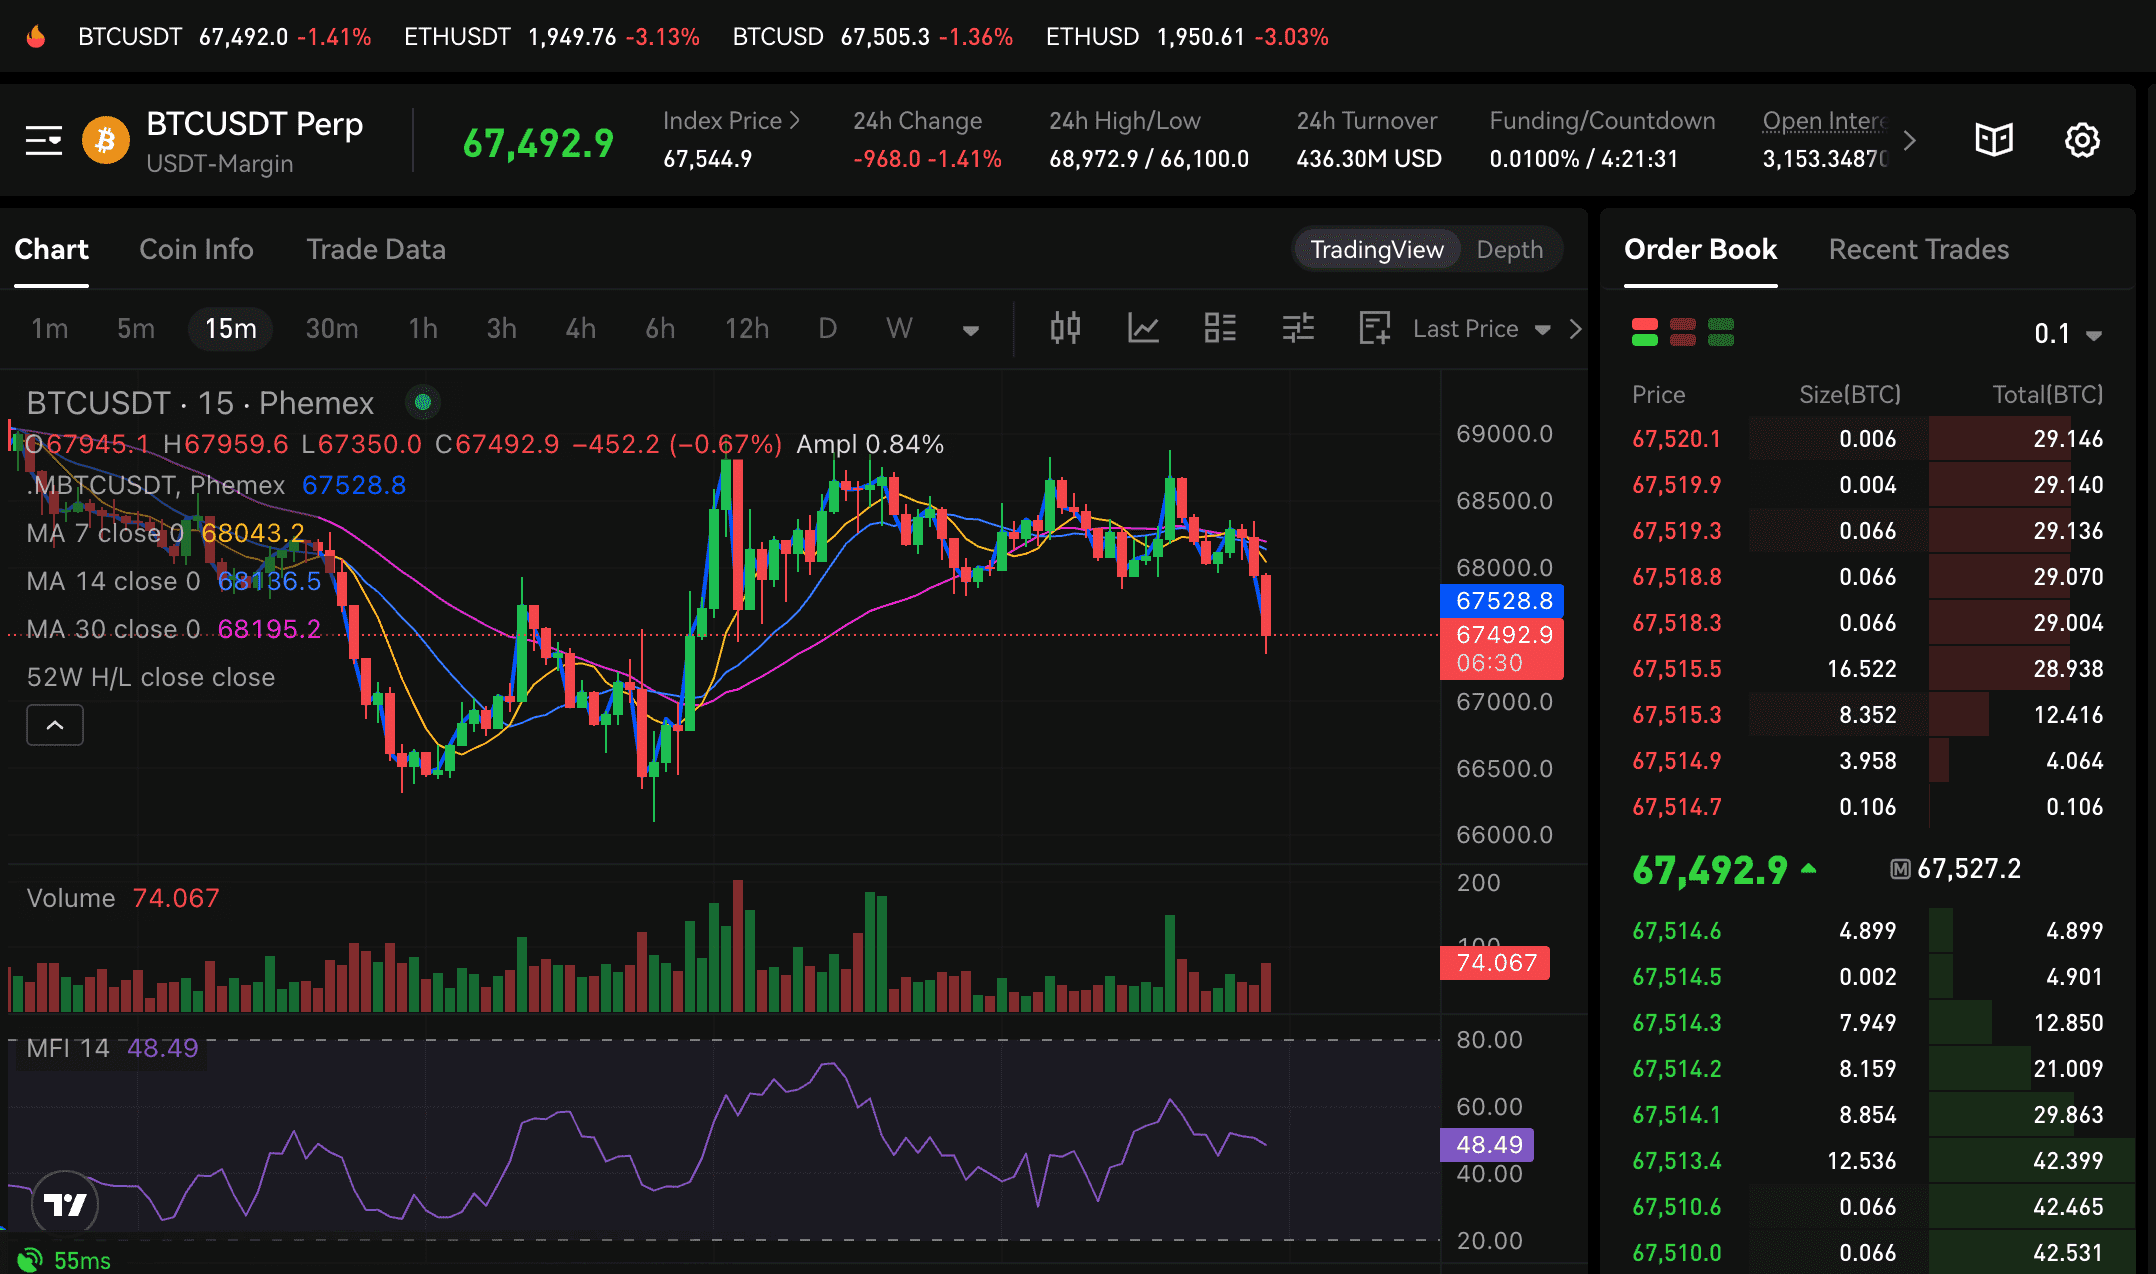
- Money Flow Index (MFI): On the 15-minute Perp chart, the MFI stands at 48.49, a neutral reading that suggests capital flow is currently balanced as traders wait for a clear directional catalyst.
Institutional Flow: The "Smart Money" Observation
Despite the immediate price volatility, institutional metrics provide a counter-narrative. Reports from major Bitcoin ETFs, including BlackRock’s IBIT, show continued net inflows during this dip. This suggests a divergence: while short-term speculators may be exiting positions due to geopolitical fear, long-term institutional holders appear to be utilizing the current price range ($67,000 - $68,000) for strategic accumulation.
Strategic Risk Management on Phemex
The primary concern for traders during periods of high volatility is capital preservation. Understanding the structural dynamics of the $67,500 level is essential for navigating the next 48 hours.
1. Liquidity Clusters and Open Interest
The Phemex BTCUSDT Perpetual contract currently shows a massive Open Interest (OI) of over $3.15 Billion. High OI in a declining market often points to an influx of short positions. While this creates downward pressure, it also sets the stage for a short squeeze if BTC can reclaim the $68,500 level, potentially forcing short-sellers to buy back their positions.
2. Scenario Analysis (Non-Inductive)
Support-Based Scenario (Bullish Thesis):
If BTC successfully defends the MA 7 ($67,257) and stabilizes above $68,000, market participants may look for a mean-reversion move toward the $70,084 resistance level. Such a move would suggest that the geopolitical “risk premium” has been fully priced in.Trend-Follow Scenario (Bearish Thesis):
Should the price fail to hold the $67,000 support, the next high-volume node is located near $65,500. A break below this level would likely trigger further automated deleveraging.
3. Utilizing Phemex Risk Tools
In the 2026 market environment, Phemex provides advanced tools to manage these specific risk management and volatility profiles:
Hedge Mode: Traders holding spot BTC can open short positions in the Perpetual market to offset potential downside without selling their underlying assets.
Funding Rate Arbitrage: With a funding rate of 0.0100%, the cost of carrying long positions remains moderate, suggesting that the market is not currently over-extended in either direction.
Market Participation Framework
Professional desks approach red candles not with panic, but with structured execution. Here is how current setups are being monitored on Phemex:
A. Strategic Accumulation (Spot)
For participants with a multi-quarter horizon, price corrections toward the 200-day moving average are often viewed through the lens of cost-averaging. The focus here is on the fundamental scarcity of Bitcoin post-2024 halving.
Monitoring Zone: $66,500 - $67,500.
Risk Note: Spot trading involves no leverage but is still subject to significant market volatility.
B. Tactical Trend Trading (Futures)
Active traders looking to capitalize on price swings may utilize Phemex’s high-liquidity order books.
Observation: The tight spread in the order book (currently showing significant bids around $67,500) indicates strong local interest.
Caution: Phemex offers up to 100x leverage; however, users must be aware that such high leverage significantly increases the risk of immediate liquidation during "wicks" like the one seen to $66,239.
C. Automated Range Trading (Grid Bots)
Given the neutral MFI and recent consolidation between $66.5k and $69k, grid trading strategies are increasingly popular. By setting buy/sell orders within this established range, traders can capture volatility without needing to predict a major breakout.
The 2026 Macro Lens: Why This Dip Differs
As we navigate the 2026 cycle, Bitcoin’s role as a "Digital Gold" is being rigorously tested. Unlike the early 2020s, the market is now characterized by Institutional Maturity.
The Resilience Thesis:
Bitcoin typically experiences a "Liquidity Shock" during the first 48-72 hours of a geopolitical crisis as capital moves to the U.S. Dollar. However, the subsequent "Inflationary Response"—where central banks may pivot to accommodate economic stability—historically favors capped-supply assets like BTC. The current dip below $68k is viewed by many analysts as the "Shock Phase."
Phemex Ecosystem Insights:
The Phemex Whale Ratio indicates that while retail "Fear & Greed" has dipped to 38/100, larger wallets have not significantly reduced their holdings. On-chain data integrated into Phemex suggests that coins are moving from exchanges to cold storage, a sign of long-term conviction despite short-term price fluctuations.
Outlook for the Next 12-24 Hours
Keep a close watch on these three data points on your Phemex dashboard:
DXY Performance: A reversal in the Dollar Index is often the first signal for a BTC recovery.
Hourly Close vs. MA 7: Reclaiming $67,257 on the hourly chart would provide a tactical "long" signal for intraday traders.
Order Book Depth: Watch for "Buy Walls" appearing near $66,500, which would confirm a local bottom.
Summary for Phemex Traders:
Volatility is the prerequisite for opportunity. Maintain disciplined stop-losses, avoid over-leveraging in uncertain geopolitical climates, and monitor institutional inflow data to separate market noise from structural trends.
Manage your exposure—View real-time Bitcoin market data on Phemex
Disclaimer: Digital asset trading involves substantial risk. Geopolitical events are unpredictable and can lead to rapid capital loss. This content is for informational purposes and does not constitute financial or investment advice. Leverage amplifies both gains and losses. Always conduct your own research (DYOR) and trade within your risk tolerance on Phemex.