

Executive Summary: A Study in Global Market Divergence
As the trading session concludes on March 3, 2026, global financial markets are exhibiting a significant structural bifurcation. The historical correlation of global beta is showing signs of fragmentation. Today's price action across traditional equities, digital assets, and commodities highlights a distinct rotation of capital: liquidity appears to be moving away from structural headwinds in European markets and toward U.S. technological sectors, digital asset proxies, and Bitcoin’s established market structure.
In the Atlantic regions, we observed a period of significant selling pressure. European equities experienced a synchronized downturn, with major indices declining by approximately 2.5%. Conversely, U.S. markets maintained relative stability, supported by a consistent bid in mega-cap technology and domestic small-cap indices.
The primary focal point of today’s market activity remains the intersection of traditional finance (TradFi) and digital assets. Despite a macroeconomic environment characterized by geopolitical complexities and rising implied volatility—evidenced by the VIX surging nearly 8%—Bitcoin moved higher, testing the $68,300 level. This movement suggests a further maturation of the "Digital Gold" thesis, supported by consistent ETF inflows totaling an estimated $207.2 million today. Furthermore, equity proxies with exposure to the crypto ecosystem, such as MicroStrategy, Coinbase, and Circle, demonstrated a tendency to outperform the broader S&P 500.
For the modern multi-asset participant, navigating Q1 2026 requires the ability to analyze the relationships between legacy equity indices, physical commodities, and digital assets. This report analyzes today’s macroeconomic tape, the current sentiment in digital asset markets, and how market participants are observing these volatile trends.
Access zero-fee trading for leading equities and metals within a single, integrated account
Global Equities: Analyzing the Performance Gap Between U.S. and European Markets
To understand the current flow of liquidity into digital assets and technology, it is essential to analyze the performance of legacy systems. The divergence in momentum between the United States and the Eurozone has reached a critical velocity.
European Market Analysis
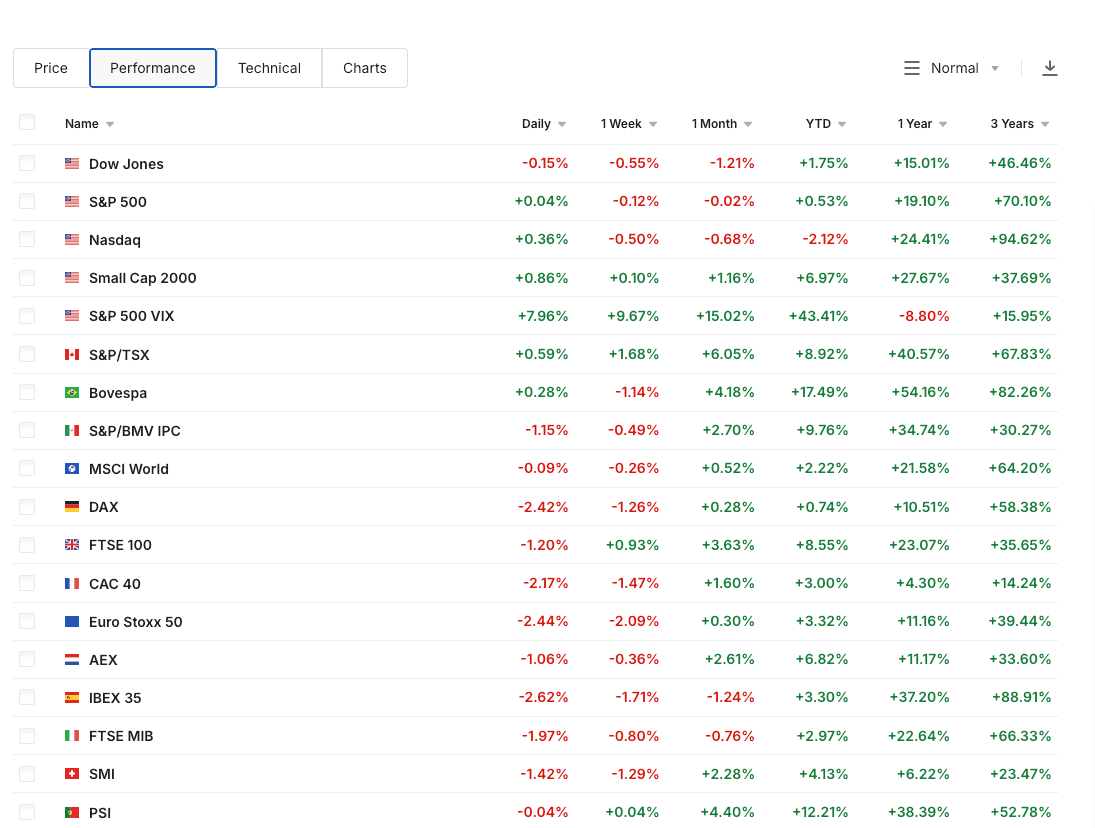
The European session faced substantial headwinds today, highlighting ongoing structural vulnerabilities. The German DAX, a primary industrial indicator for the continent, declined by -2.42% to 24,672.40. The Euro Stoxx 50 followed a similar trajectory, moving lower by -2.44% to 5,988.46. Reliance on consumer and luxury sectors impacted the French CAC 40, which closed down -2.17% at 8,394.32. The downturn extended to the periphery, with the Spanish IBEX 35 recording the most significant percentage loss at -2.62%, and the Italian FTSE MIB retreating by -1.97%.
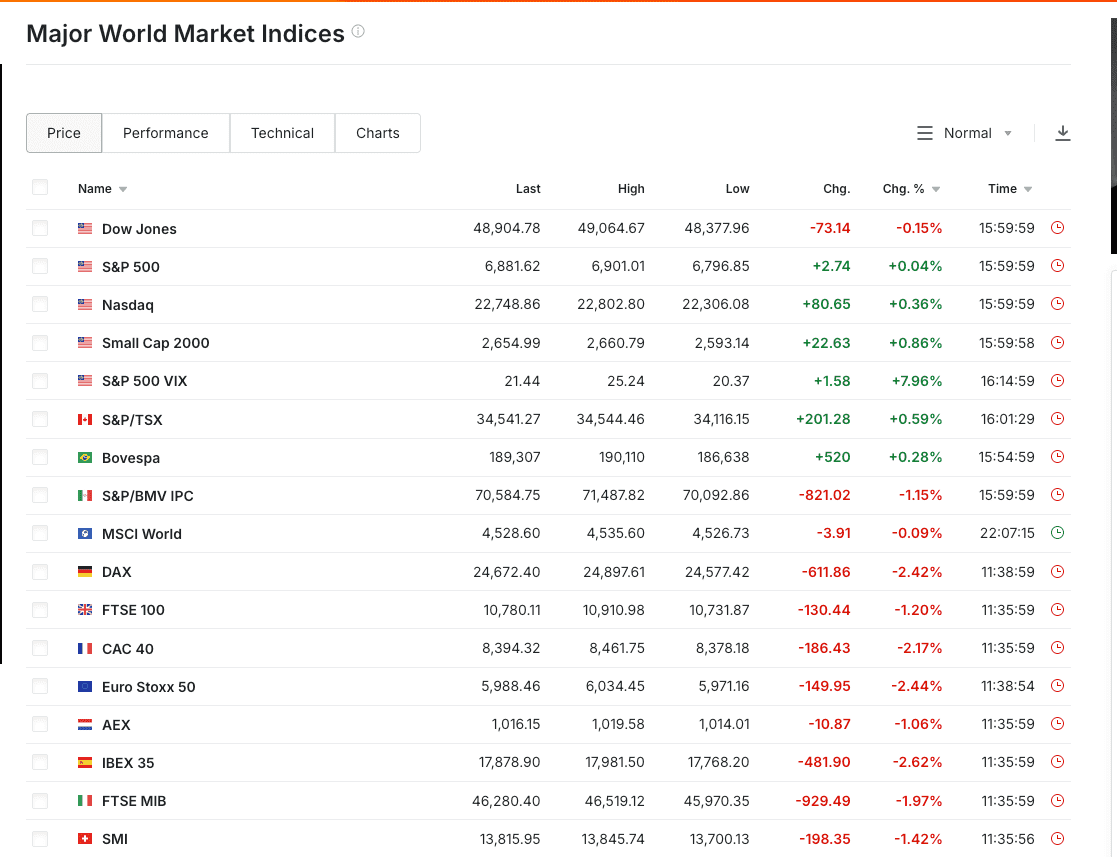
Source:investing.com
The European economy currently faces a complex macroeconomic environment. A strengthening U.S. Dollar Index (+0.20% to 98.53) increases the costs for dollar-denominated energy imports. Simultaneously, a deceleration in manufacturing demand has weighed on industrial output. The European Central Bank (ECB) continues to balance the need for growth with persistent localized inflation, complicating the path for rate adjustments. Today’s synchronized decline likely reflects a market repricing of corporate earnings expectations amidst a cooling global trade environment.
Wall Street Resilience
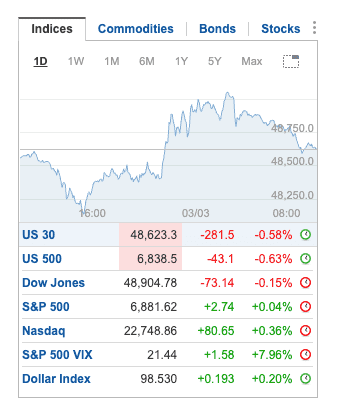
In contrast, U.S. markets displayed relative resilience, acting as a destination for global capital. While the Dow Jones Industrial Average saw a marginal decline of -0.15% to 48,904.78, the broader S&P 500 managed a fractional gain of +0.04% to close at 6,881.62.
Source:investing.com
The technological sector provided much of the momentum, with the Nasdaq Composite climbing +0.36% to settle at 22,748.86. Notably, the U.S. Small Cap 2000 index outperformed significantly, rising +0.86% to 2,654.99. This outperformance in small caps may indicate a "home bias" among domestic investors, as market participants pivot toward companies with less exposure to European manufacturing fluctuations and foreign exchange volatility.
Assessing the Volatility Indicator
While U.S. equity indices remained relatively stable, the CBOE Volatility Index (VIX) provided a cautionary signal, rising +7.96% to close at 21.44. The VIX has seen a year-to-date increase of +43.41%. It is statistically rare to see the S&P 500 remain flat-to-positive while implied volatility increases so sharply. This often indicates a "volatility bid," where institutional participants increase their demand for downside protection via put options. This suggests that while many are retaining their technology and digital asset positions, they are simultaneously seeking to hedge against potential contagion from international market weakness.
Source:investing.com
The Digital Asset Landscape: Interpreting Sentiment Divergence
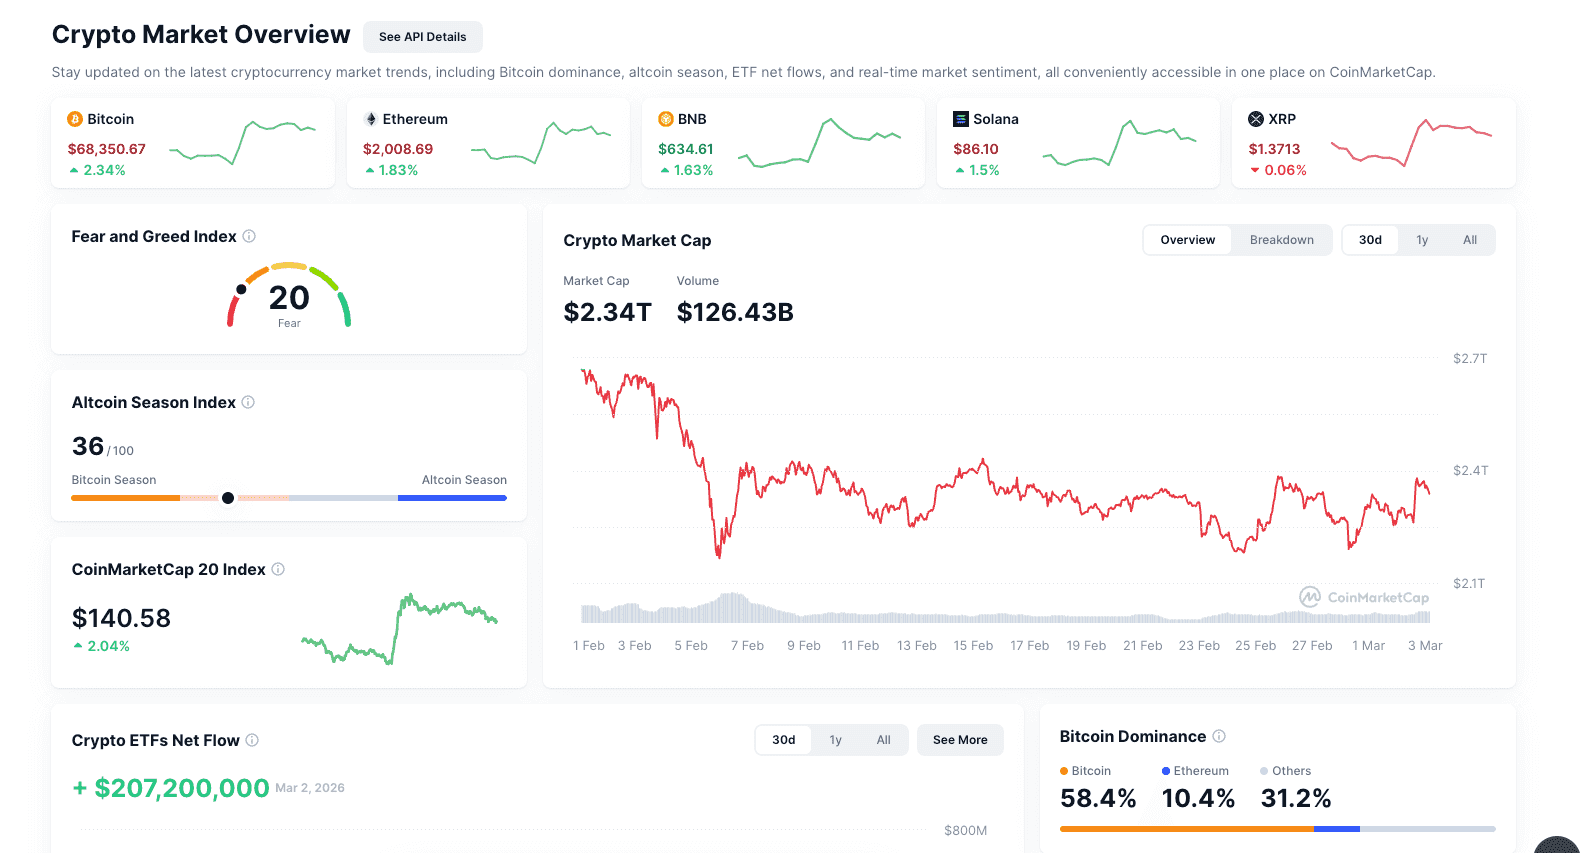
While traditional equities navigated macroeconomic friction, the cryptocurrency market exhibited a notable divergence in performance. The total crypto market capitalization currently stands at approximately 126.43 Billion.
Bitcoin’s Market Performance
Bitcoin (BTC) maintained a leading position today, appreciating by +2.34% to trade at $68,350.67. This price action occurred alongside a unique sentiment backdrop; the Crypto Fear & Greed Index is currently reading 20 (Extreme Fear).
Source:CoinMarketCap
The phenomenon of an asset rising while retail sentiment remains cautious highlights the increasing institutionalization of the asset class. While retail participants may be responding to intra-week volatility or fluctuations in smaller-cap altcoins, institutional activity appears to be driven by systematic flows. The reported net inflows of over $207,200,000 into crypto ETFs today suggest a persistent demand at the institutional level. In this context, Bitcoin may be functioning as a hedge or a "safe-haven" asset for those diversifying away from the volatility seen in European equity markets.
Understanding Bitcoin Dominance
The flight toward established digital assets is further evidenced by Bitcoin Dominance, which currently stands at 58.4%. In comparison, Ethereum (ETH) represents 10.4% of the market, while other assets account for 31.2%.
The Altcoin Season Index, currently at 36/100, suggests we remain in a "Bitcoin-led" phase. Although ETH saw a gain of +1.83% to reach $2,008.69 and Solana (SOL) rose +1.5% to $86.10, the majority of capital velocity is currently directed toward BTC. Historically, during periods of macro uncertainty and elevated VIX levels, market participants often consolidate their holdings into assets with higher liquidity and established track records. Analysts often suggest that until Bitcoin dominance shifts below the 50% threshold, individual asset rallies may be viewed as tactical rather than a broader structural trend.
The Phemex TradFi Perspective: Equities and Integration
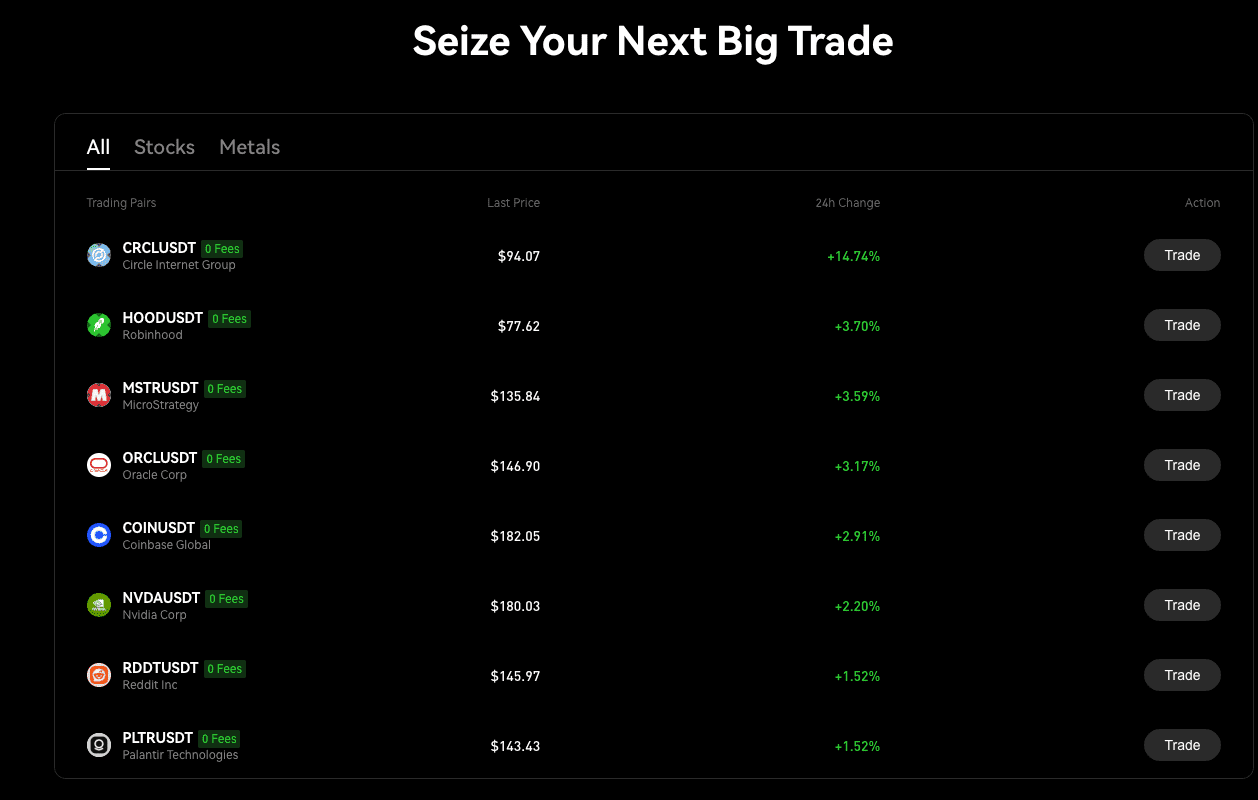
Some of the most significant price movements today were observed in "bridge" assets—publicly traded companies that provide infrastructure for the digital economy and artificial intelligence. Data from the Phemex TradFi interface highlights the performance of these specific sectors.
Performance of Crypto-Linked Equities
While Bitcoin appreciated by over 2%, several crypto-correlated equities experienced even higher volatility:
Circle Internet Group (CRCL): Recorded a significant +14.74% movement today, reaching $94.07. As digital stablecoins become more integrated into global settlements, the market appears to be evaluating the company's treasury operations and market position.
MicroStrategy (MSTR): Increased +3.59% to $135.84, continuing its trend of tracking Bitcoin’s price movements with heightened sensitivity.
Robinhood (HOOD) & Coinbase (COIN): Rose by +3.70% (181.68) respectively, as trading volumes across the sector remained robust.
AI Infrastructure Resilience
Despite some weakness in broader big-tech names like Alphabet (-1.68%) and Amazon (-0.77%), infrastructure-focused companies remained resilient.
NVIDIA (NVDA): Rose +2.22% to $180.03. Sustained capital expenditure into data center infrastructure continues to be a primary driver for the sector.
Palantir (PLTR) & Oracle (ORCL): Gained +1.52% (146.90) respectively, suggesting that software companies with enterprise and defense contracts are being viewed by some as defensive options within the tech space.
Commodities and Hard Money: Analyzing the $5,300 Gold Level
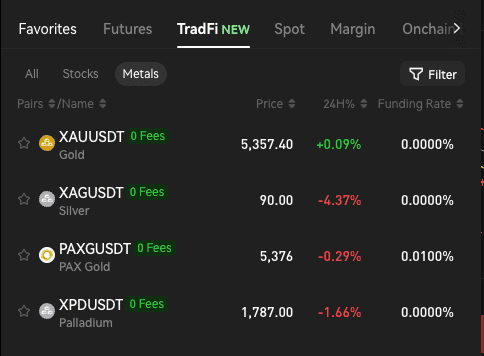
The commodities market continues to serve as an indicator for broader currency and debt sentiment. On the Phemex TradFi metals dashboard, Gold (XAUUSDT) remained stable with a slight upward bias (+0.09%), trading at 5,376.
The fact that Gold is maintaining levels above $5,350 while the U.S. Dollar Index remains strong (98.53) is a rare occurrence. This may suggest that a segment of the market is seeking non-sovereign bearer assets as a hedge against global fiscal conditions.
In contrast, industrial metals faced significant downward pressure, aligning with the slowdown in European manufacturing. Silver (XAGUSDT) declined by -4.37% to $90.00, and Palladium (XPDUSDT) fell -1.66% to $1,787.00. Because these metals have extensive industrial applications, their price action today may provide a more accurate reflection of the current contraction in global manufacturing compared to the "monetary" performance of Gold and Bitcoin.
Market Outlook: Strategic Considerations for Q1 2026
Looking ahead, the divergence between regions and asset classes creates a complex environment that requires a disciplined approach to risk management.
Monitor Asset Dominance: With BTC dominance at 58.4%, market concentration remains high. Participants often wait for a shift in this dominance before increasing exposure to higher-risk altcoins.
Evaluate Regional Spreads: The continued divergence between the DAX and U.S. tech indices suggests that regional economic conditions are a primary driver of equity performance.
VIX Thresholds: A VIX reading above 21 indicates an elevated risk environment. If volatility exceeds the 25 level, it could trigger automated risk-reduction across institutional portfolios.
The Convergence of Traditional and Digital Finance
The data from today’s session illustrates a fragmented landscape: flat U.S. indices, a 2.5% drop in Europe, a 2.3% rise in Bitcoin, and a 4.3% decline in Silver. In such an environment, the ability to manage various asset classes efficiently is a significant factor.
Managing Bitcoin on a crypto-native platform while maintaining equity positions on a legacy brokerage can lead to inefficiencies, such as delayed settlement times and fragmented collateral. During periods of high volatility, the speed of capital movement is essential.
This is the core rationale behind the Phemex TradFi integration. We have developed a unified environment designed for the 2026 macroeconomic landscape, allowing users to monitor and manage Stocks, Metals, and Cryptocurrencies through a streamlined interface.
Cost Efficiency: Phemex TradFi offers zero-fee trading on selected high-interest pairs such as NVDA, HOOD, MSTR, and XAUUSDT, helping to reduce the friction often associated with traditional brokerage services.
Unified Collateral Management: Our platform allows participants to quickly pivot between different sectors. For example, if a user identifies weakness in industrial metals and relative strength in digital assets, they can reallocate their USDT collateral across these different markets within milliseconds.
Risk Mitigation Tools: Phemex TradFi provides the ability to use digital assets as a foundation to access hedges in legacy indices or "hard money" assets like tokenized Gold (PAXGUSDT), assisting in the management of overall portfolio volatility.
The financial environment of 2026 is increasingly characterized by the erosion of boundaries between traditional and digital markets. Phemex TradFi is designed to provide the tools necessary for participants to navigate this convergence with greater efficiency and precision.
Explore the future of unified trading with Phemex TradFi’s multi-asset interface
Disclaimer: Trading in financial markets involves significant risk. This content is for informational and educational purposes only and does not constitute financial or investment advice. Always conduct your own research or consult with a qualified professional before making any financial decisions. Past performance is not indicative of future results.