Bitcoin (BTC) Live Update: Assessing the Resistance Rejection (March 3, 2026)
The cryptocurrency market is currently navigating a period of significant price discovery.
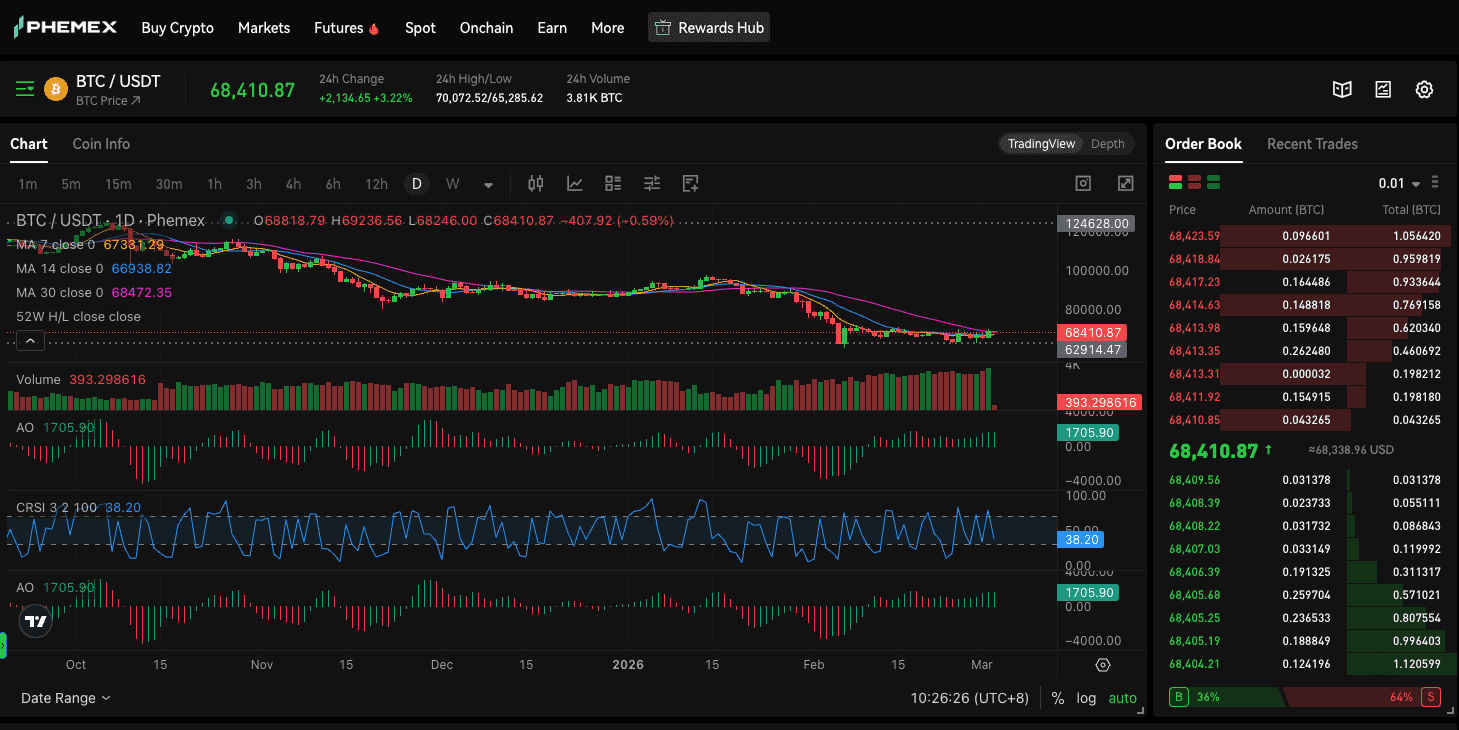
As of 02:34 AM (UTC) on March 3, 2026, Bitcoin (BTC) is trading at $68,445, attempting to establish a stable support base after encountering a decisive rejection at the $70,000 psychological resistance level.
Earlier in the session, BTC staged an upward move that saw the price touch a 24-hour high of $70,072.8. However, this momentum was short-lived as sell-side volume increased.
On the daily chart, this price action has left a notable upper wick, which technical analysts often interpret as a sign of overhead supply concentration.
While the 24-hour change remains positive (+3.25%), the intraday trajectory suggests a shift toward consolidation. The rejection at $70k confirms that the "supply wall" at this threshold remains a formidable technical hurdle for market participants.
In today’s Phemex Daily Pulse, we examine the technical indicators, derivative data, and market structures to help you navigate this current volatility.
Market Strategy Dashboard
| Metric | Value | Significance |
| Current Price | $68,445 | Hovering near the MA 30 Support |
| 24h High | $70,072.8 | Primary Resistance Level |
| Pivot Point | $68,472 | MA 30 (Critical Trend Indicator) |
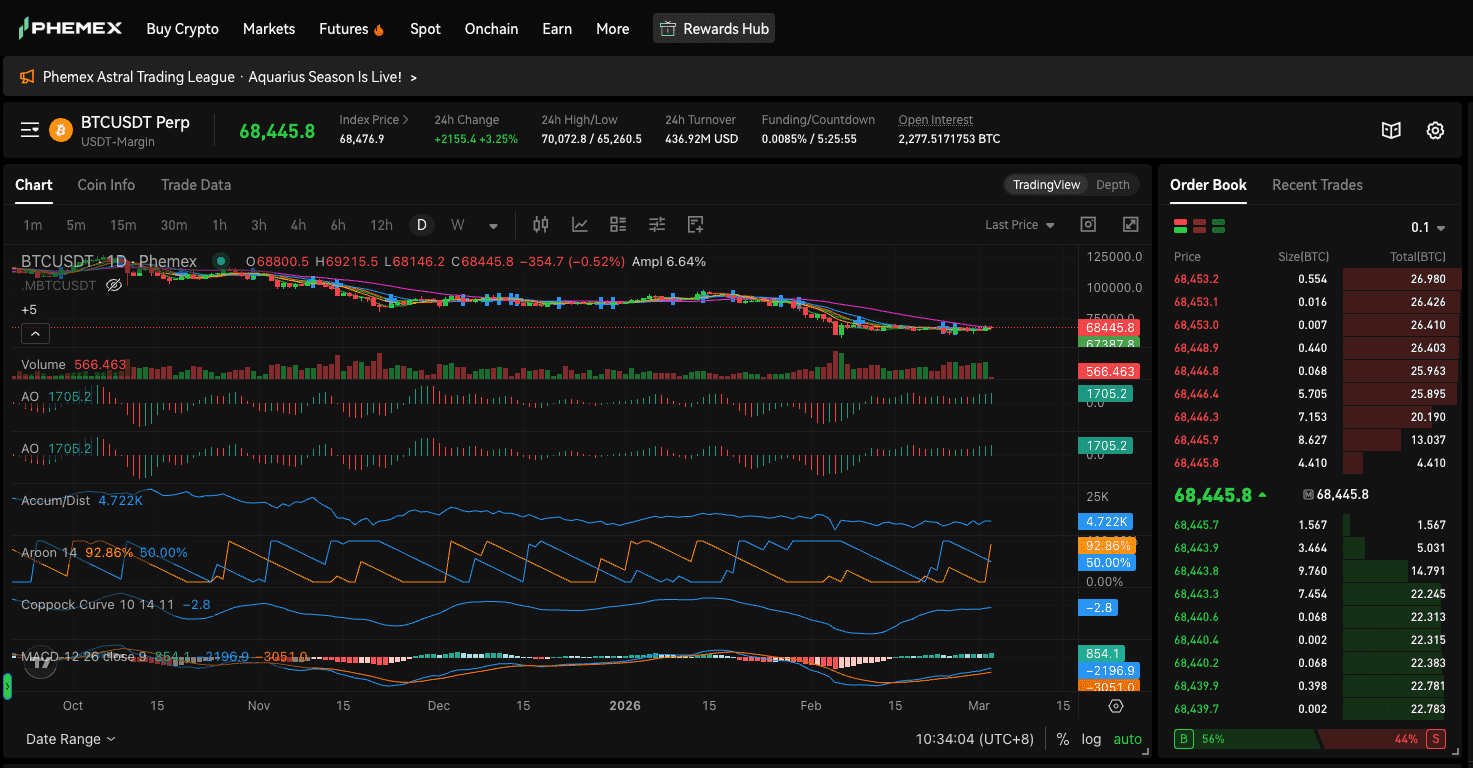
| Funding Rate | 0.0085% | Neutral - Suggests Balanced Positioning |
| Market Sentiment | Consolidation | Searching for Directional Bias |
Market Snapshot: Analyzing the BTC Retracement
The Liquidity Sweep at $70k
To understand the current price action, we must analyze the 4-hour technical structure. The brief push above $70,000 is characterized by many traders as a "Liquidity Sweep." In trending markets, price often moves slightly above a major resistance level to engage the buy-stop orders of short-sellers and the entry orders of breakout participants.
Once this liquidity is tapped, if there is insufficient follow-through buying volume to sustain the level, the price often retraces. BTC’s adjustment of nearly $1,600 following the $70,072 peak suggests that sell-side pressure is currently localized between $70,000 and $70,500.
The MA 30 Battleground
Currently, the focal technical "Pivot" for the week is the 30-day Moving Average (MA 30), which sits at approximately $68,472. In technical analysis, the MA 30 often serves as a gauge for mid-term trend strength.
Constructive Scenario: If BTC achieves a daily candle close above $68,500, it would suggest the rejection was a temporary cooling-off period before a subsequent attempt to test $70k.
Cautious Scenario: A failure to maintain the MA 30 may lead the market to test the $67,000 support zone, or potentially the $65,260 level, which acted as a price floor last week.
Derivatives Data: Monitoring Market Positioning
A vital indicator of market health is the Funding Rate. Currently at 0.0085%, the funding rate remains in positive territory but is far from being "overheated."
What does this mean for your analysis?
In an overextended market, funding rates often spike (e.g., 0.05% or higher) as a large number of participants use high leverage to maintain long positions. This often increases the risk of a "long squeeze" if the price dips.
However, at 0.0085%, the market appears relatively balanced. This indicates:
Stable Positioning: Despite the rejection from $70k, the data does not show widespread panic selling. Participants appear to view this as a technical pullback.
Disciplined Sentiment: The majority of traders maintain a constructive outlook but are exercising discipline. This stability suggests the current pullback is likely a spot-driven correction or a minor deleveraging event.
Futures Strategy: Navigating the Volatility
For participants on Phemex Futures, the current price range ($68k - $70k) presents a high-volatility environment. Note: These scenarios are for informational purposes and do not constitute financial advice.
Scenario A: Potential Continuation of Downward Pressure
If Bitcoin fails to reclaim the $68,800 level within the next 4 to 8 hours, it may signal that upward momentum is temporarily exhausted.
Observation: Traders often monitor if the price breaks below the local support of $68,200 on high volume.
Key Levels: Potential downside interest may focus on the $67,200 - $67,500 range (the next liquidity zone).
Risk Management: A strict exit strategy is often placed at $69,300; moving above this level would typically invalidate the short-term bearish thesis.
Scenario B: Potential Support Defense (Buying the Rejection)
If Bitcoin stabilizes above $68,000 and the market sees an increase in Open Interest (OI) without a price decline, it may indicate new buyers are entering at these levels.
Observation: Entry interest typically clusters near the $68,000 - $68,200 zone.
Key Levels: A re-test of the $69,800 - $70,000 resistance.
Confirmation: Technical traders often look for a bullish crossover on the RSI (Relative Strength Index) on the 15-minute chart.
Trade BTC/USDT Perp with up to 100x Leverage on Phemex
Spot Strategy: Long-Term Accumulation Zones
For long-term holders, intraday fluctuations of $1,000 offer an opportunity to evaluate average entry prices. The rejection from $70k allows for a more calculated approach than chasing the price during a breakout.
The Accumulation Zone Analysis
Historically, the $65,000 to $68,000 range has functioned as a high-volume node. This indicates significant transaction history, which often creates a technical "cushion" of support. If your analysis targets the $75,000+ range in the future, the current consolidation near $68,000 provides a different risk-to-reward ratio than buying at the peak.
Strategic Considerations:
Staggered Orders: Some participants place limit orders between $66,500 and $68,000 to account for short-term volatility wicks.
Dollar Cost Averaging (DCA): If the price maintains the MA 30 over the next 48 hours, it may be viewed as a sign of trend consolidation.
Macro Perspective: As long as BTC maintains higher lows on the weekly chart (staying above $65,260), the macro trend remains technically constructive. We are currently in what many analysts describe as a re-accumulation phase.
Buy & Accumulate BTC on Phemex Spot
Key Indicators to Watch Next (March 4-5)
As the week progresses, keep your eyes on these three critical factors:
Daily Close Price: A close above $68,500 is vital for maintaining buyer confidence. A close below $67,800 could trigger a more extended correction.
US Macro Data (2026): Monitor any scheduled Federal Reserve comments or employment data. In 2026, Bitcoin's correlation with global liquidity continues to be a primary driver.
Exchange Reserve Trends: Watch for BTC moving off exchanges. If reserves decrease despite price volatility, it suggests that institutional participants are moving assets to cold storage—often a long-term bullish signal.
Conclusion: The Path of Price Discovery
Rejections at major psychological levels like $70,000 are common in healthy market cycles. These movements serve to reduce speculative excess and allow the market to build a more sustainable foundation. Today’s data shows that while the $70k barrier is significant, the support at $68k is being actively defended by participants.
The "Battle for Support" is active. Whether you are a futures scalper or a long-term spot holder, the current volatility on Phemex offers ample data points to refine your strategy. Stay disciplined, utilize risk management tools, and focus on the broader technical trend.
How are you positioning your portfolio? Are you observing the support levels or waiting for a confirmed breakout? Execute your strategy on Phemex today.
Disclaimer: The technical analysis and market commentary provided in this article are for informational purposes only and do not constitute financial, investment, or trading advice. Cryptocurrency trading involves significant risk of loss. Always conduct your own research and consult with a professional financial advisor before making any investment decisions. Phemex is not responsible for any trading losses incurred.