

Many indicators used in technical market analysis use moving averages (MA) with overly simplistic parameters, resulting in data of questionable accuracy. Various tools have been created to allow traders to discount false signals and base their strategies on more perfect (if still incomplete) datasets. One such tool is the Arnaud Legoux moving average (ALMA).

What Is an Arnaud Legoux Moving Average?
The Arnaud Legoux moving average indicator is used by traders/investors to isolate and extract price movement insight based purely on data obtained by applying the ALMA to any graphic that shows periodical price changes. The ALMA trading indicator aims to give more reliable signals than other forms of MAs by eliminating (or smoothing out) small fluctuations in an asset’s price, thereby making upward or downward trends clearly visible. This in turn reduces price lag, meaning it creates a smoother line than most MAs. The ALMA does this by essentially applying a double MA, one moving in the standard left-to-right direction, and another moving right to left.
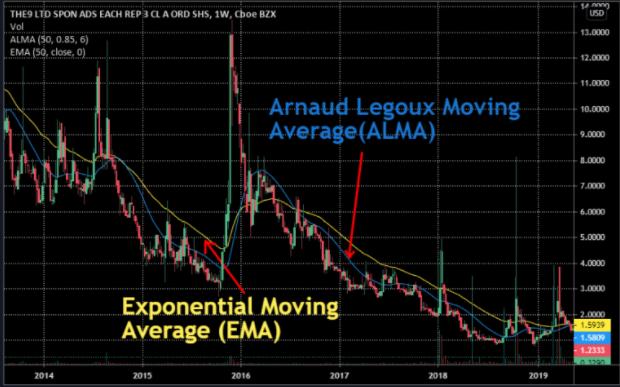
ALMA (blue line) compared with EMA (yellow line) on a price movement graph (source: Estradinglife)
The Arnaud Legoux moving average was developed in 2009 by Arnaud Legoux and Dimitrios Kouzis-Loukas, who sought a solution that would generate more useful data than simple moving averages (SMA) and exponential moving averages (EMA). The pair was inspired to remove “noise” (i.e., inconsequential or misleading data) from price movement charts to provide smoother images. Many different forms of smoothed moving averages (SMMA) already existed, but Legoux and Kouzis-Loukas felt the results of these solutions still weren’t accurate enough.

Noisy vs smooth vs sparse example, showing the same dataset (source: TDS)
How Is ALMA Calculated? Arnaud Legoux Moving Average Formula
The ALMA moving average formula involves examining how a selection of asset/security prices move across a specified time period, and then applying certain concepts:
- Standard deviation: This is a statistical concept that shows how far data (a price’s highs and lows, for example) has spread out from its standard, or average point. Standard deviation is defined as the square root of the variance between these data points. In the context of the ALMA, standard deviation quantifies outcomes, using a price’s average as a point of reference. High standards of deviation are often associated with extreme volatility, meaning higher risk of capital loss when applied to the trade of stocks, assets, and securities.
 Standard deviation example, in this case using percentage to denote deviation from its “bell curve” central point (source: Capital Com)
 - Gaussian filters: When applied to a graph, Gaussian filters take the form of a characteristic and symmetric “bell curve” (seen in the image above). Gaussian filters generate numerical values used to better understand probability, and predict the outcome of a security or asset’s movements.
When calculating an ALMA, one essentially uses a pair of MAs, each running opposite and parallel to each other left/right across an indicator graphic. While this is easy to visualize, it’s a rather more complicated calculation in practice.
Simply put, the Arnaud Legoux moving average is not for novice traders, as they are complex and fairly specified in terms of usage (though it’s worth noting that an ALMA can be applied to other mathematical concepts, including Python-based web development and coding). Generally, the formula works best across longer timeframes — at least relative to less-specific price analysis indicators. Therefore, ALMA indicators are typically used by medium-to-long term traders who profit from price swings. Traders of this type will use ALMA indicators to better forecast the future of the market in which they operate and to identify whether the strategy they implement should be for a bullish or bearish trend.
What Is the Arnaud Legoux Moving Average Strategy and How to Use an ALMA Indicator?
In finance, the ALMA would typically be applied to candlestick graphs, which represent price performance over a defined period of time. When the ALMA line is calculated, using the formula shown above to draw it across a chart, the analyst studying the data will look out for two things in particular:

Example of a decreased (red) and increased (green) candlestick marker, with wicks denoting higher highs and lower lows
- Low wick: If a candle’s lower wick falls below the graphical ALMA line on a price chart, then the market is considered bearish. This would generally mean some kind of sell trigger would be activated, and traders would usually favor short calls in this situation.
- High wick: If a candle’s upper wick sits above the graphical ALMA line on a price chart, then the market is considered bullish. This would generally mean some kind of buy order would be activated, and traders would usually favor long calls.
These are not the only signals generated by the ALMA indicator. When used in conjunction with other MAs and indicators, the ALMA can be used to identify an asset or security’s support/resistance levels. In fact, this is almost certainly the most common usage for ALMA indicators — as virtually no long-term trading strategy can be reasonably built on a single indicator’s dataset, no matter how accurate or intrinsically complicated that indicator may be.

What Are the Inherent Limitations When Using Arnaud Legoux Moving Average?
Although the Arnaud Legoux moving average is itself designed as an improvement on the standard MA model, they have inherent limitations. This is because the ALMA is still calculated using previous price analyses — and while the past can provide a better understanding of both the present and future, it’s by no means foolproof. In fact, no technical indicators present error-free data. In some cases they can even generate what are known as false signals, such as misleading datasets which can easily cause confusion and capital loss even for experienced traders.
The ALMA, and in fact MAs in general, don’t account for the impact of future events. While they can help predict trends based on previous activity of the same nature, they cannot predict impactful events such as a broader market sell-off or other changes in the supply/demand chain. In the unpredictable and volatile crypto market, you should never trade with more capital than you’re prepared to lose.
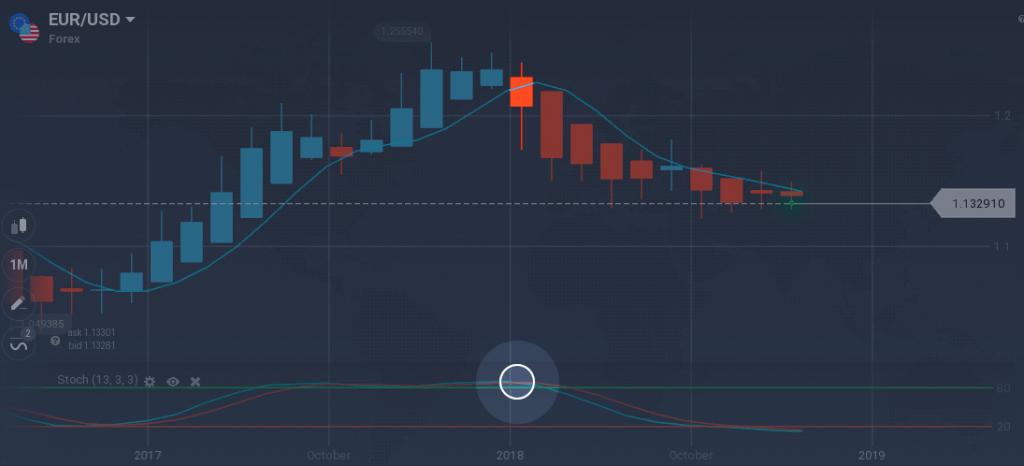
ALMA indication (blue line) for EUR/USD over a two year period (source: IQblog)
How Is The ALMA Indicator Used By Cryptocurrency Investors?
While it’s not the most common indicator when it comes to cryptocurrency price analysis, the ALMA still has its uses for the decentralized financial (DeFi) market. Accuracy has its uses no matter the context, and in this the buying and selling of cryptocurrency is no different from any other type of asset. Additionally, with rapid transactional speeds and quicker turnover becoming more and more the focus for crypto investors, the ALMA can provide diligent traders with several other benefits, such as the following:
- Oscillator confirmation: The ALMA can be used to confirm data obtained from other cryptocurrency price analysis charts (often oscillators), which can make identifying overbought or oversold assets easier. As the ALMA tends toward sticking to the price, you can confirm data by simply ascertaining whether the price being studied is above or below the ALMA line.
- A faster alternative to an MA: The ALMA generally lags less than other MAs, meaning that data can be identified quickly and easily. This means that you can identify crossover signals with minimal hassle, provided you know what to look for, and where.
- Scalping uses: The ALMA can also be used for scalping, which is a short-term strategy that involves making small profits at regular intervals, with the aim of making more substantial returns over a greater time period. This can be tricky, especially for anyone attempting to implement this strategy manually, without some form of digital assistance.

Conclusion
The ALMA is specifically designed to provide optimal smoothness and responsiveness, but this comes at the cost of complexity and specificity. Thus, this indicator may not be suitable for traders with low risk tolerance, unless they feel entirely confident in their analytical abilities. There’s a reason that many brokers will consult market analysts themselves, particularly when making larger, riskier investments.
With that being said, the ALMA is used throughout the financial and cryptocurrency industries to help provide a better idea of what strategies a trader should implement ahead of time. Whether the mathematics are understood or not, it’s easy to understand that Legoux and Kouzis-Loukas are no fools when it comes to market analysis innovation.
Read More
- SMA Trading Strategies for Crypto Trading
- What is, And How to Trade Crypto With The Moving Average?
- What is The Least Squared Moving Average (LSMA): How To Trade With This Indicator?
- What is MESA Adaptive Moving Average Indicator (MAMA)?
- Exponential Moving Average (EMA): The Most Important Moving Average Indicator
- What is The Guppy Multiple Moving Average (GMMA): A Complete Guide
- Weighted Moving Average (WMA): How to Use The Fastest Moving Average Indicator
- How to Use the MACD Indicator?