

In traditional finance, experienced traders typically utilize various trading tools and technical indicators to time the market and determine the optimal entry and exit points to generate maximum profits. These tools and technical indicators can also be applied to crypto trading and other markets. An example of a technical indicator that traders can use to trade crypto is the Least Squared Moving Average (LSMA), another variation of the Moving Average (MA).
What Is The Least Squared Moving Average (LSMA)?
The Least Squared Moving Average (LSMA) or Linear Regression Moving Average can be used as a trend and reversal indicator. It’s a technical analysis tool that studies past market data, such as the price and trading volume, and uses it to predict the future direction of an asset’s price. As mentioned previously, the LSMA is a variation of the Moving Average (MA). The MA is a calculation of a particular asset’s average trading price over some time. On the other hand, the LSMA indicator is based on the least-squares method.
What Is The Least-Squares Method?
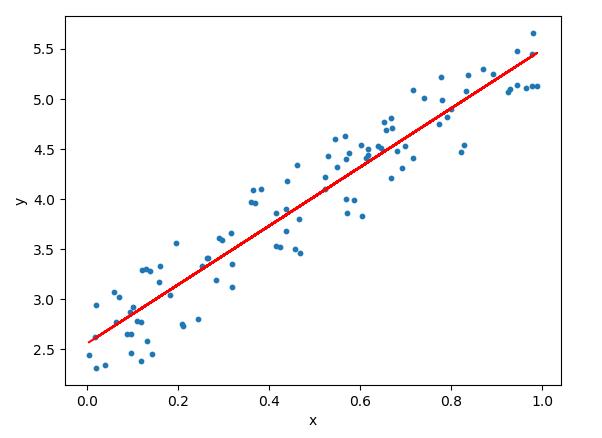
The least-squares method is a statistical approach that involves a regression analysis. Regression is a statistical method that is often used in finance, investing, and scientific analysis. This statistical method takes a set of data and determines the relationship between a dependent variable and one or more independent variables. The most common form of regression analysis is linear regression, which encompasses finding the best fit for a set of data. An example of a linear regression line is shown in the figure below. In the least-squares method, the best fit line can be obtained by minimizing the sum of squared residuals. Residuals are the difference between the observed value and the estimated value of the variable of interest.
How Is The LSMA Indicator Helpful?
The LSMA indicator helps traders determine whether the market is in an uptrend or a downtrend. As a trend following indicator, the indicator will move upwards when the market is in an uptrend and downwards during a downtrend. The indicator will also continue moving in the direction of a price trend even after the trend has ended. To determine a reversal, the trader would look at the asset price. If the asset LSMA rises above the price during the uptrend, it indicates a possible reversal into a downtrend. In contrast, if the asset LSMA drops below the price during the downtrend, then it means that there might be a possible reversal into the uptrend.

How To Recognize Reversals Using The LSMA?
Here are some examples showing readers and novice traders how to use the LSMA to determine possible reversal signals. The figures below will show how to use the LSMA to determine reversals from an uptrend into a downtrend and vice versa. The default LSMA 25 is used. The LSMA 25 takes price data from the past 25 days for the best fit line.
Using The LSMA To Determine An Uptrend
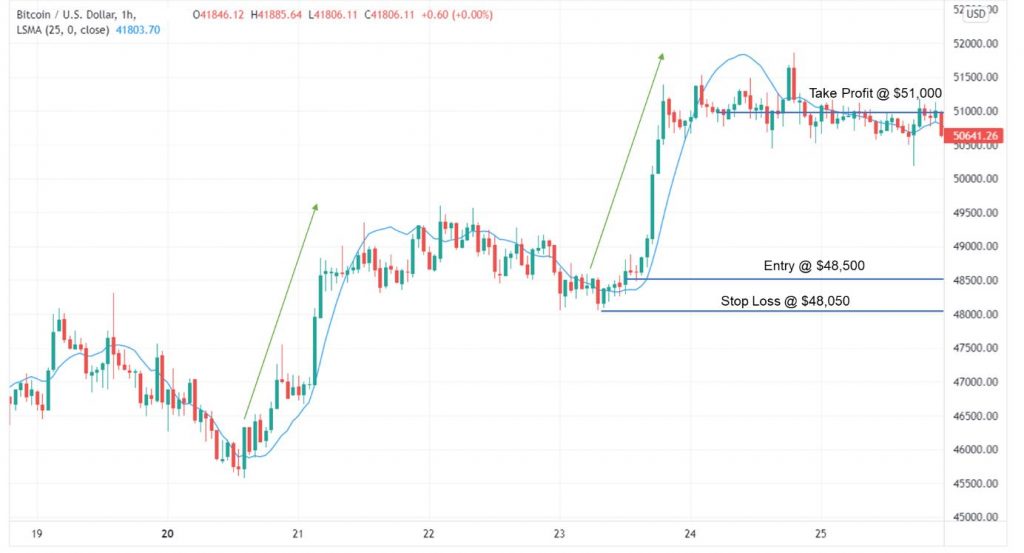
From the figure below, two buy signals are identified using the LSMA indicator (blue line). The first buy signal is located at a Bitcoin (BTC) price of around $46,000. In the figure, after the end of a short downtrend, the price moved up and is above the LSMA. In this example, the price continues upward and rises to around $48,500. Afterward, the price enters a sideways trend. The second buy signal can be identified after the sideways trend at $48,500 using the same LSMA indicator. Similar to the first buy signal, the price is above the LSMA indicator and continues to move upwards. BTC’s price then reaches $51,000 and enters another sideways trend. Traders may consider going long at the points where the buy signals are located.

Using The LSMA To Determine A Downtrend
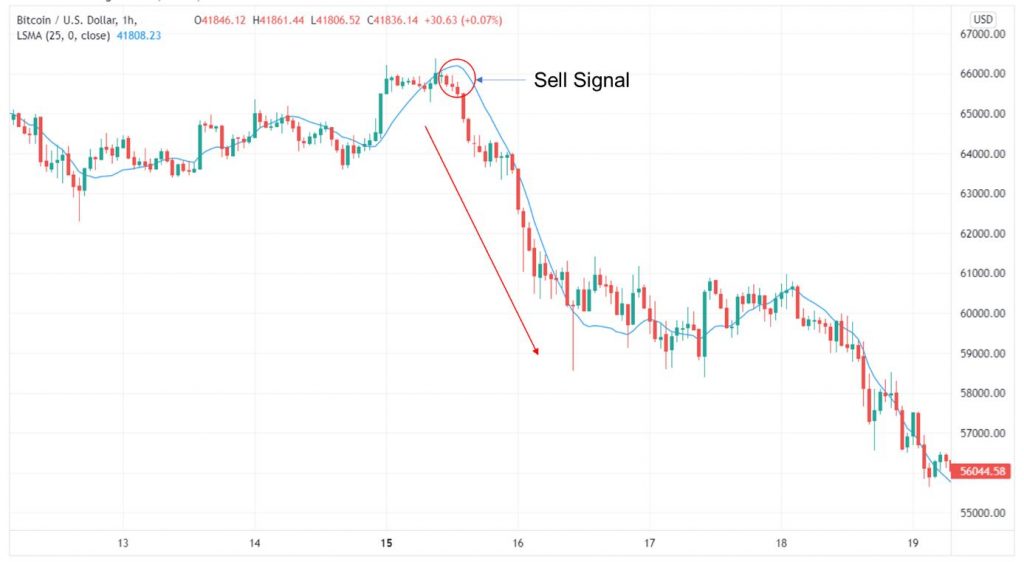
A sell signal is identified using the LSMA indicator (blue line) from the figure below. The sell signal is located at a BTC price of around $66,000. In the figure, after a sideways trend, the price moved down and is below the LSMA. In this example, the price continues downward and falls to around $60,000. Traders may consider going short at the points where the sell signal is located.
How To Trade With The LSMA?
Once traders can regularly spot the possible buy and sell signals using the LSMA indicator, they should consider how to enter or exit the market and place their Stop Loss or Take Profit orders. As the crypto market is volatile, the Stop Loss or Take Profit order should not be too close to the entry price, or else it will trigger too quickly. Traders can place Take Profit orders depending on the support and resistance levels. Traders can also place the Take Profit order depending on the reward-to-risk ratio, which is calculated as follows:
(Take Profit price – Entry price) / (Entry price – Stop Loss price) = Reward-to-risk ratio
Using The LSMA To Go Long
The figure below is an example of how to enter a market after locating a buy signal using the LSMA indicator. The corresponding steps are as follows:
- The trader identifies a buy signal, where the price is above the LMSA indicator, signifying a possible uptrend.
- The trader waits until the next candles show that the asset’s price is increasing, confirming the buy signal. Any candle after the first candle above the LMSA indicator can be the entry point. The trader can also place a trade order and enter at the price point where the support level is located.
- The trader places an order around the identified price point of around $48,500 and prepares to go long.
- To limit losses, the trader places a Stop Loss order at the lower end of any candle before the buy signal. In this case, the Stop Loss order is placed at around $48,500. The Stop Loss order can be placed at an even lower price depending on the trader’s risk tolerance to prevent an early trigger.
- The trader places a Take Profit order to exit the market. In this case, the Take Profit order is placed around the resistance level at $51,000, giving a reward-to-risk ratio of roughly 5.6. The reward-to-risk ratio in this scenario can be considered high. More conservative traders can opt for a lower reward-to-risk ratio of around 1 to 3.
Using The LSMA To Go Short
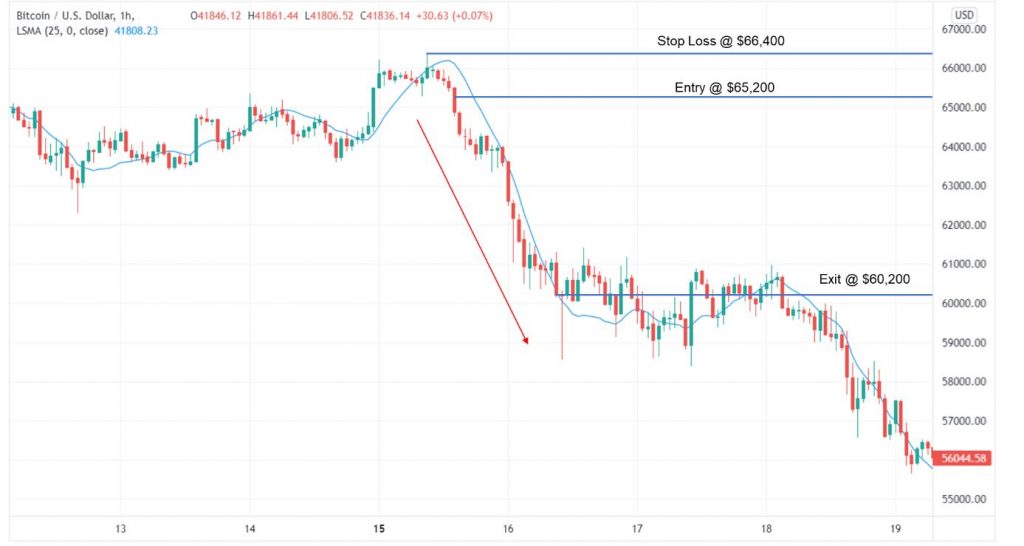
The figure below is an example of how to enter a market after locating a sell signal using the LSMA indicator. The corresponding steps are as follows:
- The trader identifies a sell signal, where the price is below the LMSA indicator, signifying a possible downtrend.
- The trader waits until the next candles show that the asset’s price is decreasing, confirming the sell signal. Any candle after the first candle above the LMSA indicator can be the entry point. The trader can also place a trade order and enter at the price point where the resistance level is located.
- The trader places an order around the identified price point of around $65,200 and prepares to go short. Traders profit by selling their assets at a higher price and repurchasing them later at a lower price.
- To limit losses, the trader places a Stop Loss order at the higher end of any candle before the buy signal. In this case, the Stop Loss order is placed at around $66,400. The Stop Loss order can be placed at an even higher price to prevent an early trigger depending on the trader’s risk tolerance.
- The trader places a Take Profit order to exit the market. In this case, the Take Profit order is placed around the resistance level at $60,200, giving a reward-to-risk ratio of roughly 4.7. The reward-to-risk ratio in this scenario can be considered high. More conservative traders can opt for a lower reward-to-risk ratio of around 1 to 3.
How Reliable Is The LSMA Indicator?
Even though the examples above are all successful, new traders should understand that the LSMA indicator is not used in isolation. Sometimes the price may even continue to drop even though the price appeared above the LSMA. Therefore, experienced traders normally combine the LSMA indicator with other trading indicators or technical analysis tools such as the Relative Strength Index (RSI) and Moving Average Convergence Divergence (MACD). Through the combination of various analysis tools, traders can better confirm the buy and sell signals and minimize losses.

Conclusion
Trading using the LSMA can be very profitable if traders can reliably identify the buy and sell signals by adhering to the identification rules. However, like all trading strategies, trading with the LSMA indicator involves a certain degree of risk. The appearance of a buy or sell signal indicates there is a possibility of a trend reversal and does not guarantee that the reversal will happen. Thus, traders are advised to understand the limitations of the LSMA indicator. In addition, traders should combine this technical indicator with other available trading tools and practice with such tools before utilizing them in trades.
Read More
- SMA Trading Strategies for Crypto Trading
- What is, And How to Trade Crypto With The Moving Average?
- What is Arnaud Legoux Moving Averages: Increased Accuracy, at a Cost
- Non-Lagging Indicators: Top 5 Non-Lagging Indicators for Crypto Trading
- How to use Leading, Lagging, and Coincident Indicators?
- How to Use the MACD Indicator?
- How to Read Crypto Charts: Learn Trading Chart Patterns
- What Is Trend Trading: Following the Market When It Pays