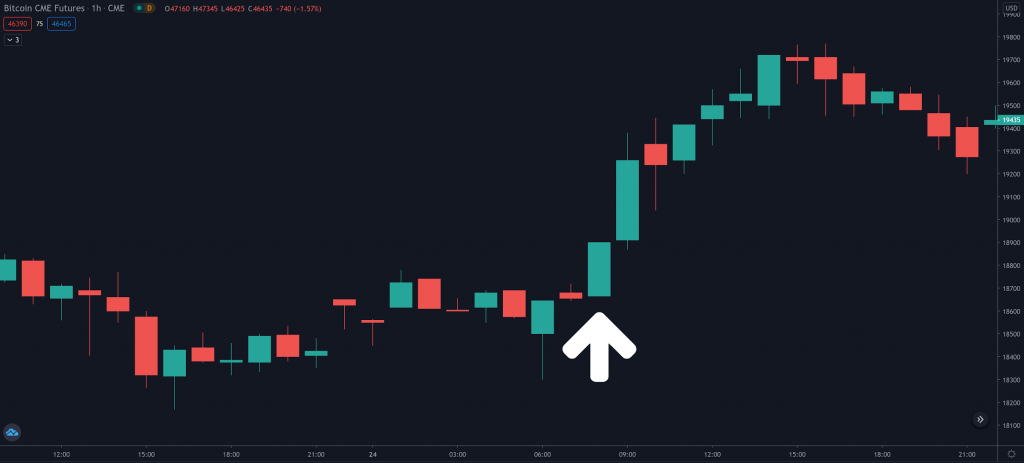
The Marubozu is a candlestick pattern identified when conducting technical analysis for Bitcoin, cryptocurrencies, stocks, commodities, or other price charts. It is one of the most straightforward candlesticks patterns to identify, making it perfect for those new to technical analysis.
There are three types of Marubozu candlestick patterns:
In all three instances, a Marubozu may be bullish or bearish — but the pattern remains the same.
What do Marubozu candlesticks look like?
A Marubozu candlestick must always have either its opening or its closing be flat — meaning there is no wick present. It may also have both its opening and closing be flat, with no wicks present on the entire candlestick.
A Marubozu full
A Marubozu full candlestick has both the open and close flat, with no wicks present on the entire candlestick. This indicates that a cryptocurrency, like Bitcoin, or an asset started a time period by moving in a certain direction and continued to move in that direction until the very end of the time period. For example, a stock may have opened a trading session by moving up in price and then closed the session without even the slightest retrace.

A Marubozu open
A Marubozu open candlestick indicates that the time period’s open was flat — illustrating that an asset’s price only moved in one direction since the start of the period. However, it did not close the time period before some amount of a retracement in the opposite direction.


A Marubozu close
A Marubozu close candlestick is the same as a Marubozu open, only in reverse. The price may have moved in one direction after opening a session, but proceeded to rally in the opposite direction before closing the session without any retracement.

Why are Marubozu candlesticks important?
Marubozu candlesticks are very useful to identify, as they often inform a technical analyst that the market is trending powerfully in a single direction.
Bearish Marubozu candlesticks indicate that sellers are overpowering buyers and pushing the market down. Conversely, bullish Marubozu candlesticks indicate that buyers are in control and are pushing an asset’s price up. In this way, one can see which side of the market is currently dominating the other.
Marubozu candlesticks are remarkably reliable. In all of the examples illustrated above, you can see that the market clearly continued to move in the direction each Marubozu candle indicated. However, nothing in technical analysis is ever 100% assured, and Marubozu candlesticks always have the chance of failing to indicate the continuation of a trend.
How do you trade Marubozu candlesticks?
Because Marubozu candlesticks are remarkably reliable, they often present solid trading opportunities.
Again, as previously illustrated, Marubozu candles frequently indicate that a trend will continue. Because of this, traders may enter long or short trades, depending on the candlestick’s direction. In the case of a bullish Marubozu candle, a trader may want to enter a long trade. Conversely, in the case of a bearish Marubozu candle, a trader may want to enter a short trade.
Depending on the time frame in question, Marubozu candles may present day-trading or swing-trading opportunities. For example, a bullish Marubozu on the hourly time frame may be worthy of a long scalp. Likewise, a bearish Marubozu on the daily time frame may provoke short interest from swing traders.
Marubozu Summary
The Marubozu candlestick formation is a remarkably reliable indication of which direction Bitcoin, cryptocurrencies, stocks or assets may trend, as they indicate that one side of the market is currently dominating the other. In other words, Marubozus show that the market is one-sided.
Marubozu formations with no wicks are called Marubozu full candlesticks, whereas wicks on either side of a formation decide whether a Marubozu is of the open or close variety.
As is always the case when conducting technical analysis, the Marubozu is best used in combination with other technical indicators and patterns in a well-defined and careful trading strategy.
Marubozus work particularly well when used with collaboration with the identification of historical support and resistance levels — as those tend to further bolster the belief that the market is currently one-sided.
Finally, the Marubozu formation is easy to identify — making it beginner-friendly — but may not prove to be as precise as other patterns that rely on multiple candlesticks.
To Learn about other important Candlestick Patterns
Read More
- The 8 Most Important Crypto Candlestick Patterns
- Doji Candlesticks: What They Are and How To Use Them
- All About Reversal Candles: How to Read and Trade
- What Are Bullish And Bearish Harami Candles?
- Dark Cloud Cover Pattern – What Does it Mean?
- What is OHLC Chart: Price Action Predictors
- What is Spinning Top Candlestick and How to Use it in Crypto Trading
- How To Recognize and Trade on Long Wick Candlesticks?


