Market Overview: Silver has emerged as a focal point of global financial markets this week. Following a parabolic trajectory that initiated near the 86.20 yesterday, the asset is currently undergoing a technical consolidation. As of this morning, February 12, 2026, the price is stabilizing around a critical technical pivot point of $83.68. This significant price action is actively reshaping Gold (XAU) market sentiment, as participants analyze the interplay between precious metals and crypto-asset volatility within the 2026 macroeconomic framework.
Silver Prices Today: Technical Update (Feb 12)
Search interest for "Silver prices today" has increased by 300% in the last 4 hours, driven by the volatility captured on the live charts. As of February 12, 2026, the silver market is testing the strength of its recent rally.
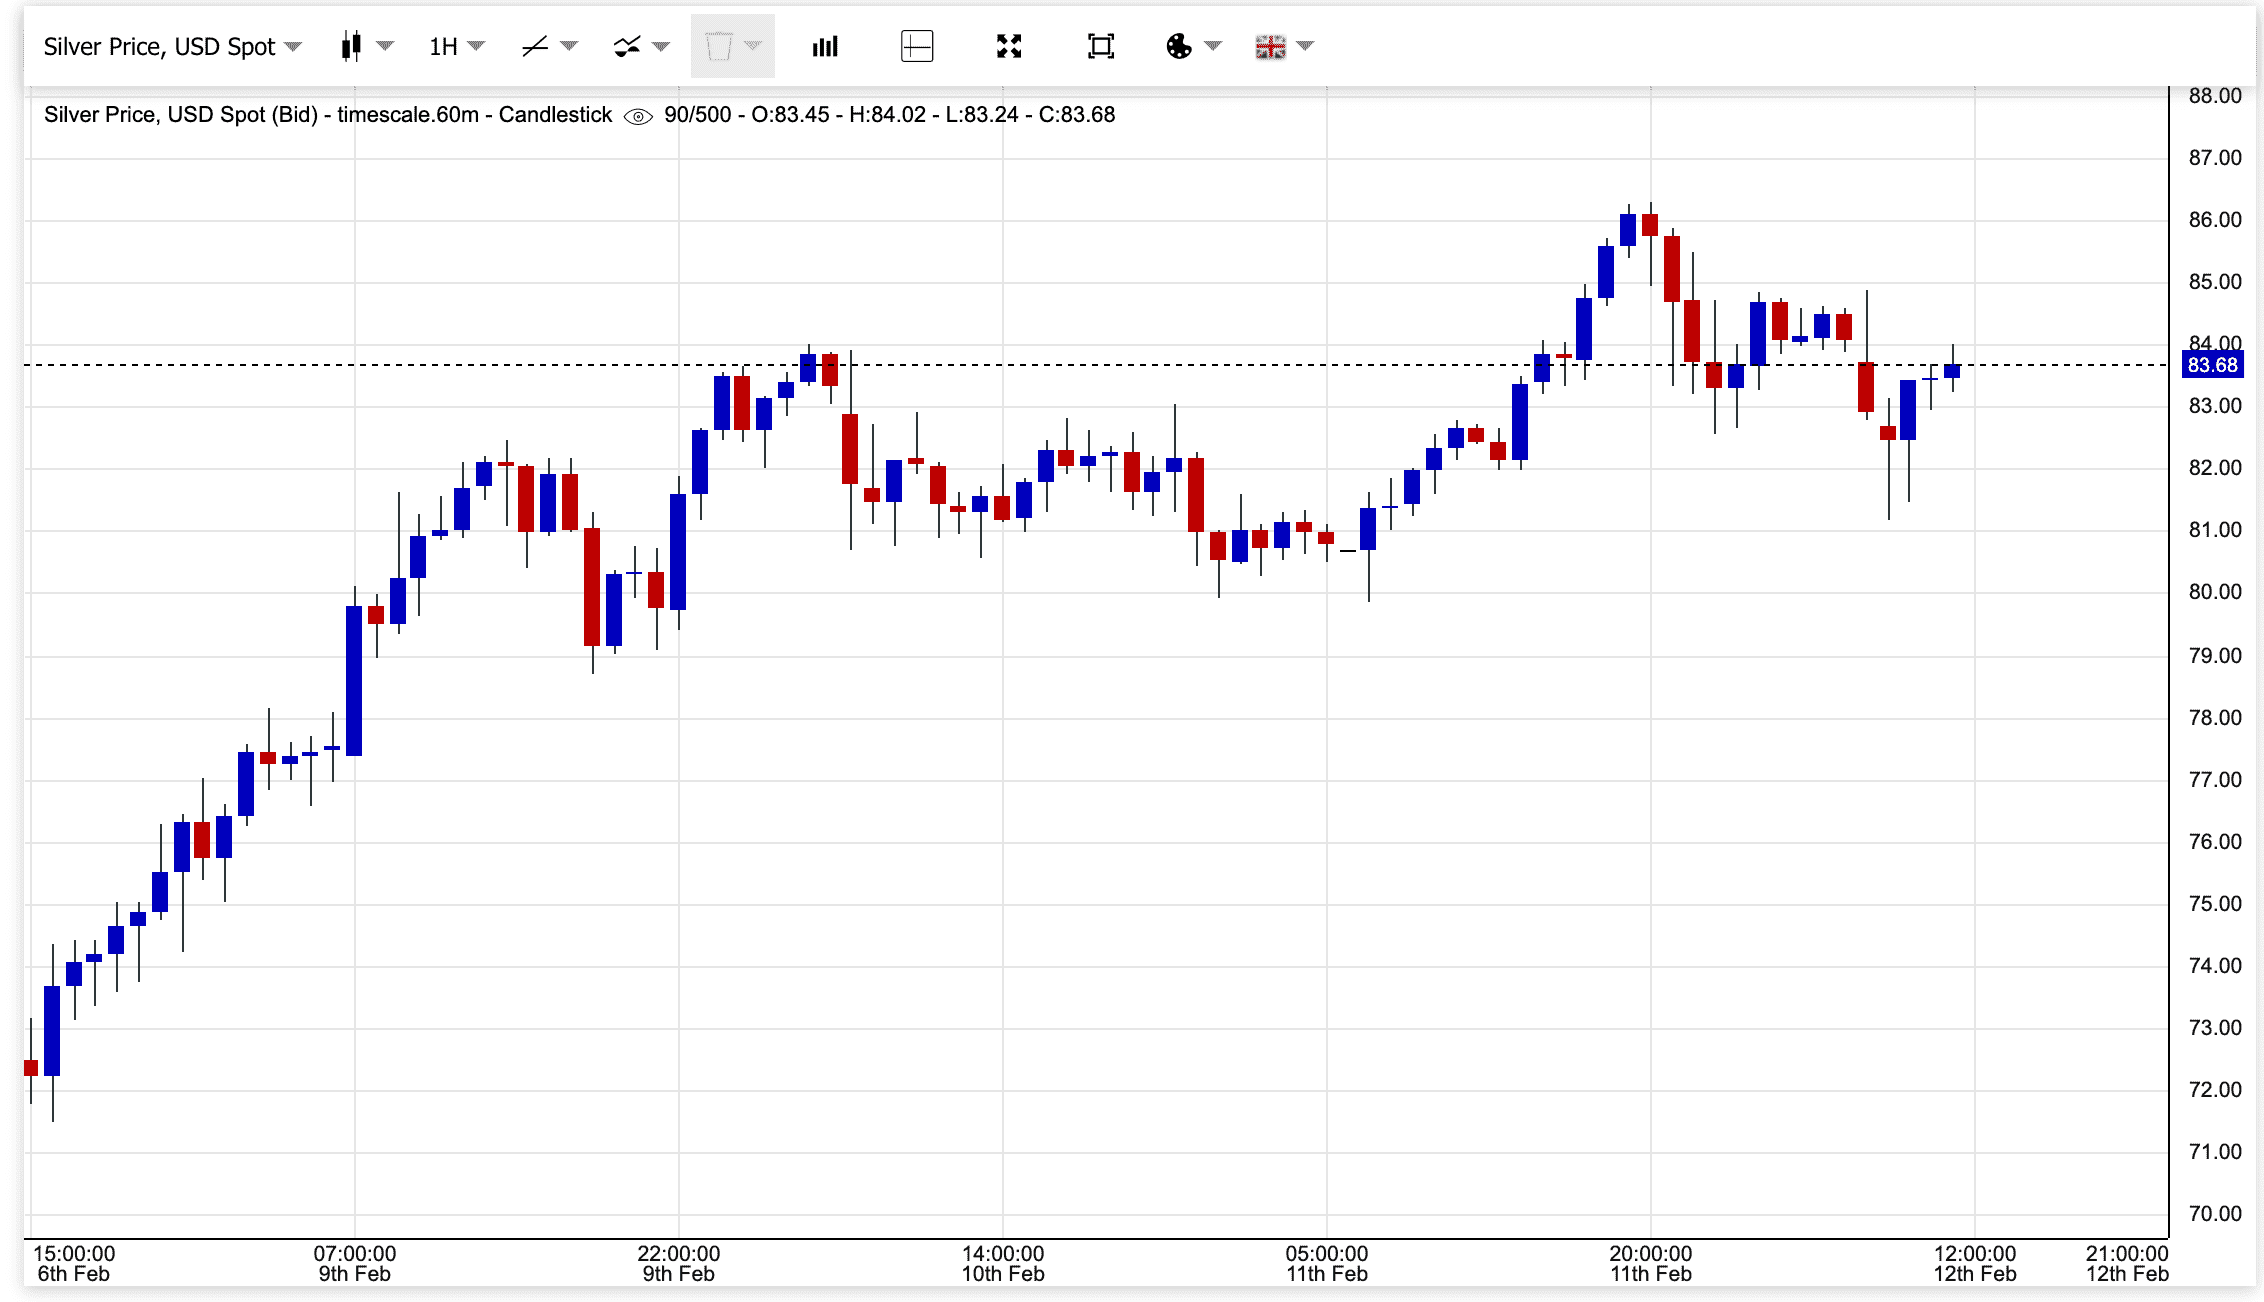
According to the 1-hour candlestick chart, the trend since February 6th has been characterized by high-momentum buying. After trading in the low 86.20 in less than six trading days—a move representing nearly 20% in price appreciation. Currently, the market is oscillating at $83.68, a level that technical analysts are identifying as a "support-turned-resistance" test. The market's ability to maintain this level is being monitored with high interest by institutional and retail desks alike.
While Gold often exhibits the steady growth patterns of a large-cap asset, Silver is currently performing as a high-beta instrument within the precious metals sector. The current volatility is attributed to:
1. Shifts in Industrial Demand Fundamentals
Manufacturing data for Q1 2026 has exceeded initial projections. Silver’s integral role in the 2026 green-tech expansion—particularly in high-efficiency solar cells and next-generation EV power grids—has shifted from a long-term catalyst to a present-day supply-side consideration. The move from $72 to $86 reflects, in part, industrial procurement activity seeking to secure physical delivery amidst tightening availability.
2. Technical Breakout & Liquidity Analysis
The chart displays a classic parabolic curve followed by a structured consolidation. The dotted horizontal line on the 1H chart at the $83.50 - $84.00 range represents the current market battleground. From a technical perspective, if the market establishes a solid floor at $84.00 today, the path toward the $90 psychological resistance becomes a focal point for momentum traders.
Liquidity analysis is crucial here, as it helps traders understand the depth and resilience of the market at these key levels.
3. Portfolio Hedging in 2026
Traders on Phemex are increasingly observing Silver (SLV) as a potential hedge against the lateral "sideways" movement seen in major crypto assets this week. As market participants evaluate whether crypto will see a major rebound in the latter half of 2026, capital is rotating into tangible assets that exhibit high-momentum characteristics. For more on this, see How to Hedge Your Crypto Portfolio in 2025: Strategies, Risks, and Platforms.
Strategic Context: For those monitoring the market post-83.68** provides a secondary data point for evaluating entry/exit strategies. Silver is testing resistance levels not reached since the previous quarter, and the volume profiles suggest significant institutional participation in the recent buying pressure.
How Silver's Volatility Influences Gold Price Prediction 2026
Phemex internal metrics show a surge in queries for "Gold price prediction 2026" (and Goldpreis prognose for our European user base). The correlation is clear: Silver often acts as a leading indicator for broader sentiment in the Gold market.
The Silver-Gold Ratio Indicator
Historically, Silver is the more volatile sibling of the metals pair. When Silver outperforms Gold on an intraday basis—as seen in this recent 20% spike—it is often interpreted by technical analysts as a signal for a broader "Metals Supercycle." Today’s movement in Silver is serving as a leading indicator for XAU/USDT pairs.
When the Silver-Gold Ratio compresses (Silver becoming more expensive relative to Gold), it frequently precedes a catch-up phase in the Gold market. Stabilization above $83.00 for silver may provide the psychological confirmation needed for Gold bulls to attempt a move toward the $3,000 mark.
For the 2026 Outlook:
Many analysts are currently revising their "Gold price prediction 2026" targets. While the year began with conservative estimates around $2,600, the aggressive breakout led by Silver on Feb 12 suggests that a target of $3,200 by year-end is being discussed as a high-probability scenario in current market models.
The Safe Haven Rotation
With geopolitical shifts and currency fluctuations characterizing the 2026 news cycle, the rotation into metals is evident. Participants are utilizing Phemex to trade Gold (XAU) for potential long-term value preservation and Silver (SLV) for exposure to shorter-term, aggressive growth trends.
Expert Insight: Silver and Gold should not be analyzed in isolation. The price action at $83.68 today is one of the most significant technical indicators for Gold futures this month. With the "white metal" testing these new highs, historical patterns suggest the "yellow metal" may face similar upward pressure.
Technical Deep Dive: Analyzing the Silver Hourly Chart
To trade effectively on Phemex, we must analyze the specific price levels indicated in today’s live chart (Feb 12, 2026).
The Launchpad ($72.00 - $76.00): This served as the primary accumulation zone during the first week of February.
The Peak ($86.20): This level encountered sharp rejection on February 11th. It currently stands as the local resistance ceiling. A confirmed break above $86.50 would be required to signal a continuation of the parabolic trend.
The Pivot ($83.68): This is the current market price. The price is currently "hugging" the dotted resistance line. In technical terms, this is a "retest of the breakout zone." A candle close above this line on a 4H timeframe would typically confirm that bullish control remains intact.
Support Zones: If the 81.00, which served as a consolidation zone on February 10th.
Why "Goldpreis Prognose" is Trending in 2026
For our DACH region traders (Germany, Austria, Switzerland), the term Goldpreis prognose has reached peak search volume today. The European market is exhibiting high sensitivity to 2026 inflation metrics. As the Euro navigates specific regional challenges, the move into XAU/USDT and physically-backed tokens like PAXG has become a standard defensive posture.
The 2026 outlook for Gold is transitioning. Beyond being a "Store of Value", the aggressive moves seen in Silver are shifting the "Goldpreis" narrative toward that of a "Growth Asset" capable of outperforming traditional equity benchmarks in the current volatility.
Navigating Volatility: Trading SLV & Metals on Phemex
The 2026 market moves with significant speed. On Phemex, participants can access tools to manage this volatility with up to 20x leverage, allowing for precise exposure to the Silver breakout.
1. Momentum Trading: Silver (SLVON/USDT)
Silver is the standout performer of the day. Despite the slight pullback to $83.68, momentum trading remains elevated. Traders are using Phemex Silver pairs to navigate intraday swings as the market tests the $86.00 high. For more on trading strategies, see Crypto Price Action Trading Strategy.
Resistance Targets: $86.00 (Local high) / $90.00 (Psychological).
Technical Support: $81.50 (Recent structural support).
2. Correlation Strategy: Gold (XAU/USDT)
If today’s Silver data suggests a sustained 2026 bull run, the Gold "catch-up" trade is a strategy many are watching. While Silver has moved 20%, Gold’s move has been more measured, creating a potential divergence.
For more on correlation, see What is Asset Correlation: A Powerful Weapon for Portfolio Diversification and What are Crypto Futures & How do They Work?.
3. Digital Gold: PAXG/USDT
For participants seeking the security of gold with the liquidity of crypto, PAX Gold (PAXG) remains a premier 2026 asset. It allows for exposure within the Phemex ecosystem to an asset 100% backed by physical gold bars.
For more on digital gold, see What Are Digital Assets & Why Do They Have Value.
The 2026 Macro Context: Why Feb 12?
The price action we are witnessing today, February 12, 2026, is the result of a "Great Convergence":
Institutional Reserves: Central banks in 2026 have increased metal reserves by an estimated 15% year-over-year.
AI Hardware Infrastructure: The 2026 AI expansion relies heavily on high-conductivity silver for hardware manufacturing.
Currency Sentiment: As global debt levels reach new milestones, the "safe haven" narrative of metals remains historically strong.
Conclusion: Market Positioning in 2026
The chart provides a clear narrative. Silver’s ascent from $72 to 83.68**, we are at a technical crossroads. Whether you are utilizing a "Gold price prediction 2026" for long-term strategy or scalping the XAU/USDT volatility today, the precious metals market is currently the center of price discovery.
The trend remains a primary tool for market analysis. Based on the Silver charts today, the market is entering a new phase of the 2026 breakout. By utilizing the professional trading suite on Phemex, you can position your portfolio according to these real-time market shifts.
Join Phemex Today & Trade the 2026 Metals Breakout
Disclaimer: This article is for informational purposes only and does not constitute financial or investment advice. "Gold price prediction 2026" targets are based on technical analysis of current market trends and historical correlations. Trading with leverage involves significant risk to your capital. Always ensure you understand the risks and trade responsibly.