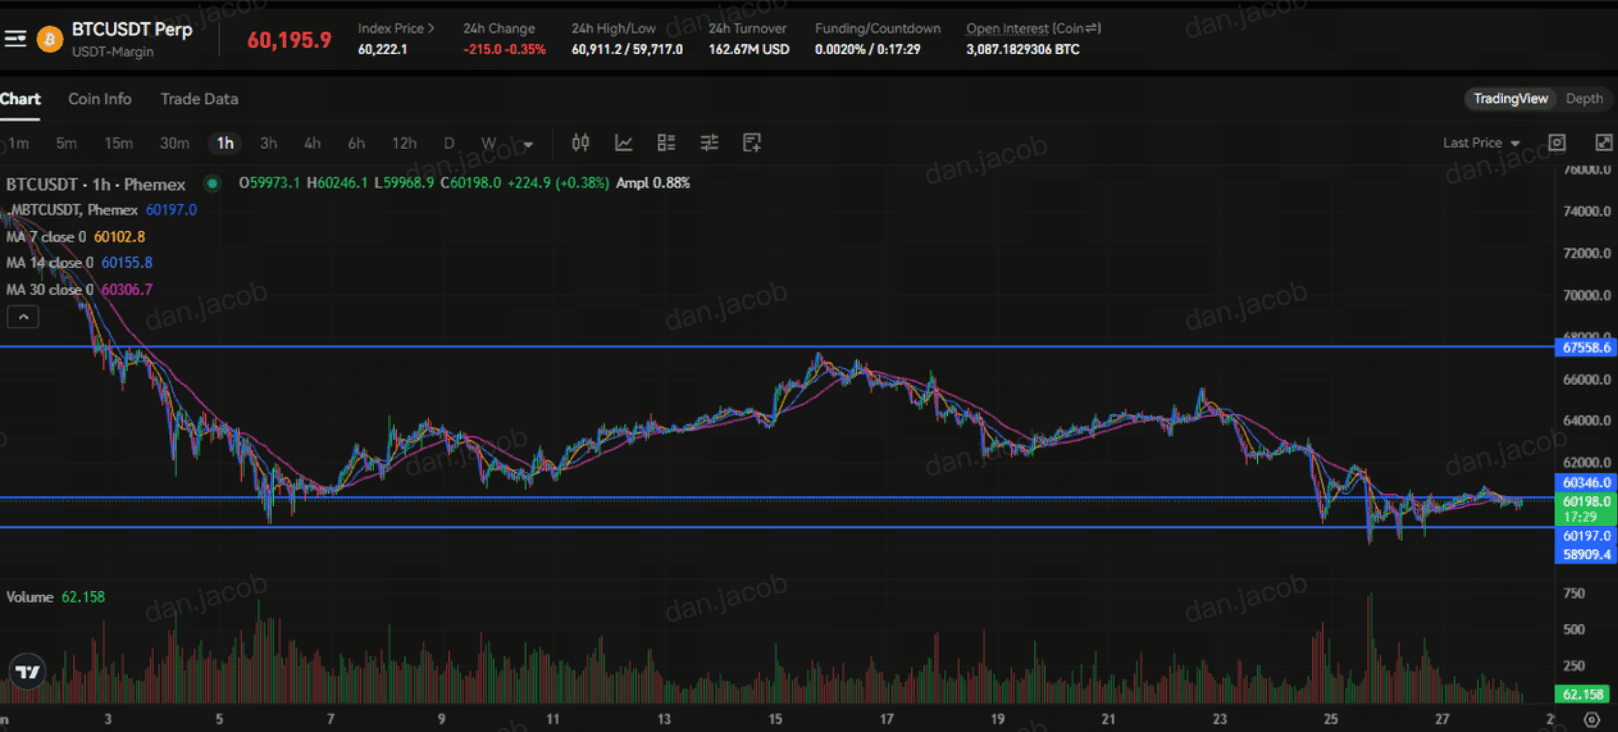
Bitcoin trades at $60,141 this weekend after a brutal six-week slide that dragged it to $58,000 on June 26, the lowest print since September 2024. The bounce back toward $60,000 stopped the bleeding, but it has not repaired the damage. Spot Bitcoin ETFs have leaked outflows for roughly six straight weeks, long-term holders have been distributing into every bounce, and a chunk of risk capital has rotated out of crypto and into AI equities. The Fear and Greed Index sits at 24, deep in Extreme Fear, which is exactly where bottoms tend to get built and where bull traps tend to spring.
The chart is now a question of levels, not narratives. Reclaim the right ones and this looks like a capitulation low. Lose the wrong ones and the September 2024 floor is the next thing standing between price and a much deeper flush.
Here is the level map that decides which way the week breaks.
Bitcoin Price Snapshot for June 28, 2026
- Price: Bitcoin trades at $60,141 as of this weekend, up modestly from the week's low.
- The low: BTC touched $58,000 on June 26, its lowest level since September 2024.
- Sentiment: The Crypto Fear and Greed Index reads 24, firmly in Extreme Fear.
- Flows: Spot Bitcoin ETF products have run roughly six consecutive weeks of net outflows, the longest redemption streak of the year.
- Key level: $58,000 is the line in the sand. Holding it keeps the bottoming case alive. Losing it opens the door toward $56,000 and the 2024 structure below.
The Levels That Decide What Comes Next
Price action this weekend is compressed into a tight band, and the levels around current price are unusually clean because so much volume changed hands here during the May and June decline. The table below frames the zones that matter for the week ahead.
|
Level
|
Price
|
Why it matters
|
|
Resistance 2
|
$64,000
|
The breakdown shelf from mid-June. Reclaiming it would invalidate the bearish leg and signal the selloff is over.
|
|
Resistance 1
|
$62,000
|
First overhead supply. Bulls need a daily close above here to confirm the bounce has legs.
|
|
Current
|
$60,141
|
The battleground. Price is chopping just above the recent low while buyers and sellers fight for control.
|
|
Support 1
|
$58,000
|
The June 26 low and the lowest print since September 2024. The single most important level on the chart.
|
|
Support 2
|
$56,000
|
Air pocket below the low. A break of $58,000 likely tests here fast on thin liquidity.
|
The honest read is that $60,141 is a no-man's-land. It is too far below resistance to call this a recovery and too far above the low to call it broken. The market is waiting for one of these edges to give way, and the first clean break tends to set the tone for several sessions.
What bulls want to see is a reclaim of $62,000 that holds on a daily close, ideally with ETF flows flipping back to neutral or positive. That would tell you the forced selling has exhausted and dip buyers are stepping in with size. What bears want is a daily close back below $58,000, which would confirm the bounce was a relief rally inside a downtrend and put $56,000 in play almost immediately.
What Drove the Six-Week Selloff
This was not a single-headline crash. It was a slow grind built from four pressures stacking on top of each other, which is why it has been so hard to absorb.
The first and heaviest weight has been the ETF outflows. For most of the year, spot ETF demand was the steady bid underneath every dip. That bid reversed. Roughly six weeks of net redemptions pulled away the marginal buyer right as supply was rising, and the order book felt the difference immediately.
The second pressure came from long-term holders. On-chain data has shown wallets that had held for months distributing coins into strength, the classic late-cycle behavior where patient money sells to whoever is still willing to buy the dip. When old supply meets weakening new demand, price has only one direction to go.
The third pressure is rotation. A large slice of speculative capital has chased the AI equity trade, where momentum has been relentless and the narrative feels cleaner than crypto's. Money that might have bought this Bitcoin dip went into chips and data-center names instead, and that is a real opportunity cost when the same wallets only have so much risk budget to deploy. The fourth pressure is reflexive. As price fell, leverage got flushed, stops cascaded, and Extreme Fear fed on itself in a loop that punishes anyone trying to catch the exact low. None of these alone breaks a market. Together they produced a $58,000 print nobody wanted, and they explain why the bounce off it has felt heavy rather than convincing.
What Confirms a Bottom Versus What Breaks the Structure
A bottom is a process, not a candle, and the confirmation checklist is concrete. The first signal is a reclaim of $62,000that survives a daily close, because that is the level sellers defended on the way down. The second is ETF flows turning back to neutral or net positive for several sessions, which removes the structural seller that drove the slide. The third is the Fear and Greed Index climbing off 24 without price making a new low, the divergence that usually precedes a real turn.
For traders who want to size a bottom against history, the long-horizon valuation tools are worth a look. The Bitcoin 200-week moving average has acted as the floor in every prior cycle, and the Bitcoin rainbow chart frames where current price sits inside the broader band. Neither is a timing tool, but both tell you if you are buying closer to the floor or the ceiling. A wider set of Bitcoin valuation tools can cross-check the same question. The point of all three is the same. A $58,000 Bitcoin priced against long-cycle averages looks very different from a $58,000 Bitcoin chased at the top of a parabola, and that context is what keeps a trader patient when the tape is ugly.
What breaks the structure is simpler. A decisive daily close below $58,000 invalidates the bottoming case and tells you the relief bounce failed. Below that, the chart thins out toward $56,000, and the September 2024 price structure becomes the reference for where real demand last showed up. The mistake most traders make here is buying the first touch of the low without waiting for confirmation. The disciplined approach is to let price reclaim a level rather than guessing where the falling knife stops.
Sentiment and Flows Behind the Price
Extreme Fear at 24 is a double-edged reading. On one hand, the deepest fear readings have historically clustered near major lows, because by the time everyone is scared the selling is mostly done. On the other hand, fear can stay extreme for weeks while price grinds lower, so the reading is context, not a buy signal on its own.
The flow picture is the part that has to change for sentiment to follow. Live CoinGlass data shows leverage has been repeatedly flushed during the decline, which is healthy in the sense that it removes fuel for further liquidation cascades. Funding rates sitting flat to negative also tell you the market is no longer crowded with leveraged longs begging to be liquidated, and that limits how violent another leg down can get. The Fear and Greed Index confirms positioning is washed out. But the structural seller is the ETF complex, and the daily BTC ETF flow data is the single number to watch each morning. Flows flipping green is the cleanest evidence the marginal buyer is back. Until that happens, every bounce should be treated as a level to fade rather than a trend to chase, and patience beats conviction in a tape that has punished both bulls and bears for six straight weeks.
Frequently Asked Questions
Is Bitcoin bottoming in June 2026?
Bitcoin is testing the bottoming case but has not confirmed it. The $58,000 low on June 26 held on the first test, yet a bottom only confirms with a reclaim of $62,000 and a flip in ETF flows. Until then, treat it as a potential low under construction, not a confirmed one.
What is the most important Bitcoin support level right now?
$58,000 is the line that matters most. It is the June 26 low and the lowest print since September 2024, so a daily close below it would signal the relief bounce failed and open the path toward $56,000 on thin liquidity.
Why did Bitcoin fall to its lowest level since 2024?
Four pressures stacked up. Roughly six weeks of spot ETF outflows removed the steady bid, long-term holders distributed into bounces, speculative capital rotated into AI stocks, and cascading leverage liquidations amplified the move into a $58,000 print.
Does Extreme Fear mean it is time to buy Bitcoin?
A Fear and Greed reading of 24 historically clusters near lows, but fear can stay extreme for weeks while price grinds lower. It is a context signal, not a trigger. Pair it with a level reclaim and a flow reversal before treating it as a buy.
Bottom Line
Bitcoin at $60,141 is balanced on a knife edge between a capitulation low and a deeper flush. The rules for the week are clean. Hold $58,000 and reclaim $62,000 on a daily close, and the $58,000 print on June 26 likely marks the bottom of this six-week slide. Lose $58,000 on a daily close, and $56,000 comes into play fast, with the September 2024 structure as the next real reference below. The tell that decides it is not the candle, it is the flow. When the ETF outflow streak ends and Extreme Fear lifts off 24 without a new low, the bottom is in. Watch the close, watch the flows, and let the level confirm before the trade.
This article is for informational purposes only and does not constitute financial or investment advice. Cryptocurrency trading involves substantial risk. Always conduct your own research before making trading decisions.