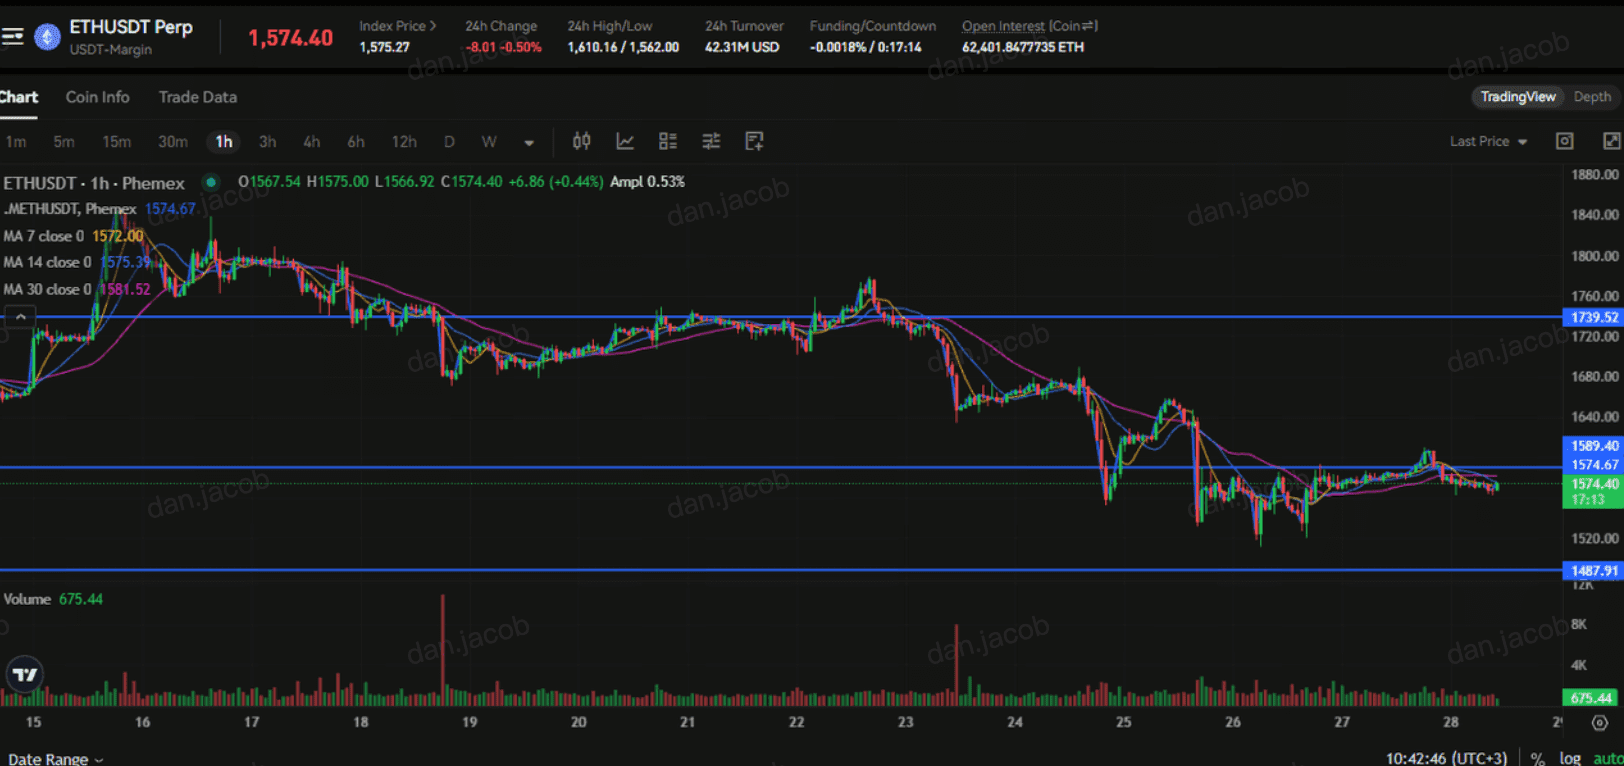
Ethereum is trading at $1,571.86 this weekend, sitting just below the $1,600 line that has acted as the floor and the ceiling for the past two weeks. The price is back at the same zone it bounced from earlier this month, which is what has chart watchers talking about a potential double bottom. Bitcoin is holding $60,141 for context, so this is an ETH-specific story rather than a broad market flush. The selloff that dragged ETH down from the mid-$2,000s has slowed, and now the question is simple. Do buyers defend this level a second time, or do they let it break.
A double bottom is one of the more reliable reversal patterns when it confirms, but the operative word is "when." Most traders see two lows on a chart and call the bottom in before the pattern has actually done anything. Here is what the setup looks like on ETH right now, the exact levels that matter, and the conditions that turn a hopeful chart into a real reversal.
Ethereum Price Snapshot for June 28, 2026
- ETH price: $1,571.86 and pinned just under the $1,600 round number
- 24h change: roughly flat, holding the lows rather than breaking them
- The double-bottom level: ~$1,572, the second test of the early-June low near $1,550
- First support: $1,520, with a deeper line at $1,450 if that gives way
- First resistance: $1,650, then the $1,750 neckline that confirms or kills the pattern
The snapshot tells you most of what you need before reading another word. ETH is compressed into a tight band, the prior low is being retested, and the whole setup lives or dies on $1,520 holding and $1,750 getting reclaimed. Everything below is the detail behind those numbers.
Ethereum Price Levels That Decide the Next Move
The levels here are tight, which is what makes this weekend interesting. ETH has spent two weeks coiling between support in the low $1,500s and resistance near $1,650, and that compression usually resolves with a sharp move in one direction. The table below is the map.
|
Level
|
Price
|
What it means
|
|
Deep support
|
$1,450
|
Loss here invalidates the double bottom and opens a retest of the multi-month lows
|
|
First support
|
$1,520
|
The line both lows have defended. Must hold for the pattern to stay alive
|
|
Current price
|
$1,571.86
|
The retest zone, just under the psychological $1,600 mark
|
|
First resistance
|
$1,650
|
Reclaiming this is the first sign buyers are back in control
|
|
Neckline
|
$1,750
|
A close above here confirms the double bottom and projects higher
|
You can track the live price and 24-hour range on the CoinGecko Ethereum page as ETH works through this zone. The two lows sit close together near $1,550, and $1,520 is the line in the sand underneath them. As long as ETH closes above that on the daily, the pattern is intact. The reason $1,750 matters so much is that it is the peak between the two lows, what chartists call the neckline. Until ETH reclaims it on real volume, every bounce off the lows is just a bounce, not a confirmed reversal. Traders who buy the second low and set a stop below $1,520 are playing the pattern correctly. Traders who buy and call it a bottom with no stop are the ones who get hurt when $1,520 breaks.
What a Double Bottom Is and Is ETH Forming One
A double bottom is a reversal pattern that forms after a sustained downtrend. Price falls to a low, bounces, then sells off again to roughly the same level and holds. The shape looks like a "W." The logic behind it is simple. The first low is where sellers exhaust themselves and buyers step in. The bounce is the relief rally. The second low is the market testing those buyers to see if they will defend the level again, and if they do, it signals that the supply has dried up and the trend may be turning. You can read the full mechanics in this breakdown of the double top and bottom pattern.
So is Ethereum forming one? The raw shape is there. ETH put in a low near $1,550 earlier this month, rallied toward $1,650, and has now come back down to $1,571.86 to retest that low. That is a textbook W in progress. But a double bottom is not confirmed until price closes above the neckline, which sits near $1,750 here. Right now ETH is sitting at the second low, not breaking out from it. The pattern is potential, not proven.
Volume is the tell that separates a real double bottom from a chart that just looks like one. In a healthy setup, the second low forms on lighter volume than the first, showing that selling pressure is fading, and the breakout above the neckline comes on a surge of volume as buyers commit. Open interest and liquidation data on the CoinGlass ETH dashboardhelp confirm that picture, since a breakout backed by fresh longs and a cleared short side carries more weight than one running on fumes. If ETH grinds back to $1,750 on thin, unconvincing volume, the breakout is suspect. If it reclaims the level with a clear pickup in activity, the pattern carries far more weight. This is the same confirmation discipline that applies to most candlestick reversal signals, where the close and the volume matter more than the intraday wick.
The Ethereum-Specific Backdrop Behind the Price
Price patterns do not form in a vacuum, and ETH has its own set of catalysts pulling on the chart right now. The first is ETF flows. Spot Ethereum funds have seen a stretch of net outflows during this selloff, and that institutional selling is part of why ETH has underperformed even on days when Bitcoin held steady. Flows are the cleanest read on large buyers stepping back in or staying away, and you can track the same dynamic for the broader market through the way ETF flows are read. A flip back to net inflows would be a strong tailwind for the double-bottom thesis.
Staking and supply are the structural counterweight. Roughly a quarter of all ETH is locked in staking contracts, which removes it from liquid circulation and tightens the float available to sell. The staking yield also gives long-term holders a reason to sit through drawdowns rather than dump into weakness, which is part of why ETH lows have tended to find buyers. On the news side, the Ethereum Foundation has been working through a restructuring of its treasury and research teams this year, shifting how it funds protocol development and manages its own ETH holdings. Markets watch Foundation selling closely because it can add supply at exactly the wrong moment, so any clarity that the restructuring is not a precursor to heavy selling tends to calm nerves.
Network activity rounds out the picture. Gas fees have stayed low through this drawdown as a growing share of transactions migrates to Ethereum Layer 2 solutions, where rollups settle activity cheaply and post proofs back to the mainnet. Low fees are a double-edged read. They signal cheaper usage and healthy L2 adoption, but they also mean less ETH is burned, which softens the deflationary pressure that supported the price in higher-activity periods. Broader market sentiment sits in the mix too, and the Crypto Fear and Greed Index reading during this drawdown shows the kind of caution that often coincides with a low rather than a top. None of these factors moves the chart on their own this weekend, but together they shape how the $1,520 floor behaves when it gets tested again.
What Confirms the Reversal Versus What Invalidates It
The line between a confirmed double bottom and a failed one is concrete, not a feeling. Here is the checklist on both sides.
Confirmation looks like this. ETH holds $1,520 on a daily close through the retest, reclaims $1,650 as support rather than resistance, and then closes above the $1,750 neckline on rising volume. A return of net ETF inflows in the same window adds conviction, because it shows the institutional selling that drove the selloff has flipped. If all three price conditions line up, the measured-move target for a confirmed double bottom projects roughly $200 above the $1,750 neckline, taking the height of the pattern and adding it to the breakout point.
Invalidation is just as clear. A daily close below $1,520 breaks the structure that both lows defended, and a loss of $1,450 under volume confirms that sellers have taken control again and opens a retest of the deeper lows. Continued ETF outflows, fresh Foundation selling, or a sharp Bitcoin breakdown would each raise the odds of that outcome. The honest read is that ETH is balanced on the knife's edge right now. It is sitting exactly at the level that decides which way this resolves, and the chart has not told you the answer yet. That is why the disciplined move is to wait for the close above $1,750 or the break below $1,520 rather than guessing the direction in the middle.
FAQ
Is Ethereum forming a double bottom?
The shape is there. ETH put in a low near $1,550 earlier in June, bounced toward $1,650, and has now retested that low at $1,571.86, which traces a W on the chart. But the pattern is not confirmed until ETH closes above the neckline near $1,750 on rising volume. Right now it is a potential double bottom, not a proven one.
Will ETH recover?
Nobody can promise a recovery, and anyone giving you a specific price target with certainty is guessing. What the chart says is that ETH has a credible reversal setup if it holds $1,520 and reclaims the $1,750 neckline. A flip back to net ETF inflows would strengthen that case. A daily close below $1,520 would weaken it considerably and point lower instead.
What is ETH support right now?
The first support is $1,520, the level both recent lows have defended and the floor the double bottom depends on. Below that, the next meaningful line is $1,450, and losing it would open a retest of the multi-month lows. On the upside, $1,650 is the first resistance and $1,750 is the neckline that confirms the pattern.
Why is Ethereum underperforming Bitcoin?
Spot Ethereum ETFs have seen net outflows during this selloff while institutional demand rotated elsewhere, which pressured ETH more than BTC on several recent sessions. Low gas fees from the migration of activity to Layer 2 networks have also softened the deflationary burn that supported ETH in busier periods. The double-bottom retest is partly a test of that selling finally exhausting itself.
Bottom Line
ETH at $1,571.86 is sitting on the exact level that decides the next several weeks, retesting the early-June low and tracing a potential double bottom that has not yet confirmed. Hold $1,520 and reclaim $1,750 on rising volume, and the pattern projects a measured move of roughly $200 above that neckline with ETF inflows as the catalyst that gets it there. Lose $1,520 on a daily close and the setup is dead, with $1,450 the next line and the multi-month lows back in play below it. The trade is not to guess the middle. It is to let ETH close above the neckline or break the floor and then act on what the chart actually confirms.
This article is for informational purposes only and does not constitute financial or investment advice. Cryptocurrency trading involves substantial risk. Always conduct your own research before making trading decisions.