Bitcoin dominance is climbing toward 58% while most large-cap altcoins keep bleeding, and that single chart tells you more about the current market regime than any individual price. With Bitcoin trading at $60,141 and the Altcoin Season Index sitting deep in "Bitcoin Season," capital is doing what it always does in a risk-off phase. It is hiding in the asset traders trust most and abandoning the ones they trust least.
Most large-cap alts are red across the board, with ETH at $1,572, SOL at $70.78, and XRP at $1.05. The numbers matter, but the relationship between them matters more. When BTC falls and alts fall harder, dominance rises even though Bitcoin itself is down.
Here is what Bitcoin dominance actually measures, why it rises in bear phases, what a high-and-rising reading signals for the cycle, and how traders use it to time rotation.
Bitcoin Dominance Snapshot for June 28, 2026
- BTC dominance: ~58% and rising (BTC's share of total crypto market cap)
- Bitcoin price: $60,141, down with the broader market but holding share
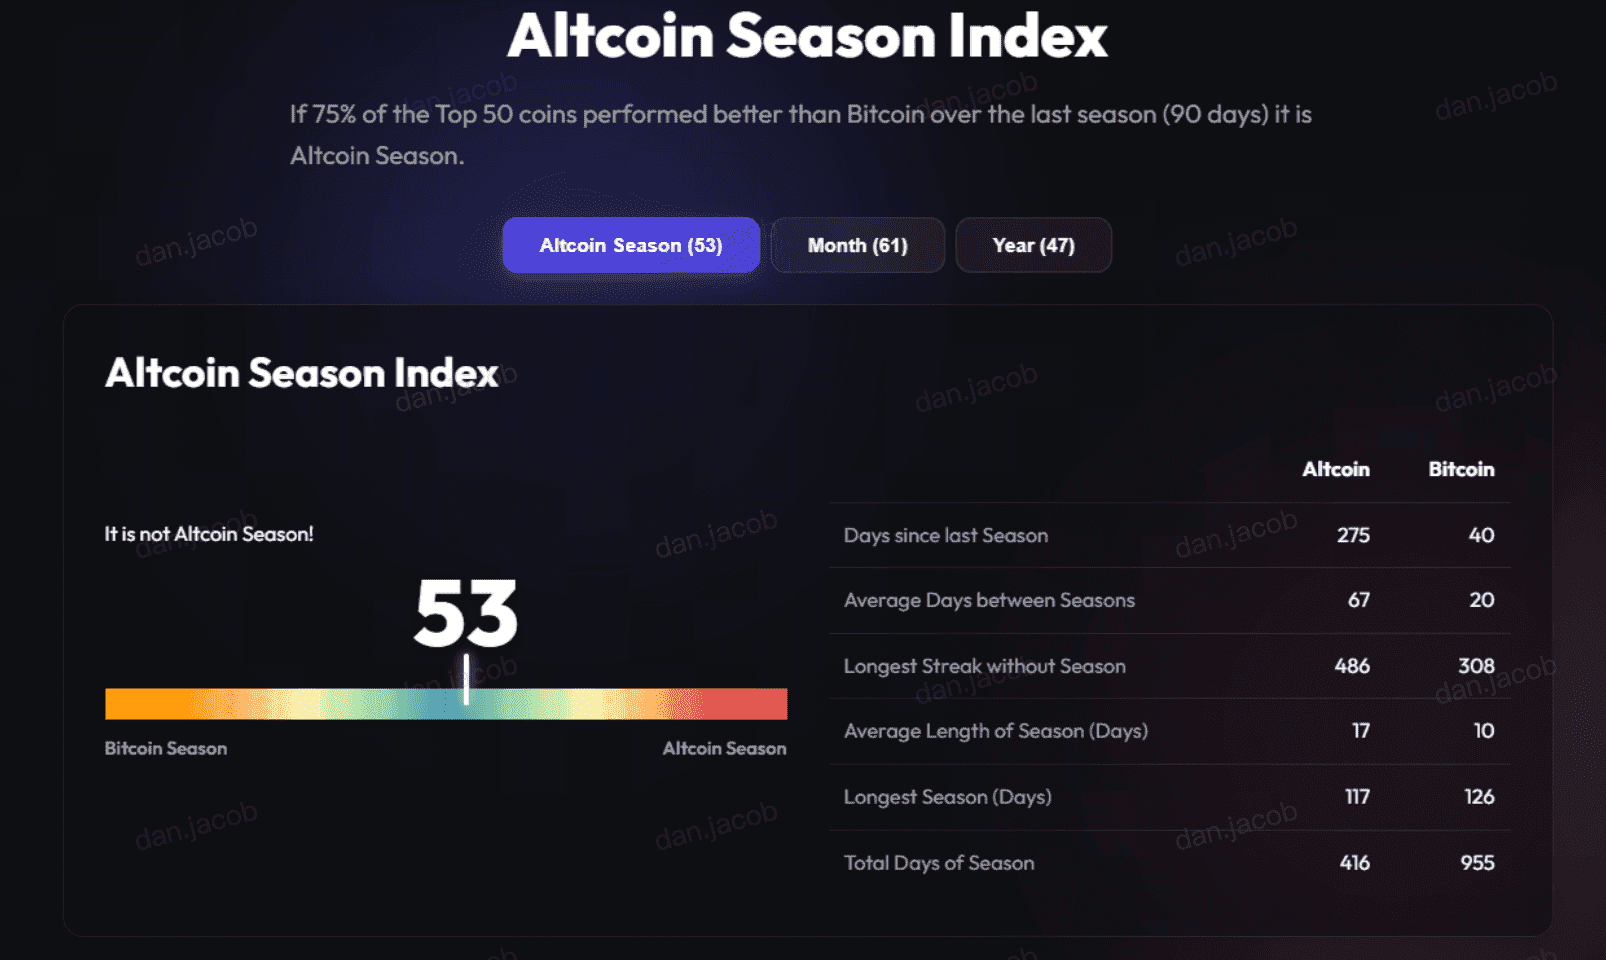
- Altcoin Season Index: deep in "Bitcoin Season" territory, nowhere near the altseason threshold
- ETH: $1,572, underperforming BTC on a rolling basis like most large caps
- Alt underperformance: broad and persistent, with SOL at $70.78 and XRP at $1.05 both red
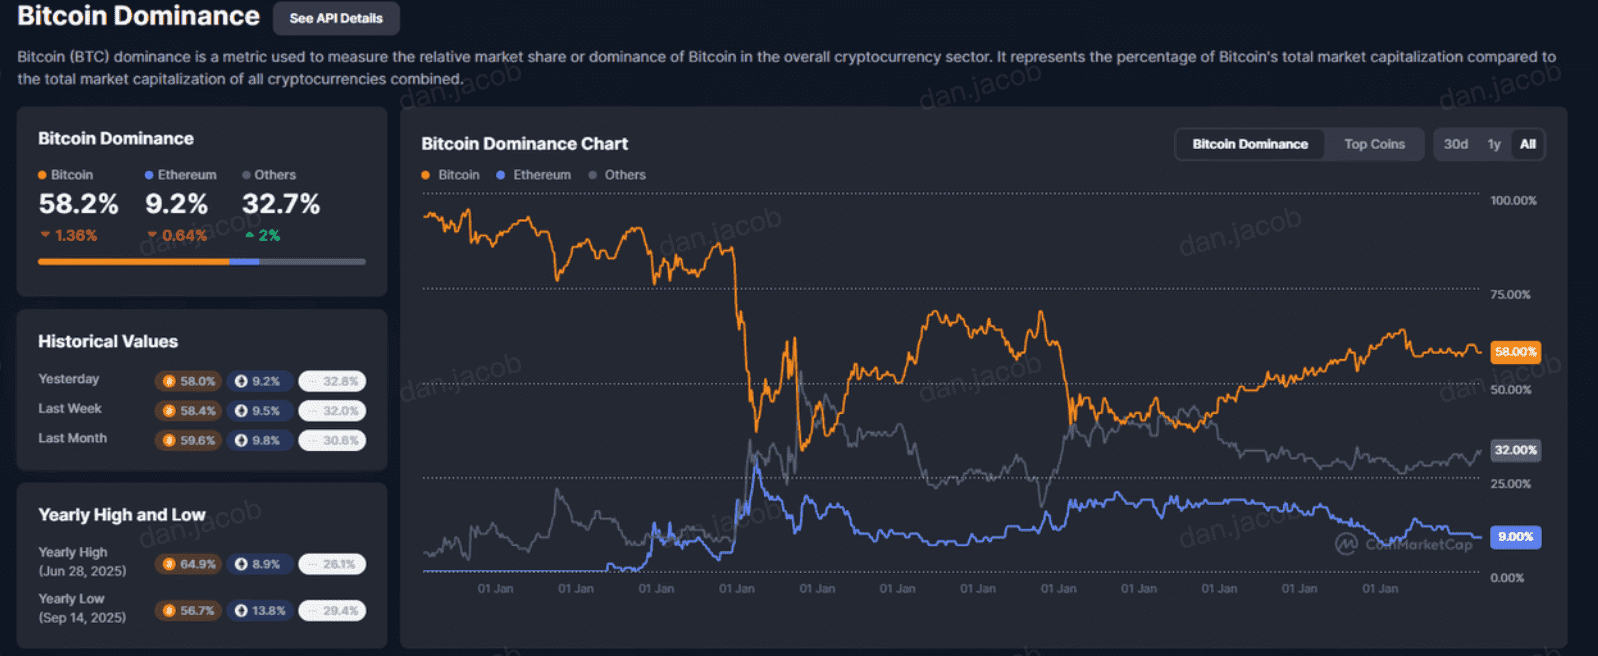
Source: Coinmarketcap
What Bitcoin Dominance Is and How to Read It
Bitcoin dominance is Bitcoin's share of the total cryptocurrency market capitalization. You take BTC's market cap, divide it by the market cap of every crypto asset combined, and the result is a percentage. At ~58%, it means Bitcoin alone accounts for roughly 58 cents of every dollar sitting in the crypto market, and everything else, the thousands of altcoins, splits the remaining 42 cents.
The number on its own is not bullish or bearish. What matters is the direction it is moving and what is driving that move. Dominance can rise because Bitcoin is pumping while alts stay flat, or because Bitcoin is falling slower than alts are collapsing. Those two scenarios look identical on the chart but mean very different things for your portfolio. Right now we are firmly in the second case. Bitcoin is down, but altcoins are down harder, so BTC's share of the shrinking pie keeps growing.
This is the single most common mistake traders make with this metric. They see dominance climbing and assume Bitcoin is strong in absolute terms. A rising reading during a drawdown is not a sign of Bitcoin strength. It is a sign of altcoin weakness, with the pie getting smaller and Bitcoin simply losing value more slowly than the alts around it.
To read dominance properly, always pair it with the absolute BTC price and with a breadth tool like the Altcoin Season Index, which tracks what percentage of the top 100 altcoins have outperformed Bitcoin over the trailing 90 days. When it sits deep in "Bitcoin Season," as it does now, it confirms what the dominance chart is showing. Capital is not rotating into alts. It is rotating out.
Why Bitcoin Dominance Rises in Risk-Off and Bear Phases
Dominance rising during a sell-off is not random. It reflects a predictable flight-to-safety hierarchy inside crypto. When traders get scared, they sell their riskiest holdings first, and altcoins are categorically riskier than Bitcoin. They are smaller, less liquid, more leveraged, and more dependent on continuous narrative momentum to hold their valuations.
Money leaving a falling altcoin generally goes to one of two places. It rotates into Bitcoin, treated as the reserve asset of the crypto market, or it exits into stablecoins and fiat entirely. Both flows push dominance up, one by adding to BTC's market cap relative to alts and the other by shrinking the total altcoin market cap faster than Bitcoin's.
The reason most retail traders get caught here is that they hold their alts too long, hoping for a bounce, while smarter capital has already rotated down the risk curve. ETH at $1,572, SOL at $70.78, and XRP at $1.05 are not isolated price stories. They are the visible result of the same capital flight that is lifting the dominance reading.
There is a historical rhythm to this. Dominance tends to peak near the depths of bear markets and bottom near the euphoric tops of bull markets, when retail piles into alts and BTC's share gets diluted. Tools like the Bitcoin rainbow chart and the Bitcoin 200-week moving average help frame where the cycle sits, and a rising dominance reading usually lines up with the colder, more fearful zones on both.
What a High and Rising Dominance Signals for the Cycle
A dominance reading near 58% and climbing carries a fairly direct message about where the cycle is. It says altseason has not arrived and is not close. As long as the majority of the top 100 alts keep underperforming Bitcoin, the Altcoin Season Index stays buried in Bitcoin Season and broad altcoin outperformance simply is not happening.
Historically, dominance needs to fall and sustain below the low-50s before a genuine altcoin rotation gets confirmed. A brief dip under 55% that immediately recovers is not the start of altseason. It is noise inside a Bitcoin-dominant regime. The threshold matters because dominance, like the index, is a breadth signal that only flips when capital is broadly willing to take on altcoin risk again, and that willingness shows up as a sustained decline in BTC's share, not a one-day wobble.
The table below frames what different dominance regimes have typically meant for traders.
|
Dominance regime
|
What it usually means
|
Typical alt behavior
|
|
High and rising (current, ~58%+)
|
Risk-off, flight to BTC, fear dominant
|
Alts bleed, underperform BTC, no altseason
|
|
High and flat
|
Bitcoin-led market, consolidation
|
Alts tread water, wait for BTC direction
|
|
Falling from a high
|
Early rotation, risk appetite returning
|
Large-cap alts begin outperforming first
|
|
Low and falling
|
Full altseason, euphoria
|
Broad alt outperformance, retail FOMO
|
The current setup sits squarely in the top row. That does not mean alts cannot bounce. It means any bounce is happening against the prevailing capital flow, not with it, and bounces against the flow are the ones that trap the most people.
The Nuance Most Dominance Charts Hide
Raw Bitcoin dominance has two blind spots that change how you should interpret it. The first is stablecoins. Standard dominance calculations include stablecoin market cap in the total, so when traders flee alts into USDT or USDC rather than into BTC, dominance can look less dramatic than the actual flight to safety really is. A rising stablecoin share tells you capital is sitting on the sidelines, ready to redeploy but not yet committing to either Bitcoin or alts.
The second blind spot is Ethereum. Ethereum is large enough that ETH's behavior distorts the whole altcoin picture. When ETH bleeds alongside the rest of the market, as it is now at $1,572, it drags the broad altcoin market cap down and inflates BTC dominance. Some traders watch the ETH/BTC ratio separately, because Ethereum often leads the rotation. ETH starting to outperform BTC is frequently the first crack in a high-dominance regime, before the smaller alts follow.
This is why no single number should drive a decision. Pairing dominance with the Altcoin Season Index, stablecoin share, and the ETH/BTC ratio gives a far more honest picture than the headline percentage alone, and there is a useful toolkit for this kind of cross-checking in this rundown of Bitcoin valuation and analysis tools.
How Traders Use Dominance to Time Rotation
Dominance is most useful as a rotation timing tool, not a buy or sell signal on its own. The practical playbook is built around the direction of the trend rather than its absolute level.
- Dominance rising, deep Bitcoin Season. Favor Bitcoin over alts or hold stablecoins. This is the current regime. Fighting it by loading up on alts is how most accounts bleed.
- Dominance flattening at a high. Stop adding alt risk but start building a watchlist. The market is deciding, and the next directional move sets the tone.
- Dominance rolling over from a high. This is the early rotation signal. Large-cap alts and ETH typically move first. The ETH/BTC ratio turning up is an important confirmation.
- Dominance falling and the Altcoin Season Index climbing toward 75. Rotation is confirmed and broad. By this stage the easy entry is gone, so risk management matters more than chasing.
The discipline that separates traders who profit from rotation from those who get chopped up is simple. They wait for the dominance trend to confirm before committing size to alts, and they respect that a high-and-rising reading is a reason to stay defensive. The Altcoin Season Index plus a live global market cap and BTC dominance dashboard are the two free reads worth checking daily, and for the dominance chart itself the BTC.D chart on TradingView is the standard reference.
Frequently Asked Questions
What is Bitcoin dominance?
Bitcoin dominance is Bitcoin's market capitalization expressed as a percentage of the total cryptocurrency market cap. At ~58%, it means Bitcoin accounts for about 58% of all value in the crypto market, with every altcoin combined making up the rest. It is a breadth gauge for where capital is concentrated.
Is rising Bitcoin dominance bullish or bearish?
It depends on why it is rising. When dominance climbs because Bitcoin is falling slower than altcoins in a drawdown, as it is now, it is a bearish signal for the broad market and a sign of fear, not Bitcoin strength. When it rises because BTC is leading a healthy rally, it can be constructive. Always pair the dominance direction with the absolute BTC price.
What is altseason?
Altseason is a phase where the majority of altcoins outperform Bitcoin, usually marked by the Altcoin Season Index crossing 75 and Bitcoin dominance falling and sustaining below the low-50s. With the index deep in Bitcoin Season and dominance near 58% and rising, the current market is the opposite of altseason.
Does Bitcoin dominance predict altcoin season?
Not on its own. Dominance and the Altcoin Season Index are breadth signals that confirm rotation rather than predict it, because both rely on trailing data. The most useful early tell is dominance rolling over from a high while the ETH/BTC ratio turns up.
Bottom Line
Dominance near 58% and rising, with the Altcoin Season Index deep in Bitcoin Season and ETH at $1,572, SOL at $70.78, and XRP at $1.05 all red, describes a single market state. Capital is defensive, alts are bleeding harder than Bitcoin, and the rotation into alts has not begun. The signal to watch is not the absolute dominance number but its direction. As long as it keeps climbing, fighting it with alt longs is the expensive trade. The first real evidence of a turn is dominance rolling over from its high while the ETH/BTC ratio starts to recover, and until that shows up, Bitcoin remains where the market is hiding.
This article is for informational purposes only and does not constitute financial or investment advice. Cryptocurrency trading involves substantial risk. Always conduct your own research before making trading decisions.