Bitcoin has been touted as the best investment of the Decade by big media houses like CNBC and FOX. A Stunning 90000%+ returns over a decade is something that’s unimaginable for any sort of investor, traditional or otherwise.
The catch is, that since Bitcoin already gave such colossal returns, the probability for repeating that feat over this Decade are of course very bleak. What is good about the progress that Bitcoin made over this decade, both technologically and price wise, is that the ecosystem and technology that surrounds it, for traders, investors, analysts and enthusiasts alike, has made leaps and bounds of progress.With such progress and interest garnered by the media, there are many traders and investors looking for a winning strategy on how to trade this commodity.
Our objective with this article is to introduce 7 of the best evaluation and analytical methods for Bitcoin, so you can include them in your crypto trading strategy.
Without further ado let’s dive right into these tools.
1. MVRV- Z Score
MVRV Z-Score uses blockchain analysis to identify periods where Bitcoin is extremely over or undervalued relative to its ‘fair value’.
It uses three metrics:
- Market Value (blue line): Otherwise known as total market capitalization, it applies to Bitcoin if you were to multiply the latest available BTCUSD trading price on exchanges by the number of bitcoins mined thus far
- Realised Value (orange line): Instead of counting all of the mined coins at equal, current price, the UTXOs are aggregated and assigned a price based on the BTCUSD market price at the time when said UTXOs last moved.UTXO stands for the unspent output from bitcoin transactions. Each bitcoin transaction begins with coins used to balance the ledger.Unspent simply means that the receiving address has not used those coins yet. Realized cap’s effectiveness intuitively seems to adjust for two aspects of BTC’s nature: (1) lost coins, and (2) coins used for hodling, establishing the collective psychological sum of entries when users began seeing Bitcoin’s value and long-term potential.
- Z-score (red line): A standard deviation test that pulls out the extremes in the data between market value and realised value.
How The MVRV- Z Score Can be Used
Due to the larger marketcap for Bitcoin the creators have highlighted we may not hit the upper red band on Bitcoin during market tops, as market cap decreases in volatility, we believe that the upper threshold of MVRV might not prove as reliable — as market cap overextends less and less above realized cap as time progresses.
It shows when market value is far below realised value, highlighted by z-score entering the green box. Buying Bitcoin during these periods has historically produced great returns.
The Z- Score is currently above the green box highlighting we are not in the ideal market-cycle accumulation bottom zone.

Created By:
@aweandwonder who has unfortunately since deleted the original article and his online profile.
He built on the initial work to create MVRV by Murad Mahmudov and David Puell of Adaptive Capital
Charts At: LookintoBitcoin

2. Bitcoin Logarithmic Growth Indicator
This is based on the premise that when we plot the Bitcoin Chart not only in logarithmic scale price wise(this is a common feature available in most charting platforms like Tradingview), we also chart Bitcoin on logarithmic scale time wise. i.e both the X and Y axis of the chart are in log.

As a result, you can draw 1 trendline across the tops of each market cycle and 1 trendline joining the accumulation zones of each market cycle.
Quantadelic then added fib levels to this concept and we see that price reacts very well to each of the key Fib lines.
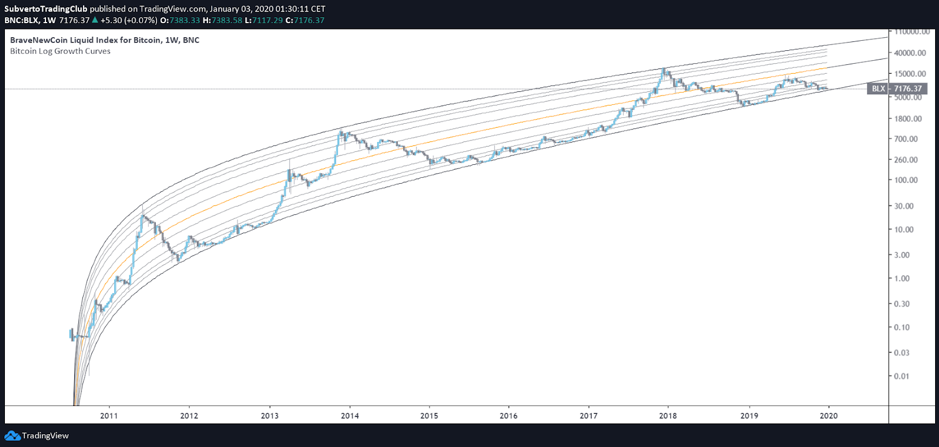
The log lines on this indicator have been adjusted for Tradingview and its limitations as to not being able to provide logarithmic data of the Horizontal Axis.
How The Bitcoin Logarithmic Growth Indicator Can be Used:
The accumulation phases of marketcycles at the bottom band and the Top’s of marketcycles at the top band can both be gauged using this indicator. Also there is a lot of useful reactions to the different Fibonacci levels which can be used in confluence with other horizontal support and resistance levels.
Currently Bitcoin is sitting within the bottom accumulation zone according to this Indicator.
Here’s the Script which has been shared on Tradingview.
Created By:
@quantadelic created this Indicator based off of @hcburger1’s medium article on Bitcoin’s natural long term power law corridor of growth.
3. On Chain Metrics of BTC Addresses with 100 BTC + Balance

A very interesting indicator in its own right.
100 BTC at today’s prices amount to 740,000 $
That’s a sum either large players, institutions or old whales in the system use. Many will use that amount because it’s not overly visible during transactions and transfers.
Using multiple addresses with 100 BTC is a viable solution to try and remain less visible in the ever so watchful eye of the blockchain metric scanning bots and programs.
How it can be Used:
You can see at the end of Nov 2018 we had a steep drop in BTC addresses to print the BTC top only a couple of weeks later.
Aug 2018 was another significant drop in number of addresses.
Even though price stayed stable for another 3 months, the next direction of price was again a very steep drop in Nov 2018.
The 2019 rise for BTC showed another very interesting pattern. Unlike the beginning of the previous BTC cycle we replicated, the end of the previous cycle, as in this cycle the addresses started to decline right after the first impulse and the 2015 cycle we had a significant gain in address till about mid cycle in 2016.
More than 100 BTC + addresses were reducing as we climbed in price. And near the top we had another very steep drop. This time only 1 week before the actual topping out of price.
The end of September has printed out the current bottom in 100 BTC + addresses at 16052.
Now it’s for us to see whether we will start to see a rise in this number while price consolidates or rises, or whether the smart money is still exiting this ecosystem.
Charts at: Glassnode

4 200 Moving Averages on the Weekly Timeframe
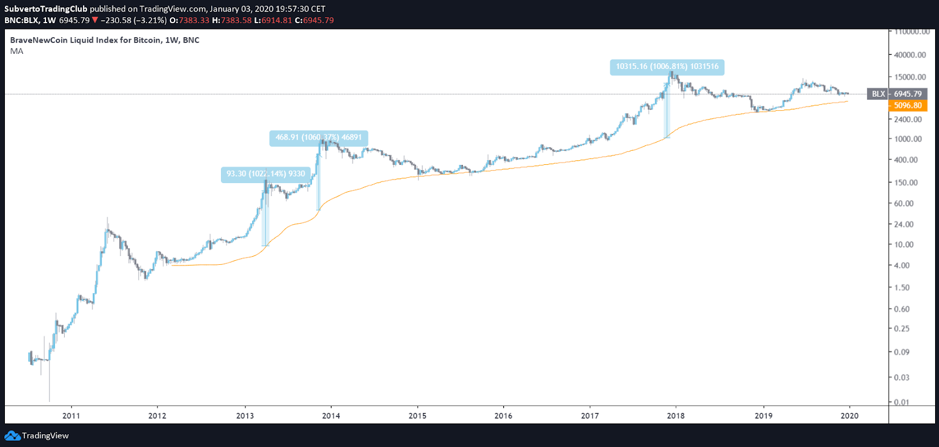
Moving Averages are exceptionally useful tools used to identify momentum and are used by various Algorithms as levels of Support and resistance. When it comes to Bitcoin there isn’t a more important one than the 200MA.
How to Use The Moving Averages:
The 200 MA on the Weekly has marked out the last 3 bottoms in Bitcoin’s Market Cycle. It is also significant, when price stretches more than 1000% from the MA, it is extended, and that zone has historically been a good place to be selling Bitcoin.
The 200 MA Weekly currently Stands at 5096. So if we were to judge a floor where price would be met with a lot of demand, we can know there will be decent buy support at 5100 for BTC if price gets there.
5 Bitcoin Spent Output Profit Ratio (SOPR)
The SOPR a very simple indicator. It’s calculated from spent outputs. It is the realized value (USD) divided by the value at creation (USD) of the output. Or simply: price sold / price paid.
When SOPR > 1, it means that the owners of the spent outputs are in profit at the time of the transaction; otherwise, they are at a loss
By plotting the SOPR of all spent outputs combined, aggregated by the day in which they were spent (using blockchain date), this graph can be produced
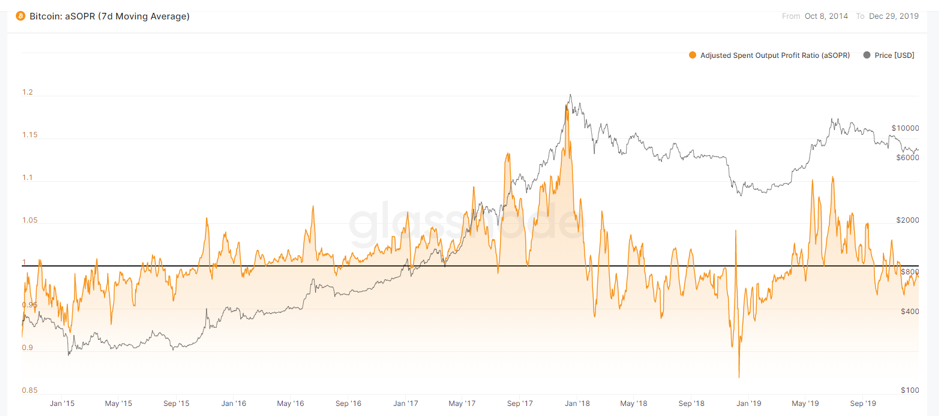
You can observe from this chart SOPR oscillates around the number 1.
How to Use The SOPR:
During a Bull Market SOPR below 1 are rejected and During a Bear Market SOPR above 1 are rejected.
Therefore the SOPR Oscillator serves as a reliable marker for Identifying local tops and bottoms.
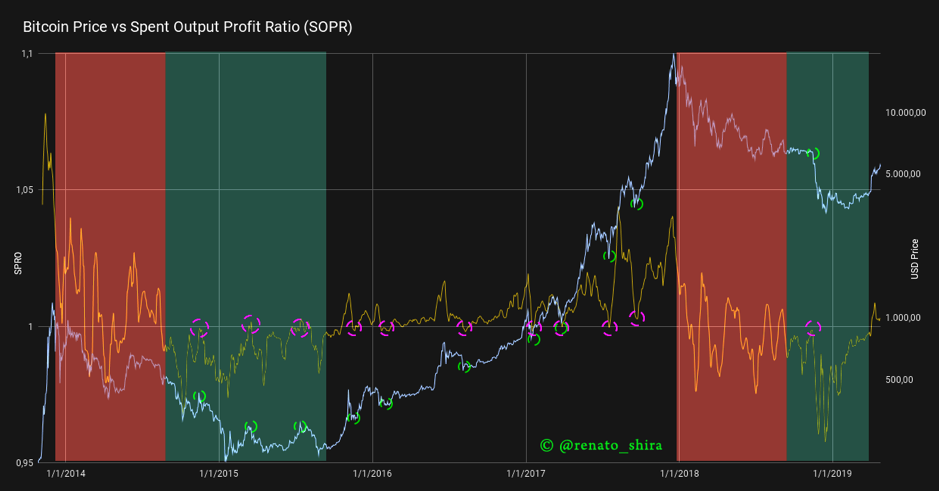
Ignoring the areas in Red where the SOPR is unstable(beginning of trends) works very well.
Currently, according to the SOPR analysis, we are moving between a sideways red period and a bear market as the SOPR is starting to get rejected by the 1 level.
Created by:
Charts at: Glassnode
6 Net Unrealized Profit/Loss
Net Unrealized Profit/Loss is the difference between Relative Unrealized Profit and Relative Unrealized Loss.
It reflects how much of Bitcoin’s circulating supply is at a profit or a loss at any given point.
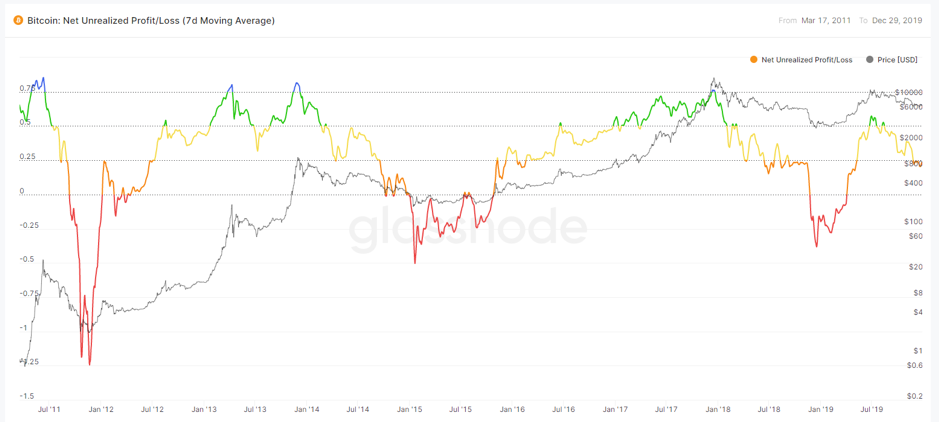
How to Use The Net Unrealized Profit/Loss:
Each time the Unrealized Profit/Loss difference goes above 75 we hit a market top. The best time to buy is when the difference goes into Negative (i.e. The Relative Unrealized Loss > Relative Unrealized Profit). The indicator is color coded with Red being the best time to buy and blue being the time to sell.
We currently stand at .21 which is neither the best time to buy or to sell. The movement of price would define directionality from here. The indicator suggests we are close to a point of value but not exactly there.
Charts at: Glassnode
7 Stock to Flow Model
This is possibly the most famous and followed models in this list.
Bitcoin is the first-ever scarce digital object to exist. There are a limited number of coins in existence and it will take a lot of electricity and computing effort to mine the 3 million outstanding coins still to be mined, therefore the supply rate is consistently low.
Stock-to-flow ratios are used to evaluate the current stock of a commodity (total amount currently available) against the flow of new production (amount mined that specific year).
For store of value (SoV) commodities like gold, platinum, or silver, a high ratio indicates that they are mostly not consumed in industrial applications. Instead, the majority is stored as a monetary hedge, thus driving up the stock-to-flow ratio.
A higher ratio indicates that the commodity is increasingly scarce — and therefore more valuable as a store of value.
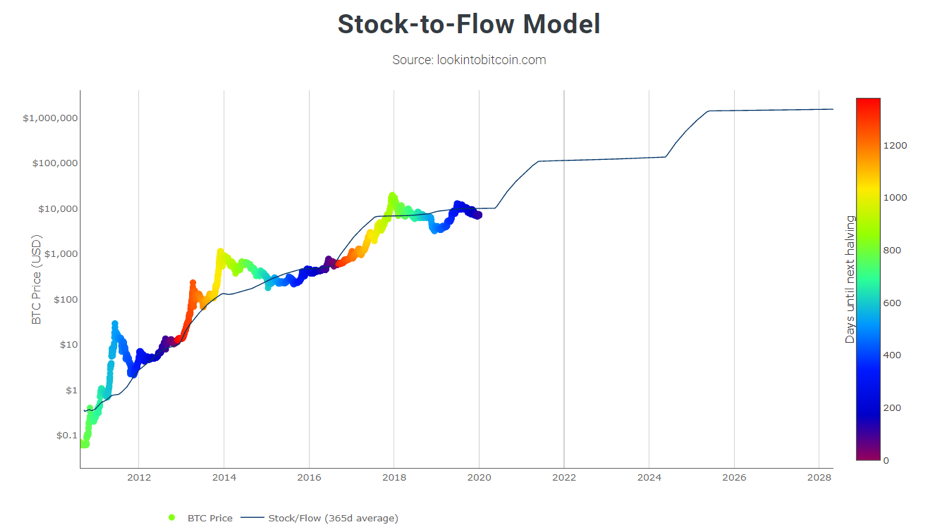
On the above chart price is overlaid on top of the stock-to-flow ratio line. We can see that price has continued to follow the stock-to-flow of Bitcoin over time. The theory, therefore, suggests that we can project where price may go by observing the projected stock-to-flow line, which can be calculated as we know the approximate mining schedule of future Bitcoin mining.
The coloured dots on the price line of this chart show the number of days until the next Bitcoin halving (sometimes called ‘halvening’) event. This is an event where the reward for mining new blocks is halved, meaning miners receive 50% fewer bitcoins for verifying transactions. Bitcoin halvings are scheduled to occur every 210,000 blocks – roughly every four years – until the maximum supply of 21 million bitcoins has been generated by the network. That makes stock-to-flow ratio (scarcity) higher so in theory price should go up. This has held true previously in Bitcoin’s history.
The stock-to-flow line on this chart incorporates a 365-day average into the model to smooth out the changes caused in the market by the halving events.
The only significant drawback of this model is that it predicts symmetrical gains, whereas we already know that not only in Bitcoin’s life cycle, but that of any other asset, the gains are always asymmetrical and diminishing. So it is important to note this has not been taken into consideration.
We are currently below the Stock to Flow line. It’s important to note that the halving is only 5 months away. Historically this period has generated significant interest in BTC.
Created By:
Charts At: LookintoBitcoin